Free Statistics

of Irreproducible Research!

Author's title

Author*The author of this computation has been verified*
R Software Modulerwasp_smp.wasp
Title produced by softwareStandard Deviation-Mean Plot
Date of computationFri, 10 Dec 2010 19:06:49 +0000
Cite this page as followsStatistical Computations at FreeStatistics.org, Office for Research Development and Education, URL https://freestatistics.org/blog/index.php?v=date/2010/Dec/10/t1292007904zf3uad0wtkbadfr.htm/, Retrieved Mon, 29 Apr 2024 09:53:10 +0000
Statistical Computations at FreeStatistics.org, Office for Research Development and Education, URL https://freestatistics.org/blog/index.php?pk=107899, Retrieved Mon, 29 Apr 2024 09:53:10 +0000
QR Codes:

Original text written by user:
IsPrivate?No (this computation is public)
User-defined keywords
Estimated Impact114
Family? (F = Feedback message, R = changed R code, M = changed R Module, P = changed Parameters, D = changed Data)
-     [Univariate Data Series] [data set] [2008-12-01 19:54:57] [b98453cac15ba1066b407e146608df68]
- RMP   [Standard Deviation-Mean Plot] [Unemployment] [2010-11-29 10:34:47] [b98453cac15ba1066b407e146608df68]
-   PD    [Standard Deviation-Mean Plot] [Blog 3] [2010-12-10 11:28:43] [1aa8d85d6b335d32b1f6be940e33a166]
-    D        [Standard Deviation-Mean Plot] [Verbetering student] [2010-12-10 19:06:49] [47bfda5353cd53c1cf7ea7aa9038654a] [Current]
Feedback Forum

Post a new message
Dataseries X:
376.974
377.632
378.205
370.861
369.167
371.551
382.842
381.903
384.502
392.058
384.359
388.884
386.586
387.495
385.705
378.67
377.367
376.911
389.827
387.82
387.267
380.575
372.402
376.74
377.795
376.126
370.804
367.98
367.866
366.121
379.421
378.519
372.423
355.072
344.693
342.892
344.178
337.606
327.103
323.953
316.532
306.307
327.225
329.573
313.761
307.836
300.074
304.198
306.122
300.414
292.133
290.616
280.244
285.179
305.486
305.957
293.886
289.441
288.776
299.149
306.532
309.914
313.468
314.901
309.16
316.15
336.544
339.196
326.738
320.838
318.62
331.533
335.378


Summary of computational transaction
Raw Inputview raw input (R code)
Raw Outputview raw output of R engine
Computing time3 seconds
R Server'Sir Ronald Aylmer Fisher' @ 193.190.124.24

\begin{tabular}{lllllllll}
\hline
Summary of computational transaction \tabularnewline
Raw Input & view raw input (R code)  \tabularnewline
Raw Output & view raw output of R engine  \tabularnewline
Computing time & 3 seconds \tabularnewline
R Server & 'Sir Ronald Aylmer Fisher' @ 193.190.124.24 \tabularnewline
\hline
\end{tabular}
%Source: https://freestatistics.org/blog/index.php?pk=107899&T=0

[TABLE]
[ROW][C]Summary of computational transaction[/C][/ROW]
[ROW][C]Raw Input[/C][C]view raw input (R code) [/C][/ROW]
[ROW][C]Raw Output[/C][C]view raw output of R engine [/C][/ROW]
[ROW][C]Computing time[/C][C]3 seconds[/C][/ROW]
[ROW][C]R Server[/C][C]'Sir Ronald Aylmer Fisher' @ 193.190.124.24[/C][/ROW]
[/TABLE]
Source: https://freestatistics.org/blog/index.php?pk=107899&T=0

Globally Unique Identifier (entire table): ba.freestatistics.org/blog/index.php?pk=107899&T=0

As an alternative you can also use a QR Code:  

The GUIDs for individual cells are displayed in the table below:

Summary of computational transaction
Raw Inputview raw input (R code)
Raw Outputview raw output of R engine
Computing time3 seconds
R Server'Sir Ronald Aylmer Fisher' @ 193.190.124.24


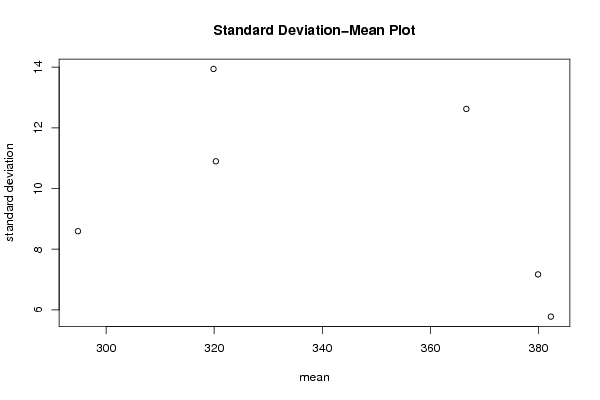
Standard Deviation-Mean Plot
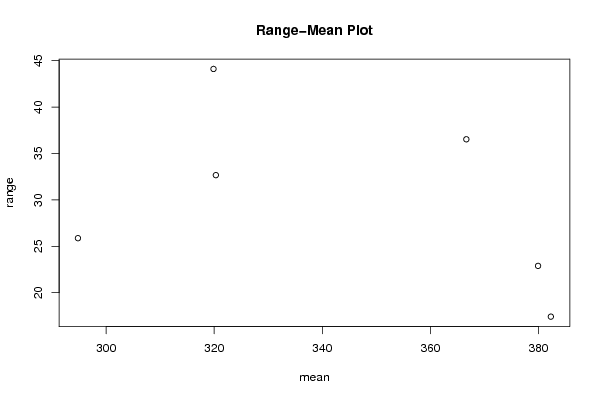
SectionMeanStandard DeviationRange
1379.91157.1696394419296222.891
2382.2804166666675.7773602096826417.425
3366.64266666666712.622813750099336.529
4319.86216666666713.939488335681744.104
5294.7835833333338.5927393606286625.878
6320.299510.897208445702532.6640000000000

\begin{tabular}{lllllllll}
\hline
Standard Deviation-Mean Plot \tabularnewline
Section & Mean & Standard Deviation & Range \tabularnewline
1 & 379.9115 & 7.16963944192962 & 22.891 \tabularnewline
2 & 382.280416666667 & 5.77736020968264 & 17.425 \tabularnewline
3 & 366.642666666667 & 12.6228137500993 & 36.529 \tabularnewline
4 & 319.862166666667 & 13.9394883356817 & 44.104 \tabularnewline
5 & 294.783583333333 & 8.59273936062866 & 25.878 \tabularnewline
6 & 320.2995 & 10.8972084457025 & 32.6640000000000 \tabularnewline
\hline
\end{tabular}
%Source: https://freestatistics.org/blog/index.php?pk=107899&T=1

[TABLE]
[ROW][C]Standard Deviation-Mean Plot[/C][/ROW]
[ROW][C]Section[/C][C]Mean[/C][C]Standard Deviation[/C][C]Range[/C][/ROW]
[ROW][C]1[/C][C]379.9115[/C][C]7.16963944192962[/C][C]22.891[/C][/ROW]
[ROW][C]2[/C][C]382.280416666667[/C][C]5.77736020968264[/C][C]17.425[/C][/ROW]
[ROW][C]3[/C][C]366.642666666667[/C][C]12.6228137500993[/C][C]36.529[/C][/ROW]
[ROW][C]4[/C][C]319.862166666667[/C][C]13.9394883356817[/C][C]44.104[/C][/ROW]
[ROW][C]5[/C][C]294.783583333333[/C][C]8.59273936062866[/C][C]25.878[/C][/ROW]
[ROW][C]6[/C][C]320.2995[/C][C]10.8972084457025[/C][C]32.6640000000000[/C][/ROW]
[/TABLE]
Source: https://freestatistics.org/blog/index.php?pk=107899&T=1

Globally Unique Identifier (entire table): ba.freestatistics.org/blog/index.php?pk=107899&T=1

As an alternative you can also use a QR Code:  

The GUIDs for individual cells are displayed in the table below:

Standard Deviation-Mean Plot
SectionMeanStandard DeviationRange
1379.91157.1696394419296222.891
2382.2804166666675.7773602096826417.425
3366.64266666666712.622813750099336.529
4319.86216666666713.939488335681744.104
5294.7835833333338.5927393606286625.878
6320.299510.897208445702532.6640000000000


Regression: S.E.(k) = alpha + beta * Mean(k)
alpha22.4673073924083
beta-0.0367309504562261
S.D.0.0390273024972722
T-STAT-0.94116036994341
p-value0.399910933722020

\begin{tabular}{lllllllll}
\hline
Regression: S.E.(k) = alpha + beta * Mean(k) \tabularnewline
alpha & 22.4673073924083 \tabularnewline
beta & -0.0367309504562261 \tabularnewline
S.D. & 0.0390273024972722 \tabularnewline
T-STAT & -0.94116036994341 \tabularnewline
p-value & 0.399910933722020 \tabularnewline
\hline
\end{tabular}
%Source: https://freestatistics.org/blog/index.php?pk=107899&T=2

[TABLE]
[ROW][C]Regression: S.E.(k) = alpha + beta * Mean(k)[/C][/ROW]
[ROW][C]alpha[/C][C]22.4673073924083[/C][/ROW]
[ROW][C]beta[/C][C]-0.0367309504562261[/C][/ROW]
[ROW][C]S.D.[/C][C]0.0390273024972722[/C][/ROW]
[ROW][C]T-STAT[/C][C]-0.94116036994341[/C][/ROW]
[ROW][C]p-value[/C][C]0.399910933722020[/C][/ROW]
[/TABLE]
Source: https://freestatistics.org/blog/index.php?pk=107899&T=2

Globally Unique Identifier (entire table): ba.freestatistics.org/blog/index.php?pk=107899&T=2

As an alternative you can also use a QR Code:  

The GUIDs for individual cells are displayed in the table below:

Regression: S.E.(k) = alpha + beta * Mean(k)
alpha22.4673073924083
beta-0.0367309504562261
S.D.0.0390273024972722
T-STAT-0.94116036994341
p-value0.399910933722020


Regression: ln S.E.(k) = alpha + beta * ln Mean(k)
alpha10.6140719201973
beta-1.43517342039747
S.D.1.39534925631338
T-STAT-1.02854064235452
p-value0.361821925844958
Lambda2.43517342039747

\begin{tabular}{lllllllll}
\hline
Regression: ln S.E.(k) = alpha + beta * ln Mean(k) \tabularnewline
alpha & 10.6140719201973 \tabularnewline
beta & -1.43517342039747 \tabularnewline
S.D. & 1.39534925631338 \tabularnewline
T-STAT & -1.02854064235452 \tabularnewline
p-value & 0.361821925844958 \tabularnewline
Lambda & 2.43517342039747 \tabularnewline
\hline
\end{tabular}
%Source: https://freestatistics.org/blog/index.php?pk=107899&T=3

[TABLE]
[ROW][C]Regression: ln S.E.(k) = alpha + beta * ln Mean(k)[/C][/ROW]
[ROW][C]alpha[/C][C]10.6140719201973[/C][/ROW]
[ROW][C]beta[/C][C]-1.43517342039747[/C][/ROW]
[ROW][C]S.D.[/C][C]1.39534925631338[/C][/ROW]
[ROW][C]T-STAT[/C][C]-1.02854064235452[/C][/ROW]
[ROW][C]p-value[/C][C]0.361821925844958[/C][/ROW]
[ROW][C]Lambda[/C][C]2.43517342039747[/C][/ROW]
[/TABLE]
Source: https://freestatistics.org/blog/index.php?pk=107899&T=3

Globally Unique Identifier (entire table): ba.freestatistics.org/blog/index.php?pk=107899&T=3

As an alternative you can also use a QR Code:  

The GUIDs for individual cells are displayed in the table below:

Regression: ln S.E.(k) = alpha + beta * ln Mean(k)
alpha10.6140719201973
beta-1.43517342039747
S.D.1.39534925631338
T-STAT-1.02854064235452
p-value0.361821925844958
Lambda2.43517342039747


Parameters (Session):
par1 = 12 ;
Parameters (R input):
par1 = 12 ;
R code (references can be found in the software module):
par1 <- as.numeric(par1)
(n <- length(x))
(np <- floor(n / par1))
arr <- array(NA,dim=c(par1,np))
j <- 0
k <- 1
for (i in 1:(np*par1))
{
j = j + 1
arr[j,k] <- x[i]
if (j == par1) {
j = 0
k=k+1
}
}
arr
arr.mean <- array(NA,dim=np)
arr.sd <- array(NA,dim=np)
arr.range <- array(NA,dim=np)
for (j in 1:np)
{
arr.mean[j] <- mean(arr[,j],na.rm=TRUE)
arr.sd[j] <- sd(arr[,j],na.rm=TRUE)
arr.range[j] <- max(arr[,j],na.rm=TRUE) - min(arr[,j],na.rm=TRUE)
}
arr.mean
arr.sd
arr.range
(lm1 <- lm(arr.sd~arr.mean))
(lnlm1 <- lm(log(arr.sd)~log(arr.mean)))
(lm2 <- lm(arr.range~arr.mean))
bitmap(file='test1.png')
plot(arr.mean,arr.sd,main='Standard Deviation-Mean Plot',xlab='mean',ylab='standard deviation')
dev.off()
bitmap(file='test2.png')
plot(arr.mean,arr.range,main='Range-Mean Plot',xlab='mean',ylab='range')
dev.off()
load(file='createtable')
a<-table.start()
a<-table.row.start(a)
a<-table.element(a,'Standard Deviation-Mean Plot',4,TRUE)
a<-table.row.end(a)
a<-table.row.start(a)
a<-table.element(a,'Section',header=TRUE)
a<-table.element(a,'Mean',header=TRUE)
a<-table.element(a,'Standard Deviation',header=TRUE)
a<-table.element(a,'Range',header=TRUE)
a<-table.row.end(a)
for (j in 1:np) {
a<-table.row.start(a)
a<-table.element(a,j,header=TRUE)
a<-table.element(a,arr.mean[j])
a<-table.element(a,arr.sd[j] )
a<-table.element(a,arr.range[j] )
a<-table.row.end(a)
}
a<-table.end(a)
table.save(a,file='mytable.tab')
a<-table.start()
a<-table.row.start(a)
a<-table.element(a,'Regression: S.E.(k) = alpha + beta * Mean(k)',2,TRUE)
a<-table.row.end(a)
a<-table.row.start(a)
a<-table.element(a,'alpha',header=TRUE)
a<-table.element(a,lm1$coefficients[[1]])
a<-table.row.end(a)
a<-table.row.start(a)
a<-table.element(a,'beta',header=TRUE)
a<-table.element(a,lm1$coefficients[[2]])
a<-table.row.end(a)
a<-table.row.start(a)
a<-table.element(a,'S.D.',header=TRUE)
a<-table.element(a,summary(lm1)$coefficients[2,2])
a<-table.row.end(a)
a<-table.row.start(a)
a<-table.element(a,'T-STAT',header=TRUE)
a<-table.element(a,summary(lm1)$coefficients[2,3])
a<-table.row.end(a)
a<-table.row.start(a)
a<-table.element(a,'p-value',header=TRUE)
a<-table.element(a,summary(lm1)$coefficients[2,4])
a<-table.row.end(a)
a<-table.end(a)
table.save(a,file='mytable1.tab')
a<-table.start()
a<-table.row.start(a)
a<-table.element(a,'Regression: ln S.E.(k) = alpha + beta * ln Mean(k)',2,TRUE)
a<-table.row.end(a)
a<-table.row.start(a)
a<-table.element(a,'alpha',header=TRUE)
a<-table.element(a,lnlm1$coefficients[[1]])
a<-table.row.end(a)
a<-table.row.start(a)
a<-table.element(a,'beta',header=TRUE)
a<-table.element(a,lnlm1$coefficients[[2]])
a<-table.row.end(a)
a<-table.row.start(a)
a<-table.element(a,'S.D.',header=TRUE)
a<-table.element(a,summary(lnlm1)$coefficients[2,2])
a<-table.row.end(a)
a<-table.row.start(a)
a<-table.element(a,'T-STAT',header=TRUE)
a<-table.element(a,summary(lnlm1)$coefficients[2,3])
a<-table.row.end(a)
a<-table.row.start(a)
a<-table.element(a,'p-value',header=TRUE)
a<-table.element(a,summary(lnlm1)$coefficients[2,4])
a<-table.row.end(a)
a<-table.row.start(a)
a<-table.element(a,'Lambda',header=TRUE)
a<-table.element(a,1-lnlm1$coefficients[[2]])
a<-table.row.end(a)
a<-table.end(a)
table.save(a,file='mytable2.tab')