| Multiple Linear Regression - Estimated Regression Equation |
| Gemiddelde_prijs_vliegticket_in$[t] = + 292.821678002806 + 0.157012705702092`Gemiddelde_olieprijs_in$`[t] + 4.90706693997384Q1[t] + 3.5409335155381Q2[t] -1.63119990889761Q3[t] + 0.413466757769053t + e[t] |
| Multiple Linear Regression - Ordinary Least Squares | |||||
| Variable | Parameter | S.D. | T-STAT H0: parameter = 0 | 2-tail p-value | 1-tail p-value |
| (Intercept) | 292.821678002806 | 6.018055 | 48.6572 | 0 | 0 |
| `Gemiddelde_olieprijs_in$` | 0.157012705702092 | 0.180053 | 0.872 | 0.38705 | 0.193525 |
| Q1 | 4.90706693997384 | 6.291533 | 0.7799 | 0.438827 | 0.219413 |
| Q2 | 3.5409335155381 | 6.265309 | 0.5652 | 0.574302 | 0.287151 |
| Q3 | -1.63119990889761 | 6.249521 | -0.261 | 0.795076 | 0.397538 |
| t | 0.413466757769053 | 0.256631 | 1.6111 | 0.112981 | 0.056491 |
| Multiple Linear Regression - Regression Statistics | |
| Multiple R | 0.558044424545972 |
| R-squared | 0.311413579766845 |
| Adjusted R-squared | 0.247655577893405 |
| F-TEST (value) | 4.88430582227156 |
| F-TEST (DF numerator) | 5 |
| F-TEST (DF denominator) | 54 |
| p-value | 0.000929059806845878 |
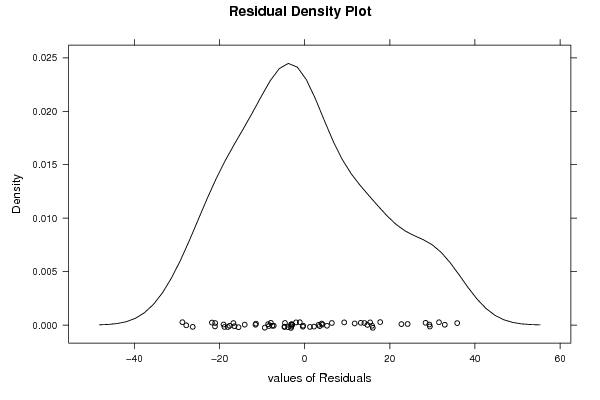
| Multiple Linear Regression - Residual Statistics | |
| Residual Standard Deviation | 17.1005825241527 |
| Sum Squared Residuals | 15791.2158239292 |
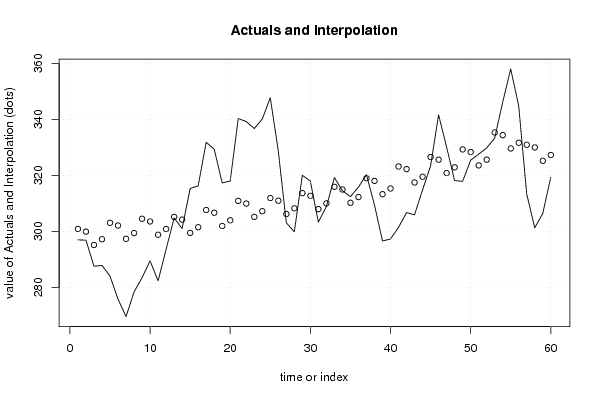
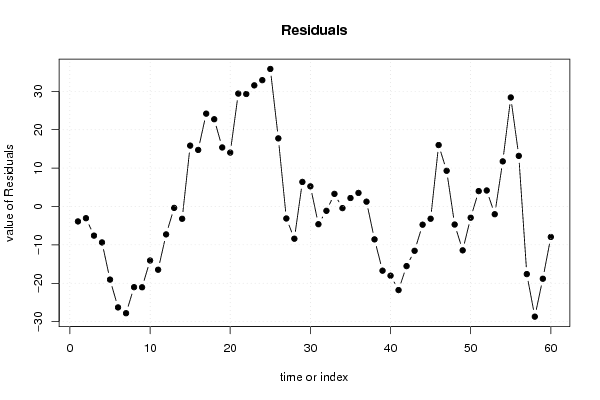
| Multiple Linear Regression - Actuals, Interpolation, and Residuals | |||
| Time or Index | Actuals | Interpolation Forecast | Residuals Prediction Error |
| 1 | 296.95 | 300.842830238625 | -3.89283023862503 |
| 2 | 296.84 | 299.890163571959 | -3.05016357195858 |
| 3 | 287.54 | 295.131496905292 | -7.59149690529192 |
| 4 | 287.81 | 297.176163571959 | -9.36616357195859 |
| 5 | 283.99 | 303.03525085026 | -19.0452508502597 |
| 6 | 275.79 | 302.082584183593 | -26.292584183593 |
| 7 | 269.52 | 297.323917516926 | -27.8039175169263 |
| 8 | 278.35 | 299.368584183593 | -21.0185841835930 |
| 9 | 283.43 | 304.483431236866 | -21.0534312368661 |
| 10 | 289.46 | 303.530764570199 | -14.0707645701995 |
| 11 | 282.3 | 298.772097903533 | -16.4720979035328 |
| 12 | 293.55 | 300.816764570199 | -7.26676457019944 |
| 13 | 304.78 | 305.143407840848 | -0.363407840848122 |
| 14 | 300.99 | 304.190741174181 | -3.2007411741814 |
| 15 | 315.29 | 299.432074507515 | 15.8579254924853 |
| 16 | 316.21 | 301.476741174181 | 14.7332588258186 |
| 17 | 331.79 | 307.604320179233 | 24.1856798207670 |
| 18 | 329.38 | 306.651653512566 | 22.7283464874336 |
| 19 | 317.27 | 301.8929868459 | 15.3770131541003 |
| 20 | 317.98 | 303.937653512566 | 14.0423464874336 |
| 21 | 340.28 | 310.865997316699 | 29.4140026833013 |
| 22 | 339.21 | 309.913330650032 | 29.296669349968 |
| 23 | 336.71 | 305.154663983365 | 31.5553360166346 |
| 24 | 340.11 | 307.199330650032 | 32.910669349968 |
| 25 | 347.72 | 311.888673270853 | 35.8313267291475 |
| 26 | 328.68 | 310.936006604186 | 17.7439933958142 |
| 27 | 303.05 | 306.177339937519 | -3.12733993751914 |
| 28 | 299.83 | 308.222006604186 | -8.39200660418582 |
| 29 | 320.04 | 313.643028433578 | 6.39697156642198 |
| 30 | 317.94 | 312.690361766911 | 5.24963823308864 |
| 31 | 303.31 | 307.931695100245 | -4.62169510024469 |
| 32 | 308.85 | 309.976361766911 | -1.12636176691133 |
| 33 | 319.19 | 315.901394381607 | 3.28860561839269 |
| 34 | 314.52 | 314.948727714941 | -0.428727714940638 |
| 35 | 312.39 | 310.190061048274 | 2.19993895172603 |
| 36 | 315.77 | 312.234727714941 | 3.53527228505936 |
| 37 | 320.23 | 318.97465627223 | 1.25534372776959 |
| 38 | 309.45 | 318.021989605564 | -8.57198960556375 |
| 39 | 296.54 | 313.263322938897 | -16.7233229388971 |
| 40 | 297.28 | 315.307989605564 | -18.0279896055638 |
| 41 | 301.39 | 323.165848627452 | -21.7758486274525 |
| 42 | 306.68 | 322.213181960786 | -15.5331819607858 |
| 43 | 305.91 | 317.454515294119 | -11.5445152941191 |
| 44 | 314.76 | 319.499181960786 | -4.73918196078577 |
| 45 | 323.34 | 326.529584023624 | -3.18958402362447 |
| 46 | 341.58 | 325.576917356958 | 16.0030826430422 |
| 47 | 330.12 | 320.818250690291 | 9.3017493097089 |
| 48 | 318.16 | 322.862917356958 | -4.70291735695774 |
| 49 | 317.84 | 329.263698469931 | -11.4236984699311 |
| 50 | 325.39 | 328.311031803264 | -2.92103180326438 |
| 51 | 327.56 | 323.552365136598 | 4.00763486340230 |
| 52 | 329.77 | 325.597031803264 | 4.17296819673562 |
| 53 | 333.29 | 335.304500498324 | -2.0145004983237 |
| 54 | 346.1 | 334.351833831657 | 11.748166168343 |
| 55 | 358 | 329.593167164990 | 28.4068328350096 |
| 56 | 344.82 | 331.637833831657 | 13.1821661683430 |
| 57 | 313.3 | 330.913378359869 | -17.6133783598694 |
| 58 | 301.26 | 329.960711693203 | -28.7007116932027 |
| 59 | 306.38 | 325.202045026536 | -18.8220450265360 |
| 60 | 319.31 | 327.246711693203 | -7.93671169320268 |
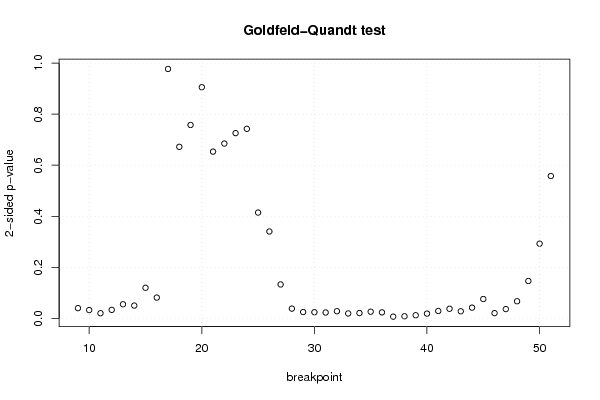
| Goldfeld-Quandt test for Heteroskedasticity | |||
| p-values | Alternative Hypothesis | ||
| breakpoint index | greater | 2-sided | less |
| 9 | 0.0199897812368523 | 0.0399795624737046 | 0.980010218763148 |
| 10 | 0.0162348120361732 | 0.0324696240723463 | 0.983765187963827 |
| 11 | 0.0100484527893442 | 0.0200969055786884 | 0.989951547210656 |
| 12 | 0.0166301168333204 | 0.0332602336666408 | 0.98336988316668 |
| 13 | 0.0275343711443689 | 0.0550687422887377 | 0.972465628855631 |
| 14 | 0.0250359225929328 | 0.0500718451858655 | 0.974964077407067 |
| 15 | 0.05986749298942 | 0.11973498597884 | 0.94013250701058 |
| 16 | 0.0407101809817369 | 0.0814203619634739 | 0.959289819018263 |
| 17 | 0.511354304218223 | 0.977291391563554 | 0.488645695781777 |
| 18 | 0.663943378721438 | 0.672113242557124 | 0.336056621278562 |
| 19 | 0.621131621444777 | 0.757736757110446 | 0.378868378555223 |
| 20 | 0.547164804434164 | 0.905670391131672 | 0.452835195565836 |
| 21 | 0.673317433052486 | 0.653365133895028 | 0.326682566947514 |
| 22 | 0.657550107506634 | 0.684899784986732 | 0.342449892493366 |
| 23 | 0.63709943377641 | 0.72580113244718 | 0.36290056622359 |
| 24 | 0.628664076761227 | 0.742671846477546 | 0.371335923238773 |
| 25 | 0.792722560069443 | 0.414554879861114 | 0.207277439930557 |
| 26 | 0.82979952243968 | 0.34040095512064 | 0.17020047756032 |
| 27 | 0.93361325760029 | 0.132773484799420 | 0.0663867423997101 |
| 28 | 0.980942308787635 | 0.0381153824247307 | 0.0190576912123654 |
| 29 | 0.987592950367727 | 0.0248140992645450 | 0.0124070496322725 |
| 30 | 0.988001616982993 | 0.0239967660340141 | 0.0119983830170071 |
| 31 | 0.988560915458366 | 0.0228781690832674 | 0.0114390845416337 |
| 32 | 0.986023591487586 | 0.0279528170248286 | 0.0139764085124143 |
| 33 | 0.99040239803153 | 0.019195203936939 | 0.0095976019684695 |
| 34 | 0.989641101128603 | 0.0207177977427943 | 0.0103588988713972 |
| 35 | 0.986980291721988 | 0.0260394165560247 | 0.0130197082780124 |
| 36 | 0.988299672826336 | 0.0234006543473279 | 0.0117003271736640 |
| 37 | 0.996677773581693 | 0.00664445283661456 | 0.00332222641830728 |
| 38 | 0.995929896506646 | 0.00814020698670848 | 0.00407010349335424 |
| 39 | 0.993891249724934 | 0.0122175005501318 | 0.00610875027506588 |
| 40 | 0.990686892731659 | 0.0186262145366828 | 0.00931310726834142 |
| 41 | 0.985573750450029 | 0.0288524990999422 | 0.0144262495499711 |
| 42 | 0.981220926407478 | 0.037558147185043 | 0.0187790735925215 |
| 43 | 0.986166092259355 | 0.0276678154812892 | 0.0138339077406446 |
| 44 | 0.978990140865529 | 0.0420197182689421 | 0.0210098591344710 |
| 45 | 0.962157150432397 | 0.0756856991352067 | 0.0378428495676033 |
| 46 | 0.98980763807381 | 0.0203847238523815 | 0.0101923619261907 |
| 47 | 0.981841185798931 | 0.0363176284021378 | 0.0181588142010689 |
| 48 | 0.966486550881642 | 0.0670268982367152 | 0.0335134491183576 |
| 49 | 0.926788892600038 | 0.146422214799923 | 0.0732111073999615 |
| 50 | 0.853722411660407 | 0.292555176679185 | 0.146277588339593 |
| 51 | 0.721113072352448 | 0.557773855295105 | 0.278886927647552 |
| Meta Analysis of Goldfeld-Quandt test for Heteroskedasticity | |||
| Description | # significant tests | % significant tests | OK/NOK |
| 1% type I error level | 2 | 0.0465116279069767 | NOK |
| 5% type I error level | 23 | 0.534883720930233 | NOK |
| 10% type I error level | 28 | 0.651162790697674 | NOK |