Free Statistics

of Irreproducible Research!

Author's title

Author*The author of this computation has been verified*
R Software Modulerwasp_autocorrelation.wasp
Title produced by software(Partial) Autocorrelation Function
Date of computationFri, 10 Dec 2010 17:29:50 +0000
Cite this page as followsStatistical Computations at FreeStatistics.org, Office for Research Development and Education, URL https://freestatistics.org/blog/index.php?v=date/2010/Dec/10/t1292002092oc9akk4nroxrcgd.htm/, Retrieved Mon, 29 Apr 2024 12:50:30 +0000
Statistical Computations at FreeStatistics.org, Office for Research Development and Education, URL https://freestatistics.org/blog/index.php?pk=107852, Retrieved Mon, 29 Apr 2024 12:50:30 +0000
QR Codes:

Original text written by user:
IsPrivate?No (this computation is public)
User-defined keywords
Estimated Impact78
Family? (F = Feedback message, R = changed R code, M = changed R Module, P = changed Parameters, D = changed Data)
-     [(Partial) Autocorrelation Function] [Paper: PACF 1] [2010-12-10 17:20:31] [7d64bf19f34ddcdf2626356c9d5bd60d]
-   P   [(Partial) Autocorrelation Function] [paper ACF 2] [2010-12-10 17:26:39] [7d64bf19f34ddcdf2626356c9d5bd60d]
-   P       [(Partial) Autocorrelation Function] [ACF 3] [2010-12-10 17:29:50] [5842cf9dd57f9603e676e11284d3404a] [Current]
Feedback Forum

Post a new message
Dataseries X:
597
593
590
580
574
573
573
620
626
620
588
566
557
561
549
532
526
511
499
555
565
542
527
510
514
517
508
493
490
469
478
528
534
518
506
502
516
528
533
536
537
524
536
587
597
581
564
558
575
580
575
563
552
537
545
601
604
586
564
549


Summary of computational transaction
Raw Inputview raw input (R code)
Raw Outputview raw output of R engine
Computing time2 seconds
R Server'George Udny Yule' @ 72.249.76.132

\begin{tabular}{lllllllll}
\hline
Summary of computational transaction \tabularnewline
Raw Input & view raw input (R code)  \tabularnewline
Raw Output & view raw output of R engine  \tabularnewline
Computing time & 2 seconds \tabularnewline
R Server & 'George Udny Yule' @ 72.249.76.132 \tabularnewline
\hline
\end{tabular}
%Source: https://freestatistics.org/blog/index.php?pk=107852&T=0

[TABLE]
[ROW][C]Summary of computational transaction[/C][/ROW]
[ROW][C]Raw Input[/C][C]view raw input (R code) [/C][/ROW]
[ROW][C]Raw Output[/C][C]view raw output of R engine [/C][/ROW]
[ROW][C]Computing time[/C][C]2 seconds[/C][/ROW]
[ROW][C]R Server[/C][C]'George Udny Yule' @ 72.249.76.132[/C][/ROW]
[/TABLE]
Source: https://freestatistics.org/blog/index.php?pk=107852&T=0

Globally Unique Identifier (entire table): ba.freestatistics.org/blog/index.php?pk=107852&T=0

As an alternative you can also use a QR Code:  

The GUIDs for individual cells are displayed in the table below:

Summary of computational transaction
Raw Inputview raw input (R code)
Raw Outputview raw output of R engine
Computing time2 seconds
R Server'George Udny Yule' @ 72.249.76.132


Autocorrelation Function
Time lag kACF(k)T-STATP-value
10.215221.47550.073377
20.2582211.77030.041584
30.3375082.31380.012549
40.1862291.27670.103986
50.0498840.3420.366943
60.16871.15650.126651
70.0131920.09040.46416
80.0634230.43480.332846
9-0.05929-0.40650.343122
10-0.091693-0.62860.266322
110.0904810.62030.269026
12-0.186807-1.28070.103295
13-0.137569-0.94310.17522
14-0.0262-0.17960.429114
15-0.089258-0.61190.27177
16-0.147677-1.01240.158261
17-0.041666-0.28560.388202
18-0.181829-1.24660.109369
19-0.134388-0.92130.180794
20-0.156766-1.07470.143991
21-0.281196-1.92780.029968
22-0.166198-1.13940.130156
23-0.166446-1.14110.129806
24-0.180189-1.23530.111426

\begin{tabular}{lllllllll}
\hline
Autocorrelation Function \tabularnewline
Time lag k & ACF(k) & T-STAT & P-value \tabularnewline
1 & 0.21522 & 1.4755 & 0.073377 \tabularnewline
2 & 0.258221 & 1.7703 & 0.041584 \tabularnewline
3 & 0.337508 & 2.3138 & 0.012549 \tabularnewline
4 & 0.186229 & 1.2767 & 0.103986 \tabularnewline
5 & 0.049884 & 0.342 & 0.366943 \tabularnewline
6 & 0.1687 & 1.1565 & 0.126651 \tabularnewline
7 & 0.013192 & 0.0904 & 0.46416 \tabularnewline
8 & 0.063423 & 0.4348 & 0.332846 \tabularnewline
9 & -0.05929 & -0.4065 & 0.343122 \tabularnewline
10 & -0.091693 & -0.6286 & 0.266322 \tabularnewline
11 & 0.090481 & 0.6203 & 0.269026 \tabularnewline
12 & -0.186807 & -1.2807 & 0.103295 \tabularnewline
13 & -0.137569 & -0.9431 & 0.17522 \tabularnewline
14 & -0.0262 & -0.1796 & 0.429114 \tabularnewline
15 & -0.089258 & -0.6119 & 0.27177 \tabularnewline
16 & -0.147677 & -1.0124 & 0.158261 \tabularnewline
17 & -0.041666 & -0.2856 & 0.388202 \tabularnewline
18 & -0.181829 & -1.2466 & 0.109369 \tabularnewline
19 & -0.134388 & -0.9213 & 0.180794 \tabularnewline
20 & -0.156766 & -1.0747 & 0.143991 \tabularnewline
21 & -0.281196 & -1.9278 & 0.029968 \tabularnewline
22 & -0.166198 & -1.1394 & 0.130156 \tabularnewline
23 & -0.166446 & -1.1411 & 0.129806 \tabularnewline
24 & -0.180189 & -1.2353 & 0.111426 \tabularnewline
\hline
\end{tabular}
%Source: https://freestatistics.org/blog/index.php?pk=107852&T=1

[TABLE]
[ROW][C]Autocorrelation Function[/C][/ROW]
[ROW][C]Time lag k[/C][C]ACF(k)[/C][C]T-STAT[/C][C]P-value[/C][/ROW]
[ROW][C]1[/C][C]0.21522[/C][C]1.4755[/C][C]0.073377[/C][/ROW]
[ROW][C]2[/C][C]0.258221[/C][C]1.7703[/C][C]0.041584[/C][/ROW]
[ROW][C]3[/C][C]0.337508[/C][C]2.3138[/C][C]0.012549[/C][/ROW]
[ROW][C]4[/C][C]0.186229[/C][C]1.2767[/C][C]0.103986[/C][/ROW]
[ROW][C]5[/C][C]0.049884[/C][C]0.342[/C][C]0.366943[/C][/ROW]
[ROW][C]6[/C][C]0.1687[/C][C]1.1565[/C][C]0.126651[/C][/ROW]
[ROW][C]7[/C][C]0.013192[/C][C]0.0904[/C][C]0.46416[/C][/ROW]
[ROW][C]8[/C][C]0.063423[/C][C]0.4348[/C][C]0.332846[/C][/ROW]
[ROW][C]9[/C][C]-0.05929[/C][C]-0.4065[/C][C]0.343122[/C][/ROW]
[ROW][C]10[/C][C]-0.091693[/C][C]-0.6286[/C][C]0.266322[/C][/ROW]
[ROW][C]11[/C][C]0.090481[/C][C]0.6203[/C][C]0.269026[/C][/ROW]
[ROW][C]12[/C][C]-0.186807[/C][C]-1.2807[/C][C]0.103295[/C][/ROW]
[ROW][C]13[/C][C]-0.137569[/C][C]-0.9431[/C][C]0.17522[/C][/ROW]
[ROW][C]14[/C][C]-0.0262[/C][C]-0.1796[/C][C]0.429114[/C][/ROW]
[ROW][C]15[/C][C]-0.089258[/C][C]-0.6119[/C][C]0.27177[/C][/ROW]
[ROW][C]16[/C][C]-0.147677[/C][C]-1.0124[/C][C]0.158261[/C][/ROW]
[ROW][C]17[/C][C]-0.041666[/C][C]-0.2856[/C][C]0.388202[/C][/ROW]
[ROW][C]18[/C][C]-0.181829[/C][C]-1.2466[/C][C]0.109369[/C][/ROW]
[ROW][C]19[/C][C]-0.134388[/C][C]-0.9213[/C][C]0.180794[/C][/ROW]
[ROW][C]20[/C][C]-0.156766[/C][C]-1.0747[/C][C]0.143991[/C][/ROW]
[ROW][C]21[/C][C]-0.281196[/C][C]-1.9278[/C][C]0.029968[/C][/ROW]
[ROW][C]22[/C][C]-0.166198[/C][C]-1.1394[/C][C]0.130156[/C][/ROW]
[ROW][C]23[/C][C]-0.166446[/C][C]-1.1411[/C][C]0.129806[/C][/ROW]
[ROW][C]24[/C][C]-0.180189[/C][C]-1.2353[/C][C]0.111426[/C][/ROW]
[/TABLE]
Source: https://freestatistics.org/blog/index.php?pk=107852&T=1

Globally Unique Identifier (entire table): ba.freestatistics.org/blog/index.php?pk=107852&T=1

As an alternative you can also use a QR Code:  

The GUIDs for individual cells are displayed in the table below:

Autocorrelation Function
Time lag kACF(k)T-STATP-value
10.215221.47550.073377
20.2582211.77030.041584
30.3375082.31380.012549
40.1862291.27670.103986
50.0498840.3420.366943
60.16871.15650.126651
70.0131920.09040.46416
80.0634230.43480.332846
9-0.05929-0.40650.343122
10-0.091693-0.62860.266322
110.0904810.62030.269026
12-0.186807-1.28070.103295
13-0.137569-0.94310.17522
14-0.0262-0.17960.429114
15-0.089258-0.61190.27177
16-0.147677-1.01240.158261
17-0.041666-0.28560.388202
18-0.181829-1.24660.109369
19-0.134388-0.92130.180794
20-0.156766-1.07470.143991
21-0.281196-1.92780.029968
22-0.166198-1.13940.130156
23-0.166446-1.14110.129806
24-0.180189-1.23530.111426


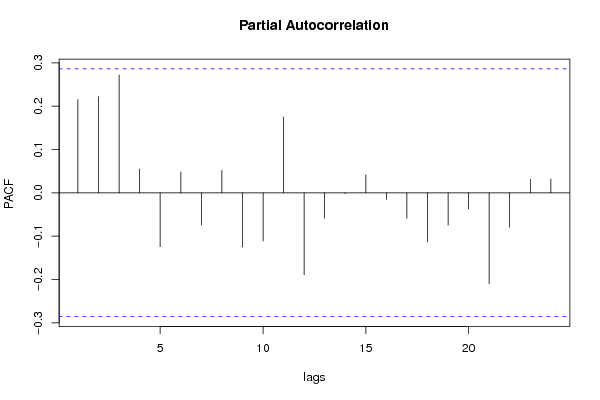
Partial Autocorrelation Function
Time lag kPACF(k)T-STATP-value
10.215221.47550.073377
20.2221931.52330.067195
30.2718541.86370.034306
40.0547710.37550.354492
5-0.124371-0.85260.19909
60.0477880.32760.372327
7-0.074487-0.51070.305991
80.0519970.35650.361541
9-0.125388-0.85960.197181
10-0.111046-0.76130.225143
110.1750971.20040.117998
12-0.189317-1.29790.100329
13-0.05852-0.40120.345048
14-0.001854-0.01270.494956
150.0415290.28470.38856
16-0.015554-0.10660.457766
17-0.058659-0.40210.344699
18-0.113369-0.77720.220462
19-0.074846-0.51310.305136
20-0.037377-0.25620.399441
21-0.209842-1.43860.078444
22-0.079661-0.54610.29378
230.0314950.21590.414992
240.0319090.21880.413893

\begin{tabular}{lllllllll}
\hline
Partial Autocorrelation Function \tabularnewline
Time lag k & PACF(k) & T-STAT & P-value \tabularnewline
1 & 0.21522 & 1.4755 & 0.073377 \tabularnewline
2 & 0.222193 & 1.5233 & 0.067195 \tabularnewline
3 & 0.271854 & 1.8637 & 0.034306 \tabularnewline
4 & 0.054771 & 0.3755 & 0.354492 \tabularnewline
5 & -0.124371 & -0.8526 & 0.19909 \tabularnewline
6 & 0.047788 & 0.3276 & 0.372327 \tabularnewline
7 & -0.074487 & -0.5107 & 0.305991 \tabularnewline
8 & 0.051997 & 0.3565 & 0.361541 \tabularnewline
9 & -0.125388 & -0.8596 & 0.197181 \tabularnewline
10 & -0.111046 & -0.7613 & 0.225143 \tabularnewline
11 & 0.175097 & 1.2004 & 0.117998 \tabularnewline
12 & -0.189317 & -1.2979 & 0.100329 \tabularnewline
13 & -0.05852 & -0.4012 & 0.345048 \tabularnewline
14 & -0.001854 & -0.0127 & 0.494956 \tabularnewline
15 & 0.041529 & 0.2847 & 0.38856 \tabularnewline
16 & -0.015554 & -0.1066 & 0.457766 \tabularnewline
17 & -0.058659 & -0.4021 & 0.344699 \tabularnewline
18 & -0.113369 & -0.7772 & 0.220462 \tabularnewline
19 & -0.074846 & -0.5131 & 0.305136 \tabularnewline
20 & -0.037377 & -0.2562 & 0.399441 \tabularnewline
21 & -0.209842 & -1.4386 & 0.078444 \tabularnewline
22 & -0.079661 & -0.5461 & 0.29378 \tabularnewline
23 & 0.031495 & 0.2159 & 0.414992 \tabularnewline
24 & 0.031909 & 0.2188 & 0.413893 \tabularnewline
\hline
\end{tabular}
%Source: https://freestatistics.org/blog/index.php?pk=107852&T=2

[TABLE]
[ROW][C]Partial Autocorrelation Function[/C][/ROW]
[ROW][C]Time lag k[/C][C]PACF(k)[/C][C]T-STAT[/C][C]P-value[/C][/ROW]
[ROW][C]1[/C][C]0.21522[/C][C]1.4755[/C][C]0.073377[/C][/ROW]
[ROW][C]2[/C][C]0.222193[/C][C]1.5233[/C][C]0.067195[/C][/ROW]
[ROW][C]3[/C][C]0.271854[/C][C]1.8637[/C][C]0.034306[/C][/ROW]
[ROW][C]4[/C][C]0.054771[/C][C]0.3755[/C][C]0.354492[/C][/ROW]
[ROW][C]5[/C][C]-0.124371[/C][C]-0.8526[/C][C]0.19909[/C][/ROW]
[ROW][C]6[/C][C]0.047788[/C][C]0.3276[/C][C]0.372327[/C][/ROW]
[ROW][C]7[/C][C]-0.074487[/C][C]-0.5107[/C][C]0.305991[/C][/ROW]
[ROW][C]8[/C][C]0.051997[/C][C]0.3565[/C][C]0.361541[/C][/ROW]
[ROW][C]9[/C][C]-0.125388[/C][C]-0.8596[/C][C]0.197181[/C][/ROW]
[ROW][C]10[/C][C]-0.111046[/C][C]-0.7613[/C][C]0.225143[/C][/ROW]
[ROW][C]11[/C][C]0.175097[/C][C]1.2004[/C][C]0.117998[/C][/ROW]
[ROW][C]12[/C][C]-0.189317[/C][C]-1.2979[/C][C]0.100329[/C][/ROW]
[ROW][C]13[/C][C]-0.05852[/C][C]-0.4012[/C][C]0.345048[/C][/ROW]
[ROW][C]14[/C][C]-0.001854[/C][C]-0.0127[/C][C]0.494956[/C][/ROW]
[ROW][C]15[/C][C]0.041529[/C][C]0.2847[/C][C]0.38856[/C][/ROW]
[ROW][C]16[/C][C]-0.015554[/C][C]-0.1066[/C][C]0.457766[/C][/ROW]
[ROW][C]17[/C][C]-0.058659[/C][C]-0.4021[/C][C]0.344699[/C][/ROW]
[ROW][C]18[/C][C]-0.113369[/C][C]-0.7772[/C][C]0.220462[/C][/ROW]
[ROW][C]19[/C][C]-0.074846[/C][C]-0.5131[/C][C]0.305136[/C][/ROW]
[ROW][C]20[/C][C]-0.037377[/C][C]-0.2562[/C][C]0.399441[/C][/ROW]
[ROW][C]21[/C][C]-0.209842[/C][C]-1.4386[/C][C]0.078444[/C][/ROW]
[ROW][C]22[/C][C]-0.079661[/C][C]-0.5461[/C][C]0.29378[/C][/ROW]
[ROW][C]23[/C][C]0.031495[/C][C]0.2159[/C][C]0.414992[/C][/ROW]
[ROW][C]24[/C][C]0.031909[/C][C]0.2188[/C][C]0.413893[/C][/ROW]
[/TABLE]
Source: https://freestatistics.org/blog/index.php?pk=107852&T=2

Globally Unique Identifier (entire table): ba.freestatistics.org/blog/index.php?pk=107852&T=2

As an alternative you can also use a QR Code:  

The GUIDs for individual cells are displayed in the table below:

Partial Autocorrelation Function
Time lag kPACF(k)T-STATP-value
10.215221.47550.073377
20.2221931.52330.067195
30.2718541.86370.034306
40.0547710.37550.354492
5-0.124371-0.85260.19909
60.0477880.32760.372327
7-0.074487-0.51070.305991
80.0519970.35650.361541
9-0.125388-0.85960.197181
10-0.111046-0.76130.225143
110.1750971.20040.117998
12-0.189317-1.29790.100329
13-0.05852-0.40120.345048
14-0.001854-0.01270.494956
150.0415290.28470.38856
16-0.015554-0.10660.457766
17-0.058659-0.40210.344699
18-0.113369-0.77720.220462
19-0.074846-0.51310.305136
20-0.037377-0.25620.399441
21-0.209842-1.43860.078444
22-0.079661-0.54610.29378
230.0314950.21590.414992
240.0319090.21880.413893


Parameters (Session):
par1 = 24 ; par2 = 1 ; par3 = 1 ; par4 = 1 ; par5 = 12 ; par6 = White Noise ; par7 = 0.95 ;
Parameters (R input):
par1 = 24 ; par2 = 1 ; par3 = 1 ; par4 = 1 ; par5 = 12 ; par6 = White Noise ; par7 = 0.95 ;
R code (references can be found in the software module):
if (par1 == 'Default') {
par1 = 10*log10(length(x))
} else {
par1 <- as.numeric(par1)
}
par2 <- as.numeric(par2)
par3 <- as.numeric(par3)
par4 <- as.numeric(par4)
par5 <- as.numeric(par5)
if (par6 == 'White Noise') par6 <- 'white' else par6 <- 'ma'
par7 <- as.numeric(par7)
if (par2 == 0) {
x <- log(x)
} else {
x <- (x ^ par2 - 1) / par2
}
if (par3 > 0) x <- diff(x,lag=1,difference=par3)
if (par4 > 0) x <- diff(x,lag=par5,difference=par4)
bitmap(file='pic1.png')
racf <- acf(x, par1, main='Autocorrelation', xlab='time lag', ylab='ACF', ci.type=par6, ci=par7, sub=paste('(lambda=',par2,', d=',par3,', D=',par4,', CI=', par7, ', CI type=',par6,')',sep=''))
dev.off()
bitmap(file='pic2.png')
rpacf <- pacf(x,par1,main='Partial Autocorrelation',xlab='lags',ylab='PACF')
dev.off()
(myacf <- c(racf$acf))
(mypacf <- c(rpacf$acf))
lengthx <- length(x)
sqrtn <- sqrt(lengthx)
load(file='createtable')
a<-table.start()
a<-table.row.start(a)
a<-table.element(a,'Autocorrelation Function',4,TRUE)
a<-table.row.end(a)
a<-table.row.start(a)
a<-table.element(a,'Time lag k',header=TRUE)
a<-table.element(a,hyperlink('basics.htm','ACF(k)','click here for more information about the Autocorrelation Function'),header=TRUE)
a<-table.element(a,'T-STAT',header=TRUE)
a<-table.element(a,'P-value',header=TRUE)
a<-table.row.end(a)
for (i in 2:(par1+1)) {
a<-table.row.start(a)
a<-table.element(a,i-1,header=TRUE)
a<-table.element(a,round(myacf[i],6))
mytstat <- myacf[i]*sqrtn
a<-table.element(a,round(mytstat,4))
a<-table.element(a,round(1-pt(abs(mytstat),lengthx),6))
a<-table.row.end(a)
}
a<-table.end(a)
table.save(a,file='mytable.tab')
a<-table.start()
a<-table.row.start(a)
a<-table.element(a,'Partial Autocorrelation Function',4,TRUE)
a<-table.row.end(a)
a<-table.row.start(a)
a<-table.element(a,'Time lag k',header=TRUE)
a<-table.element(a,hyperlink('basics.htm','PACF(k)','click here for more information about the Partial Autocorrelation Function'),header=TRUE)
a<-table.element(a,'T-STAT',header=TRUE)
a<-table.element(a,'P-value',header=TRUE)
a<-table.row.end(a)
for (i in 1:par1) {
a<-table.row.start(a)
a<-table.element(a,i,header=TRUE)
a<-table.element(a,round(mypacf[i],6))
mytstat <- mypacf[i]*sqrtn
a<-table.element(a,round(mytstat,4))
a<-table.element(a,round(1-pt(abs(mytstat),lengthx),6))
a<-table.row.end(a)
}
a<-table.end(a)
table.save(a,file='mytable1.tab')