| Multiple Linear Regression - Estimated Regression Equation |
| PS[t] = + 1.15645851462407 + 0.0122857935458461SWS[t] -0.0300141770836811L[t] + 0.123581304657108Wb[t] -0.0371442998271288Wbr[t] -0.397864863256566Tg[t] + 0.0703055296820856P[t] + 0.0500052380746250S[t] -0.226348203385221D[t] + e[t] |
| Multiple Linear Regression - Ordinary Least Squares | |||||
| Variable | Parameter | S.D. | T-STAT H0: parameter = 0 | 2-tail p-value | 1-tail p-value |
| (Intercept) | 1.15645851462407 | 0.232367 | 4.9769 | 2.5e-05 | 1.2e-05 |
| SWS | 0.0122857935458461 | 0.011712 | 1.049 | 0.302561 | 0.15128 |
| L | -0.0300141770836811 | 0.12322 | -0.2436 | 0.809212 | 0.404606 |
| Wb | 0.123581304657108 | 0.067913 | 1.8197 | 0.078797 | 0.039399 |
| Wbr | -0.0371442998271288 | 0.09297 | -0.3995 | 0.692333 | 0.346166 |
| Tg | -0.397864863256566 | 0.103909 | -3.829 | 0.00061 | 0.000305 |
| P | 0.0703055296820856 | 0.066776 | 1.0529 | 0.300815 | 0.150408 |
| S | 0.0500052380746250 | 0.040704 | 1.2285 | 0.228802 | 0.114401 |
| D | -0.226348203385221 | 0.082042 | -2.7589 | 0.009786 | 0.004893 |
| Multiple Linear Regression - Regression Statistics | |
| Multiple R | 0.871289104188098 |
| R-squared | 0.759144703076899 |
| Adjusted R-squared | 0.694916623897405 |
| F-TEST (value) | 11.8195143428682 |
| F-TEST (DF numerator) | 8 |
| F-TEST (DF denominator) | 30 |
| p-value | 2.01849824188471e-07 |
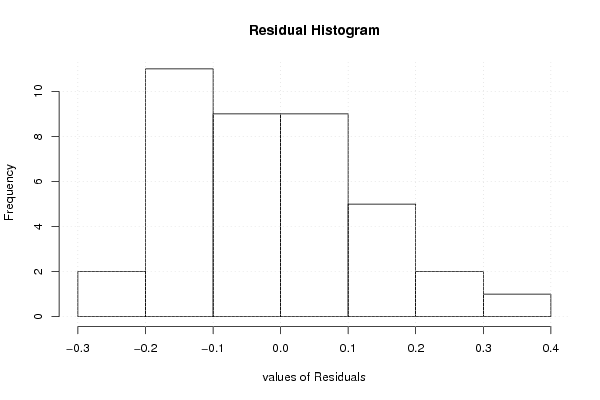
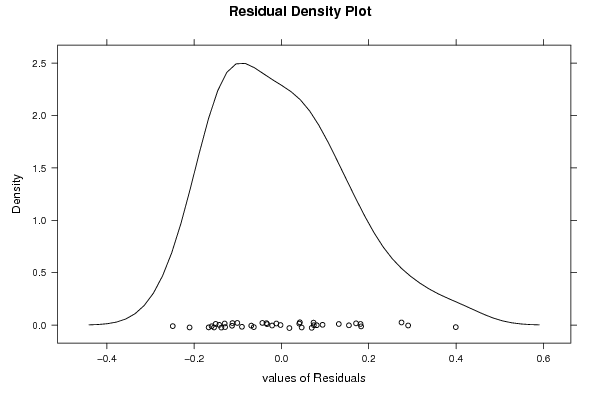
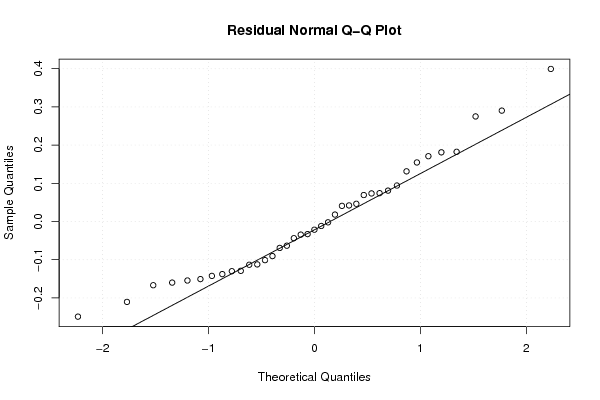
| Multiple Linear Regression - Residual Statistics | |
| Residual Standard Deviation | 0.166277661548531 |
| Sum Squared Residuals | 0.82944782190144 |
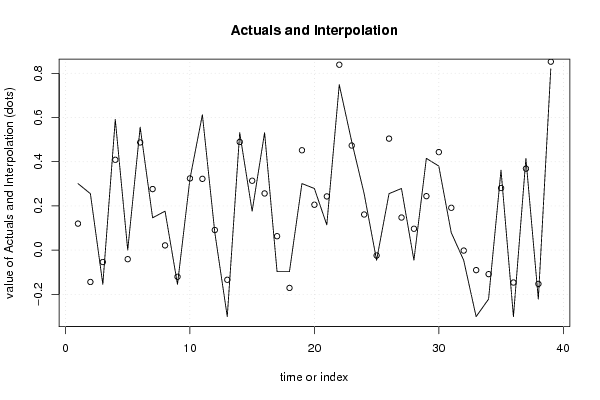
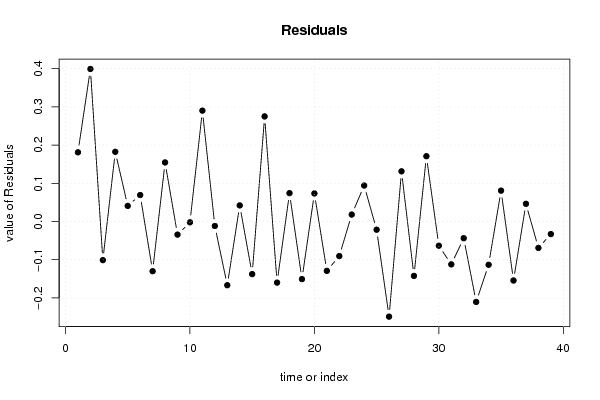
| Multiple Linear Regression - Actuals, Interpolation, and Residuals | |||
| Time or Index | Actuals | Interpolation Forecast | Residuals Prediction Error |
| 1 | 0.301029996 | 0.119855352382196 | 0.181174643617804 |
| 2 | 0.255272505 | -0.144137473349522 | 0.399409978349522 |
| 3 | -0.15490196 | -0.0538181140364022 | -0.101083845963598 |
| 4 | 0.591064607 | 0.408574084048084 | 0.182490522951916 |
| 5 | 0 | -0.0409589216577015 | 0.0409589216577015 |
| 6 | 0.556302501 | 0.486966018762716 | 0.0693364822372839 |
| 7 | 0.146128036 | 0.276122101580857 | -0.129994065580857 |
| 8 | 0.176091259 | 0.0214111866749937 | 0.154680072325006 |
| 9 | -0.15490196 | -0.120594398861160 | -0.0343075611388395 |
| 10 | 0.322219295 | 0.324305773760966 | -0.00208647876096617 |
| 11 | 0.612783857 | 0.322477484492103 | 0.290306372507897 |
| 12 | 0.079181246 | 0.0908704365317088 | -0.0116891905317088 |
| 13 | -0.301029996 | -0.134291869693588 | -0.166738126306412 |
| 14 | 0.531478917 | 0.489315513531092 | 0.0421634034689079 |
| 15 | 0.176091259 | 0.313752894119091 | -0.137661635119091 |
| 16 | 0.531478917 | 0.256360506593173 | 0.275118410406827 |
| 17 | -0.096910013 | 0.0629675051336751 | -0.159877518133675 |
| 18 | -0.096910013 | -0.171156103773061 | 0.0742460907730612 |
| 19 | 0.301029996 | 0.451732202679979 | -0.150702206679979 |
| 20 | 0.278753601 | 0.205211496020017 | 0.0735421049799832 |
| 21 | 0.113943352 | 0.243017280342579 | -0.129073928342579 |
| 22 | 0.748188027 | 0.838656006320343 | -0.0904679793203433 |
| 23 | 0.491361694 | 0.473129471517794 | 0.0182322224822059 |
| 24 | 0.255272505 | 0.161107975692337 | 0.0941645293076634 |
| 25 | -0.045757491 | -0.0243914682964879 | -0.0213660227035121 |
| 26 | 0.255272505 | 0.504286947065726 | -0.249014442065726 |
| 27 | 0.278753601 | 0.147320816850077 | 0.131432784149923 |
| 28 | -0.045757491 | 0.096591617803765 | -0.142349108803765 |
| 29 | 0.414973348 | 0.244004255152472 | 0.170969092847528 |
| 30 | 0.380211242 | 0.443468312121362 | -0.0632570701213618 |
| 31 | 0.079181246 | 0.191380164444305 | -0.112198918444305 |
| 32 | -0.045757491 | -0.00211655031076928 | -0.0436409406892307 |
| 33 | -0.301029996 | -0.0905723665780947 | -0.210457629421905 |
| 34 | -0.22184875 | -0.108686441632607 | -0.113162308367393 |
| 35 | 0.361727836 | 0.280859634606285 | 0.0808682013937153 |
| 36 | -0.301029996 | -0.146636479279582 | -0.154393516720418 |
| 37 | 0.414973348 | 0.368560885499569 | 0.0464124625004313 |
| 38 | -0.22184875 | -0.152760524702377 | -0.0690882252976226 |
| 39 | 0.819543936 | 0.85243951344409 | -0.0328955774440897 |
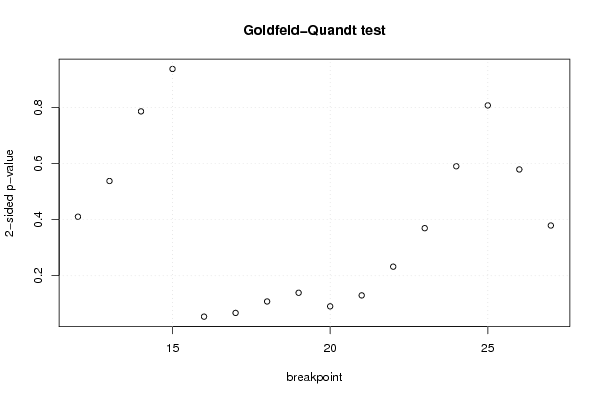
| Goldfeld-Quandt test for Heteroskedasticity | |||
| p-values | Alternative Hypothesis | ||
| breakpoint index | greater | 2-sided | less |
| 12 | 0.794814761966986 | 0.410370476066029 | 0.205185238033014 |
| 13 | 0.73113047623253 | 0.537739047534941 | 0.268869523767470 |
| 14 | 0.606916405966179 | 0.786167188067641 | 0.393083594033821 |
| 15 | 0.468723500996101 | 0.937447001992202 | 0.531276499003899 |
| 16 | 0.972995053274966 | 0.0540098934500684 | 0.0270049467250342 |
| 17 | 0.96632990626222 | 0.0673401874755584 | 0.0336700937377792 |
| 18 | 0.945916965442833 | 0.108166069114335 | 0.0540830345571674 |
| 19 | 0.930390727311796 | 0.139218545376408 | 0.069609272688204 |
| 20 | 0.954628720312776 | 0.0907425593744486 | 0.0453712796872243 |
| 21 | 0.93508802365648 | 0.129823952687039 | 0.0649119763435194 |
| 22 | 0.883876902739222 | 0.232246194521556 | 0.116123097260778 |
| 23 | 0.815227449614288 | 0.369545100771424 | 0.184772550385712 |
| 24 | 0.704831623816241 | 0.590336752367519 | 0.295168376183759 |
| 25 | 0.5962130916474 | 0.807573816705201 | 0.403786908352601 |
| 26 | 0.710466667179001 | 0.579066665641997 | 0.289533332820999 |
| 27 | 0.810466455242563 | 0.379067089514874 | 0.189533544757437 |
| Meta Analysis of Goldfeld-Quandt test for Heteroskedasticity | |||
| Description | # significant tests | % significant tests | OK/NOK |
| 1% type I error level | 0 | 0 | OK |
| 5% type I error level | 0 | 0 | OK |
| 10% type I error level | 3 | 0.1875 | NOK |