| Tabulation of Results | ||
| survived x sex | ||
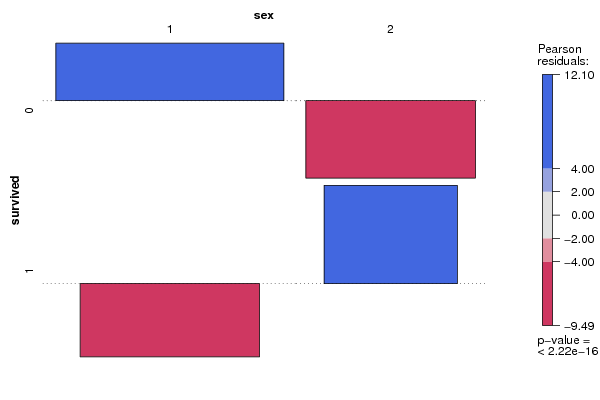
| 1 | 2 | 0 | 682 | 127 | 1 | 161 | 339 |
| Tabulation of Expected Results | ||
| survived x sex | ||
| 1 | 2 | 0 | 521 | 288 | 1 | 322 | 178 |
| Statistical Results | |
| Pearson's Chi-squared test with Yates' continuity correction | |
| Chi Square Statistic | 363.62 |
| Degrees of Freedom | 1 |
| P value | 0 |