| Multiple Linear Regression - Estimated Regression Equation |
| Ps[t] = + 1.07274433605810 -0.110578929700191Tg[t] -0.302554222394359D[t] + e[t] |
| Multiple Linear Regression - Ordinary Least Squares | |||||
| Variable | Parameter | S.D. | T-STAT H0: parameter = 0 | 2-tail p-value | 1-tail p-value |
| (Intercept) | 1.07274433605810 | 0.128809 | 8.3282 | 0 | 0 |
| Tg | -0.110578929700191 | 0.022221 | -4.9763 | 1.6e-05 | 8e-06 |
| D | -0.302554222394359 | 0.068938 | -4.3888 | 9.6e-05 | 4.8e-05 |
| Multiple Linear Regression - Regression Statistics | |
| Multiple R | 0.808529061454828 |
| R-squared | 0.653719243217025 |
| Adjusted R-squared | 0.634481423395748 |
| F-TEST (value) | 33.9809421904468 |
| F-TEST (DF numerator) | 2 |
| F-TEST (DF denominator) | 36 |
| p-value | 5.12519560125213e-09 |
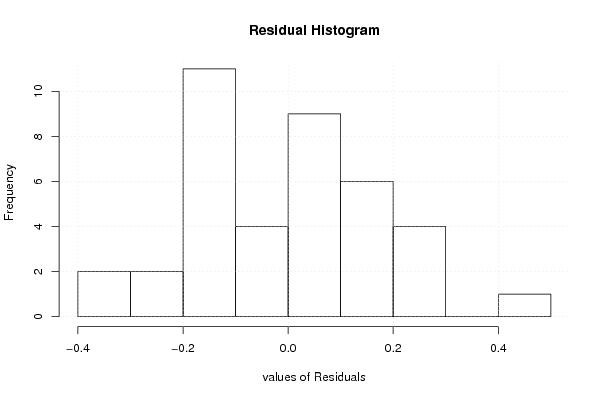
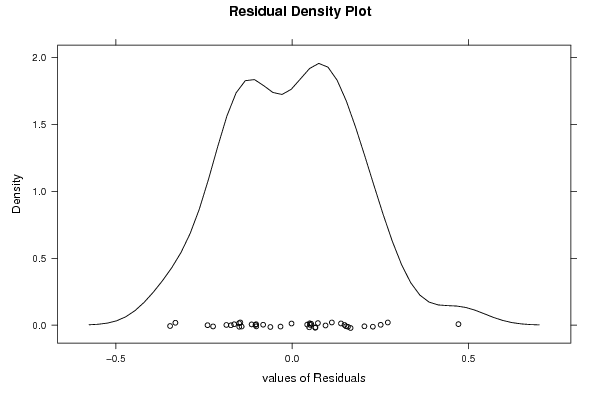
| Multiple Linear Regression - Residual Statistics | |
| Residual Standard Deviation | 0.182001904358655 |
| Sum Squared Residuals | 1.19248895484637 |
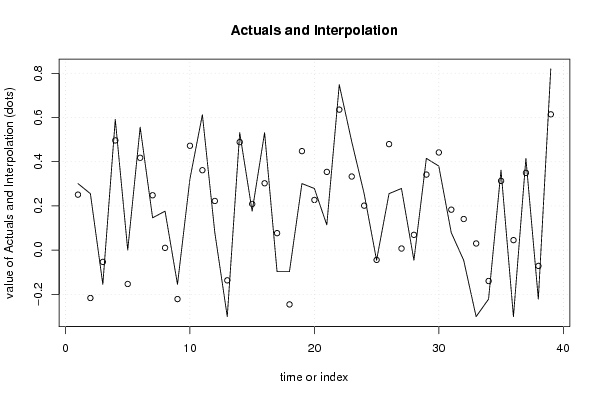
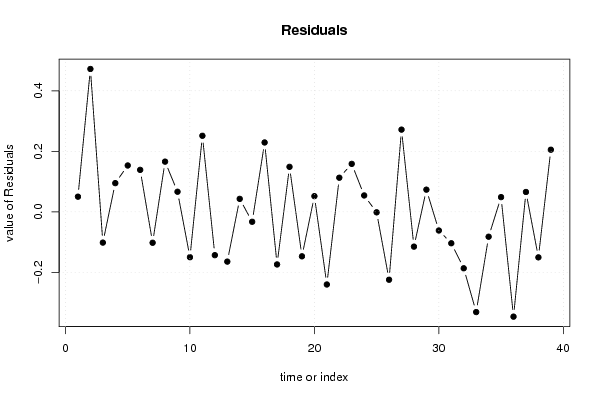
| Multiple Linear Regression - Actuals, Interpolation, and Residuals | |||
| Time or Index | Actuals | Interpolation Forecast | Residuals Prediction Error |
| 1 | 0.301 | 0.250869706678664 | 0.0501302933213361 |
| 2 | 0.2553 | -0.216723205446872 | 0.472023205446872 |
| 3 | -0.1549 | -0.0533439253539173 | -0.101556074646083 |
| 4 | 0.5911 | 0.496231903870593 | 0.094868096129407 |
| 5 | 0 | -0.153186818744056 | 0.153186818744056 |
| 6 | 0.5563 | 0.417567806048060 | 0.138732193951940 |
| 7 | 0.1461 | 0.248137441507218 | -0.102037441507218 |
| 8 | 0.1761 | 0.0101924613488980 | 0.165907538651102 |
| 9 | -0.1549 | -0.221408157309037 | 0.0665081573090365 |
| 10 | 0.3222 | 0.472027566079044 | -0.149827566079044 |
| 11 | 0.6128 | 0.361448636378854 | 0.251351363621146 |
| 12 | 0.0792 | 0.222273694077448 | -0.143073694077448 |
| 13 | -0.301 | -0.136692975038616 | -0.164307024961384 |
| 14 | 0.5315 | 0.488521409784485 | 0.0429785902155154 |
| 15 | 0.1761 | 0.208805392595952 | -0.0327053925959517 |
| 16 | 0.5315 | 0.302303924485704 | 0.229196075514296 |
| 17 | -0.0969 | 0.076754390275657 | -0.173654390275657 |
| 18 | -0.0969 | -0.245612495100585 | 0.148712495100585 |
| 19 | 0.301 | 0.447823228287496 | -0.146823228287496 |
| 20 | 0.2788 | 0.226958645939613 | 0.0518413540603867 |
| 21 | 0.1139 | 0.353738142292745 | -0.239838142292745 |
| 22 | 0.7482 | 0.635406846171998 | 0.112793153828002 |
| 23 | 0.4914 | 0.332852623777639 | 0.158547376222361 |
| 24 | 0.2553 | 0.201094898509843 | 0.0542051014901568 |
| 25 | -0.0458 | -0.0442672986820868 | -0.00153270131791320 |
| 26 | 0.2553 | 0.479444783112654 | -0.224144783112654 |
| 27 | 0.2788 | 0.00716691912495432 | 0.271633080875046 |
| 28 | -0.0458 | 0.0690438961895484 | -0.114843896189548 |
| 29 | 0.415 | 0.341635973396971 | 0.0733640266030292 |
| 30 | 0.3802 | 0.441772143839608 | -0.0615721438396084 |
| 31 | 0.0792 | 0.182941645166182 | -0.103741645166182 |
| 32 | -0.0458 | 0.140584054030971 | -0.186384054030971 |
| 33 | -0.301 | 0.0300051243307808 | -0.331005124330781 |
| 34 | -0.2218 | -0.139718517262560 | -0.0820814827374405 |
| 35 | 0.3617 | 0.313039960795756 | 0.0486600392042439 |
| 36 | -0.301 | 0.0451328354504988 | -0.346132835450499 |
| 37 | 0.415 | 0.349346467483079 | 0.0656535325169207 |
| 38 | -0.2218 | -0.0714971786975791 | -0.150302821302421 |
| 39 | 0.8195 | 0.614228050604393 | 0.205271949395607 |
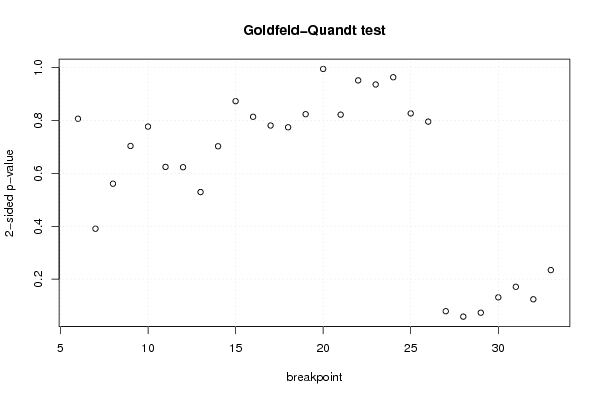
| Goldfeld-Quandt test for Heteroskedasticity | |||
| p-values | Alternative Hypothesis | ||
| breakpoint index | greater | 2-sided | less |
| 6 | 0.596749757550852 | 0.806500484898296 | 0.403250242449148 |
| 7 | 0.804672018831552 | 0.390655962336896 | 0.195327981168448 |
| 8 | 0.719558803663735 | 0.56088239267253 | 0.280441196336265 |
| 9 | 0.648210701076627 | 0.703578597846746 | 0.351789298923373 |
| 10 | 0.611565736223306 | 0.776868527553387 | 0.388434263776694 |
| 11 | 0.68782043381077 | 0.624359132378461 | 0.312179566189230 |
| 12 | 0.688380819399243 | 0.623238361201513 | 0.311619180600757 |
| 13 | 0.735346533532263 | 0.529306932935474 | 0.264653466467737 |
| 14 | 0.64879725533016 | 0.70240548933968 | 0.35120274466984 |
| 15 | 0.563545127846001 | 0.872909744307998 | 0.436454872153999 |
| 16 | 0.593028694363946 | 0.813942611272108 | 0.406971305636054 |
| 17 | 0.609547369760737 | 0.780905260478527 | 0.390452630239263 |
| 18 | 0.612938577698033 | 0.774122844603934 | 0.387061422301967 |
| 19 | 0.588162637078351 | 0.823674725843298 | 0.411837362921649 |
| 20 | 0.502624108297542 | 0.994751783404916 | 0.497375891702458 |
| 21 | 0.589028044494935 | 0.82194391101013 | 0.410971955505065 |
| 22 | 0.52424075836141 | 0.95151848327718 | 0.47575924163859 |
| 23 | 0.532011397186749 | 0.935977205626503 | 0.467988602813251 |
| 24 | 0.481692071304884 | 0.963384142609768 | 0.518307928695116 |
| 25 | 0.413340572525087 | 0.826681145050174 | 0.586659427474913 |
| 26 | 0.60217388991294 | 0.79565222017412 | 0.39782611008706 |
| 27 | 0.960575424322138 | 0.0788491513557233 | 0.0394245756778617 |
| 28 | 0.970879293646457 | 0.0582414127070854 | 0.0291207063535427 |
| 29 | 0.96341932362956 | 0.07316135274088 | 0.03658067637044 |
| 30 | 0.934351281829423 | 0.131297436341154 | 0.0656487181705771 |
| 31 | 0.914451778794657 | 0.171096442410687 | 0.0855482212053435 |
| 32 | 0.93803952043186 | 0.123920959136279 | 0.0619604795681396 |
| 33 | 0.882825154227492 | 0.234349691545016 | 0.117174845772508 |
| Meta Analysis of Goldfeld-Quandt test for Heteroskedasticity | |||
| Description | # significant tests | % significant tests | OK/NOK |
| 1% type I error level | 0 | 0 | OK |
| 5% type I error level | 0 | 0 | OK |
| 10% type I error level | 3 | 0.107142857142857 | NOK |