| Multiple Linear Regression - Estimated Regression Equation |
| SWS[t] = + 11.699094269484 -1.81486955289802Wb[t] -0.806211768968584D[t] + e[t] |
| Multiple Linear Regression - Ordinary Least Squares | |||||
| Variable | Parameter | S.D. | T-STAT H0: parameter = 0 | 2-tail p-value | 1-tail p-value |
| (Intercept) | 11.699094269484 | 0.941091 | 12.4314 | 0 | 0 |
| Wb | -1.81486955289802 | 0.372947 | -4.8663 | 2.3e-05 | 1.1e-05 |
| D | -0.806211768968584 | 0.336954 | -2.3926 | 0.022069 | 0.011034 |
| Multiple Linear Regression - Regression Statistics | |
| Multiple R | 0.757707161337637 |
| R-squared | 0.574120142342339 |
| Adjusted R-squared | 0.550460150250247 |
| F-TEST (value) | 24.2654410072362 |
| F-TEST (DF numerator) | 2 |
| F-TEST (DF denominator) | 36 |
| p-value | 2.12406500721407e-07 |
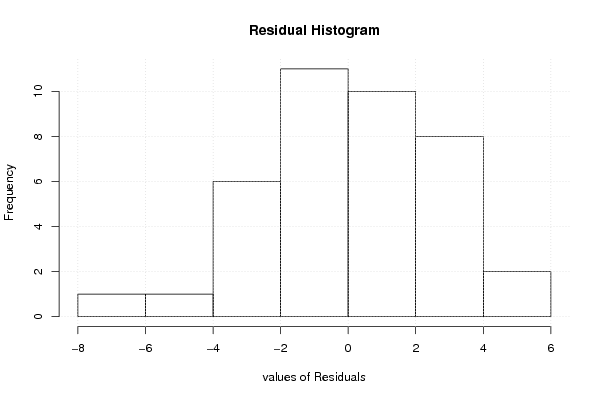
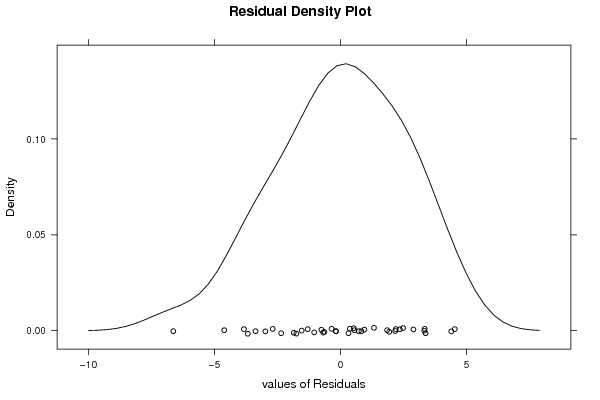
| Multiple Linear Regression - Residual Statistics | |
| Residual Standard Deviation | 2.66066008738555 |
| Sum Squared Residuals | 254.848035621833 |
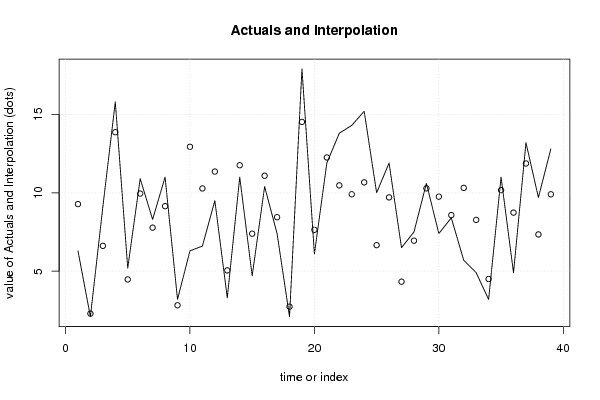
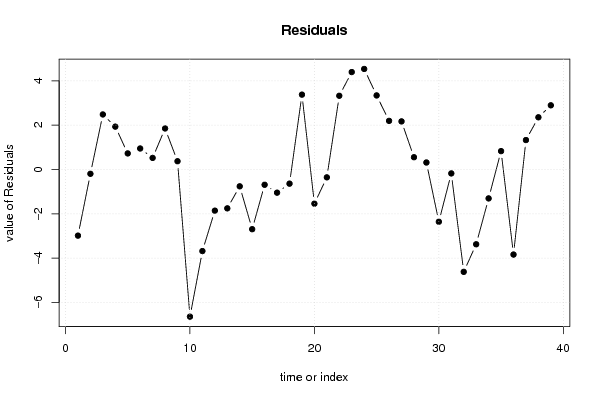
| Multiple Linear Regression - Actuals, Interpolation, and Residuals | |||
| Time or Index | Actuals | Interpolation Forecast | Residuals Prediction Error |
| 1 | 6.3 | 9.28045896257822 | -2.98045896257822 |
| 2 | 2.1 | 2.29280149643898 | -0.19280149643898 |
| 3 | 9.1 | 6.61709118012909 | 2.48290881987091 |
| 4 | 15.8 | 13.8661832890282 | 1.93381671097179 |
| 5 | 5.2 | 4.47409321206711 | 0.725906787932891 |
| 6 | 10.9 | 9.95187263733776 | 0.948127362662239 |
| 7 | 8.3 | 7.77620701732362 | 0.523792982676385 |
| 8 | 11 | 9.14865271946654 | 1.85134728053346 |
| 9 | 3.2 | 2.82687089228558 | 0.373129107714418 |
| 10 | 6.3 | 12.9344292605704 | -6.63442926057037 |
| 11 | 6.6 | 10.2774135215564 | -3.67741352155638 |
| 12 | 9.5 | 11.3552645490225 | -1.85526454902252 |
| 13 | 3.3 | 5.0511750163174 | -1.7511750163174 |
| 14 | 11 | 11.7578026158553 | -0.757802615855298 |
| 15 | 4.7 | 7.39127318515395 | -2.69127318515395 |
| 16 | 10.4 | 11.0875245763988 | -0.687524576398776 |
| 17 | 7.4 | 8.44339441121037 | -1.04339441121037 |
| 18 | 2.1 | 2.73739782332771 | -0.63739782332771 |
| 19 | 17.9 | 14.5226216063114 | 3.37737839368858 |
| 20 | 6.1 | 7.63991031390097 | -1.53991031390097 |
| 21 | 11.9 | 12.253759751091 | -0.353759751091043 |
| 22 | 13.8 | 10.4747365555277 | 3.32526344447232 |
| 23 | 14.3 | 9.90541197678357 | 4.39458802321643 |
| 24 | 15.2 | 10.6652511450107 | 4.53474885498931 |
| 25 | 10 | 6.65937764071161 | 3.34062235928839 |
| 26 | 11.9 | 9.70645556021467 | 2.19354443978533 |
| 27 | 6.5 | 4.33035554347759 | 2.16964445652241 |
| 28 | 7.5 | 6.94589882954293 | 0.554101170457072 |
| 29 | 10.6 | 10.2837188514202 | 0.316281148579757 |
| 30 | 7.4 | 9.75514077780362 | -2.35514077780362 |
| 31 | 8.4 | 8.5757918287592 | -0.175791828759199 |
| 32 | 5.7 | 10.3133479387038 | -4.61334793870376 |
| 33 | 4.9 | 8.27084703030105 | -3.37084703030105 |
| 34 | 3.2 | 4.50235846352103 | -1.30235846352103 |
| 35 | 11 | 10.1697917570695 | 0.83020824293047 |
| 36 | 4.9 | 8.73418322715591 | -3.83418322715591 |
| 37 | 13.2 | 11.8706875020456 | 1.32931249795445 |
| 38 | 9.7 | 7.34503535779649 | 2.35496464220351 |
| 39 | 12.8 | 9.90541197678357 | 2.89458802321643 |
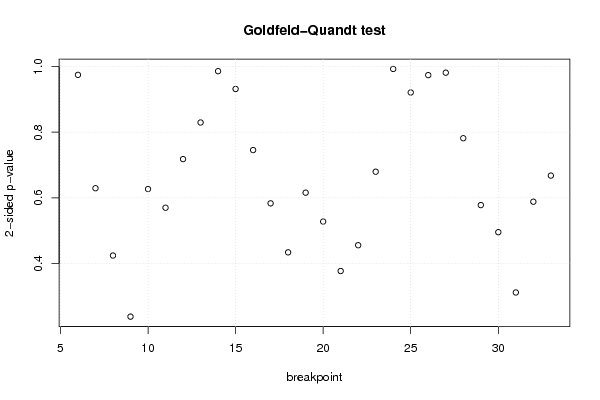
| Goldfeld-Quandt test for Heteroskedasticity | |||
| p-values | Alternative Hypothesis | ||
| breakpoint index | greater | 2-sided | less |
| 6 | 0.487429057202368 | 0.974858114404736 | 0.512570942797632 |
| 7 | 0.31453297416004 | 0.62906594832008 | 0.68546702583996 |
| 8 | 0.2118603191587 | 0.4237206383174 | 0.7881396808413 |
| 9 | 0.118649807188259 | 0.237299614376518 | 0.88135019281174 |
| 10 | 0.686696570860431 | 0.626606858279137 | 0.313303429139569 |
| 11 | 0.715217547413543 | 0.569564905172915 | 0.284782452586457 |
| 12 | 0.641023995768211 | 0.717952008463578 | 0.358976004231789 |
| 13 | 0.585203496349866 | 0.829593007300269 | 0.414796503650134 |
| 14 | 0.493105559069994 | 0.986211118139989 | 0.506894440930006 |
| 15 | 0.465950104431763 | 0.931900208863527 | 0.534049895568237 |
| 16 | 0.372755101170773 | 0.745510202341545 | 0.627244898829227 |
| 17 | 0.291490276760177 | 0.582980553520354 | 0.708509723239823 |
| 18 | 0.216743881106785 | 0.43348776221357 | 0.783256118893215 |
| 19 | 0.307738297825623 | 0.615476595651245 | 0.692261702174377 |
| 20 | 0.263693946599421 | 0.527387893198841 | 0.73630605340058 |
| 21 | 0.188259669693342 | 0.376519339386684 | 0.811740330306658 |
| 22 | 0.227586268616311 | 0.455172537232622 | 0.772413731383689 |
| 23 | 0.339697907697355 | 0.67939581539471 | 0.660302092302645 |
| 24 | 0.503525822870162 | 0.992948354259677 | 0.496474177129838 |
| 25 | 0.539433082575117 | 0.921133834849767 | 0.460566917424883 |
| 26 | 0.5129432974192 | 0.9741134051616 | 0.4870567025808 |
| 27 | 0.490766750298985 | 0.98153350059797 | 0.509233249701015 |
| 28 | 0.390812934431877 | 0.781625868863754 | 0.609187065568123 |
| 29 | 0.288809026094183 | 0.577618052188367 | 0.711190973905817 |
| 30 | 0.247478410156628 | 0.494956820313257 | 0.752521589843371 |
| 31 | 0.155510585227722 | 0.311021170455443 | 0.844489414772278 |
| 32 | 0.293977923831091 | 0.587955847662181 | 0.70602207616891 |
| 33 | 0.333806871678779 | 0.667613743357558 | 0.666193128321221 |
| Meta Analysis of Goldfeld-Quandt test for Heteroskedasticity | |||
| Description | # significant tests | % significant tests | OK/NOK |
| 1% type I error level | 0 | 0 | OK |
| 5% type I error level | 0 | 0 | OK |
| 10% type I error level | 0 | 0 | OK |