| Multiple Linear Regression - Estimated Regression Equation |
| Schouwburgabonnement[t] = -111.154156194121 -0.138834616969009Bioscoop[t] -0.666006206665054Eendagsattracties[t] + 0.965145274240743DVDhuren[t] + 1.94875805403434Vrijetijdsbesteding[t] + e[t] |
| Multiple Linear Regression - Ordinary Least Squares | |||||
| Variable | Parameter | S.D. | T-STAT H0: parameter = 0 | 2-tail p-value | 1-tail p-value |
| (Intercept) | -111.154156194121 | 35.379075 | -3.1418 | 0.002747 | 0.001374 |
| Bioscoop | -0.138834616969009 | 0.106731 | -1.3008 | 0.198956 | 0.099478 |
| Eendagsattracties | -0.666006206665054 | 0.158233 | -4.209 | 1e-04 | 5e-05 |
| DVDhuren | 0.965145274240743 | 0.437984 | 2.2036 | 0.031919 | 0.015959 |
| Vrijetijdsbesteding | 1.94875805403434 | 0.181752 | 10.7221 | 0 | 0 |
| Multiple Linear Regression - Regression Statistics | |
| Multiple R | 0.982168707956716 |
| R-squared | 0.964655370889366 |
| Adjusted R-squared | 0.961987851711204 |
| F-TEST (value) | 361.630153884919 |
| F-TEST (DF numerator) | 4 |
| F-TEST (DF denominator) | 53 |
| p-value | 0 |
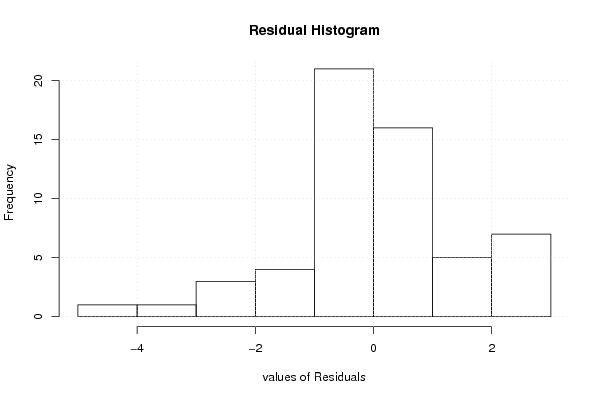
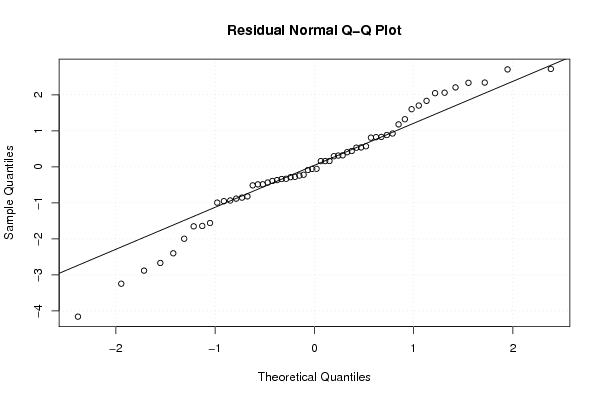
| Multiple Linear Regression - Residual Statistics | |
| Residual Standard Deviation | 1.52741979807648 |
| Sum Squared Residuals | 123.649595696468 |
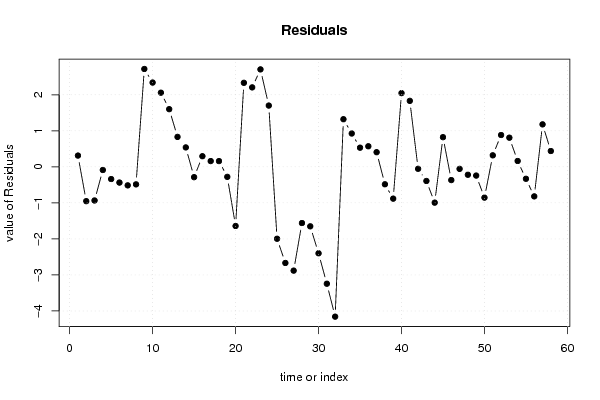
| Multiple Linear Regression - Actuals, Interpolation, and Residuals | |||
| Time or Index | Actuals | Interpolation Forecast | Residuals Prediction Error |
| 1 | 107.34 | 107.026917187518 | 0.313082812482223 |
| 2 | 107.34 | 108.293005163310 | -0.95300516330991 |
| 3 | 107.34 | 108.273886932881 | -0.9338869328806 |
| 4 | 107.34 | 107.427721174346 | -0.0877211743459105 |
| 5 | 107.34 | 107.678843620704 | -0.338843620704044 |
| 6 | 107.34 | 107.776281523406 | -0.436281523405752 |
| 7 | 107.34 | 107.854047170512 | -0.514047170511609 |
| 8 | 107.34 | 107.826385537673 | -0.486385537673072 |
| 9 | 112.6 | 109.882417622207 | 2.71758237779292 |
| 10 | 112.6 | 110.260234709160 | 2.33976529084022 |
| 11 | 112.6 | 110.541604239134 | 2.05839576086619 |
| 12 | 112.6 | 110.999326433639 | 1.60067356636100 |
| 13 | 112.61 | 111.778829655253 | 0.83117034474726 |
| 14 | 112.61 | 112.070774013247 | 0.539225986753183 |
| 15 | 112.61 | 112.896661841962 | -0.286661841962286 |
| 16 | 112.61 | 112.314812956513 | 0.295187043486589 |
| 17 | 112.61 | 112.450117969963 | 0.159882030037384 |
| 18 | 112.61 | 112.450117969963 | 0.159882030037384 |
| 19 | 112.61 | 112.887631426350 | -0.277631426350456 |
| 20 | 112.61 | 114.251208039008 | -1.64120803900792 |
| 21 | 118.65 | 116.317260926395 | 2.33273907360462 |
| 22 | 118.65 | 116.444057035319 | 2.20594296468068 |
| 23 | 118.65 | 115.944951618547 | 2.70504838145293 |
| 24 | 118.65 | 116.948739585951 | 1.70126041404886 |
| 25 | 114.29 | 116.286161847579 | -1.99616184757945 |
| 26 | 114.29 | 116.958391038694 | -2.66839103869355 |
| 27 | 114.29 | 117.170722999027 | -2.88072299902651 |
| 28 | 114.29 | 115.849620874404 | -1.55962087440412 |
| 29 | 114.29 | 115.941454658262 | -1.65145465826241 |
| 30 | 114.29 | 116.689787420983 | -2.39978742098255 |
| 31 | 114.29 | 117.534265361016 | -3.24426536101576 |
| 32 | 114.29 | 118.448649689577 | -4.15864968957707 |
| 33 | 123.33 | 122.008259661106 | 1.32174033889377 |
| 34 | 123.33 | 122.404127273587 | 0.92587272641265 |
| 35 | 123.33 | 122.798399062056 | 0.531600937943915 |
| 36 | 123.33 | 122.758891959638 | 0.571108040362074 |
| 37 | 123.33 | 122.92333600637 | 0.406663993630103 |
| 38 | 123.33 | 123.814615174542 | -0.484615174541932 |
| 39 | 123.33 | 124.212725512703 | -0.882725512702505 |
| 40 | 123.33 | 121.284071751495 | 2.04592824850540 |
| 41 | 123.33 | 121.498065787327 | 1.83193421267266 |
| 42 | 123.33 | 123.384348263726 | -0.0543482637256264 |
| 43 | 123.33 | 123.721779759599 | -0.391779759598824 |
| 44 | 123.33 | 124.323682215789 | -0.993682215788958 |
| 45 | 129.03 | 128.205881498806 | 0.824118501193542 |
| 46 | 128.76 | 129.127544664185 | -0.367544664184801 |
| 47 | 128.76 | 128.815928050595 | -0.0559280505948416 |
| 48 | 128.76 | 128.979823919709 | -0.219823919708622 |
| 49 | 128.76 | 129.002138926753 | -0.24213892675302 |
| 50 | 128.76 | 129.614618498406 | -0.854618498405737 |
| 51 | 128.76 | 128.439968690336 | 0.320031309663901 |
| 52 | 128.76 | 127.876208171417 | 0.883791828583244 |
| 53 | 128.76 | 127.950295834735 | 0.809704165265292 |
| 54 | 128.76 | 128.597569292678 | 0.162430707321695 |
| 55 | 128.76 | 129.091818241645 | -0.331818241645451 |
| 56 | 128.76 | 129.579931130432 | -0.81993113043168 |
| 57 | 132.63 | 131.450738862305 | 1.17926113769534 |
| 58 | 132.63 | 132.19034354756 | 0.43965645243994 |
| Goldfeld-Quandt test for Heteroskedasticity | |||
| p-values | Alternative Hypothesis | ||
| breakpoint index | greater | 2-sided | less |
| 8 | 0 | 0 | 1 |
| 9 | 0.00221863467358035 | 0.00443726934716069 | 0.99778136532642 |
| 10 | 0.00387637260973758 | 0.00775274521947517 | 0.996123627390262 |
| 11 | 0.00125744809800876 | 0.00251489619601752 | 0.99874255190199 |
| 12 | 0.0144968695595750 | 0.0289937391191500 | 0.985503130440425 |
| 13 | 0.0329638367444320 | 0.0659276734888641 | 0.967036163255568 |
| 14 | 0.0347528448175066 | 0.0695056896350131 | 0.965247155182493 |
| 15 | 0.0187916551382971 | 0.0375833102765943 | 0.981208344861703 |
| 16 | 0.0103691700412704 | 0.0207383400825407 | 0.98963082995873 |
| 17 | 0.00522657437216752 | 0.0104531487443350 | 0.994773425627832 |
| 18 | 0.00252004950709234 | 0.00504009901418468 | 0.997479950492908 |
| 19 | 0.00152700931555798 | 0.00305401863111596 | 0.998472990684442 |
| 20 | 0.00782709921445009 | 0.0156541984289002 | 0.99217290078555 |
| 21 | 0.00790673867621891 | 0.0158134773524378 | 0.992093261323781 |
| 22 | 0.0117063748473429 | 0.0234127496946857 | 0.988293625152657 |
| 23 | 0.0592748571553909 | 0.118549714310782 | 0.94072514284461 |
| 24 | 0.23633032914009 | 0.47266065828018 | 0.76366967085991 |
| 25 | 0.676766887628902 | 0.646466224742196 | 0.323233112371098 |
| 26 | 0.879834478753871 | 0.240331042492258 | 0.120165521246129 |
| 27 | 0.92830439941046 | 0.143391201179080 | 0.0716956005895402 |
| 28 | 0.903892394884816 | 0.192215210230368 | 0.096107605115184 |
| 29 | 0.877887457200315 | 0.24422508559937 | 0.122112542799685 |
| 30 | 0.856072399546703 | 0.287855200906595 | 0.143927600453297 |
| 31 | 0.901723495277021 | 0.196553009445957 | 0.0982765047229785 |
| 32 | 0.998274466503103 | 0.00345106699379431 | 0.00172553349689716 |
| 33 | 0.997863283398662 | 0.00427343320267568 | 0.00213671660133784 |
| 34 | 0.997935157546327 | 0.00412968490734691 | 0.00206484245367346 |
| 35 | 0.998280666339612 | 0.00343866732077679 | 0.00171933366038840 |
| 36 | 0.997974123152594 | 0.00405175369481125 | 0.00202587684740563 |
| 37 | 0.997359625053978 | 0.00528074989204477 | 0.00264037494602239 |
| 38 | 0.99469858968265 | 0.0106028206347017 | 0.00530141031735086 |
| 39 | 0.989486427123236 | 0.0210271457535285 | 0.0105135728767643 |
| 40 | 0.996701281156467 | 0.00659743768706599 | 0.00329871884353299 |
| 41 | 0.999438916370973 | 0.00112216725805409 | 0.000561083629027047 |
| 42 | 0.998554567598187 | 0.00289086480362656 | 0.00144543240181328 |
| 43 | 0.99631669576534 | 0.0073666084693204 | 0.0036833042346602 |
| 44 | 0.999141552519935 | 0.00171689496013013 | 0.000858447480065063 |
| 45 | 0.999364530149377 | 0.00127093970124689 | 0.000635469850623445 |
| 46 | 0.998773355189448 | 0.00245328962110346 | 0.00122664481055173 |
| 47 | 0.997214089621967 | 0.00557182075606572 | 0.00278591037803286 |
| 48 | 0.99060159927498 | 0.0187968014500397 | 0.00939840072501983 |
| 49 | 0.96893438313358 | 0.06213123373284 | 0.03106561686642 |
| 50 | 0.91363097680653 | 0.17273804638694 | 0.08636902319347 |
| Meta Analysis of Goldfeld-Quandt test for Heteroskedasticity | |||
| Description | # significant tests | % significant tests | OK/NOK |
| 1% type I error level | 20 | 0.465116279069767 | NOK |
| 5% type I error level | 30 | 0.697674418604651 | NOK |
| 10% type I error level | 33 | 0.767441860465116 | NOK |