| Multiple Linear Regression - Estimated Regression Equation |
| Bioscoop[t] = -174.117057776153 -0.222841174760967Schouwburgabonnement[t] -0.0355988545204673Eendagsattracties[t] + 1.94413794987771DVDhuren[t] + 1.04536917079402Cultuuruitgaven[t] + e[t] |
| Multiple Linear Regression - Ordinary Least Squares | |||||
| Variable | Parameter | S.D. | T-STAT H0: parameter = 0 | 2-tail p-value | 1-tail p-value |
| (Intercept) | -174.117057776153 | 42.558301 | -4.0913 | 0.000147 | 7.3e-05 |
| Schouwburgabonnement | -0.222841174760967 | 0.171312 | -1.3008 | 0.198956 | 0.099478 |
| Eendagsattracties | -0.0355988545204673 | 0.23151 | -0.1538 | 0.878377 | 0.439188 |
| DVDhuren | 1.94413794987771 | 0.514586 | 3.7781 | 0.000402 | 0.000201 |
| Cultuuruitgaven | 1.04536917079402 | 0.383945 | 2.7227 | 0.008746 | 0.004373 |
| Multiple Linear Regression - Regression Statistics | |
| Multiple R | 0.958447028955654 |
| R-squared | 0.91862070731392 |
| Adjusted R-squared | 0.91247887390365 |
| F-TEST (value) | 149.567831940513 |
| F-TEST (DF numerator) | 4 |
| F-TEST (DF denominator) | 53 |
| p-value | 0 |
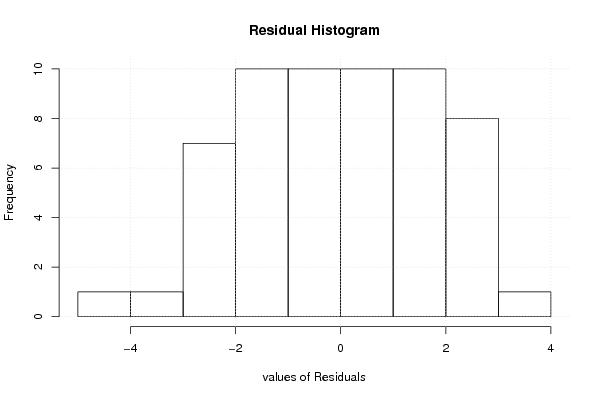
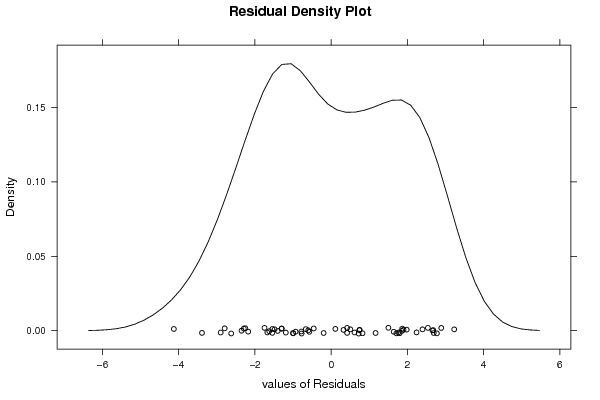
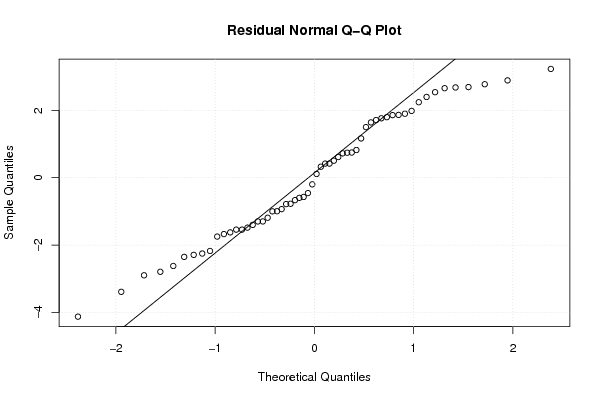
| Multiple Linear Regression - Residual Statistics | |
| Residual Standard Deviation | 1.93511710571984 |
| Sum Squared Residuals | 198.467945281025 |
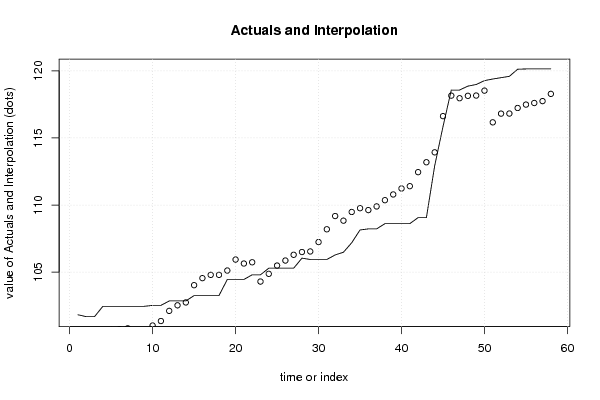
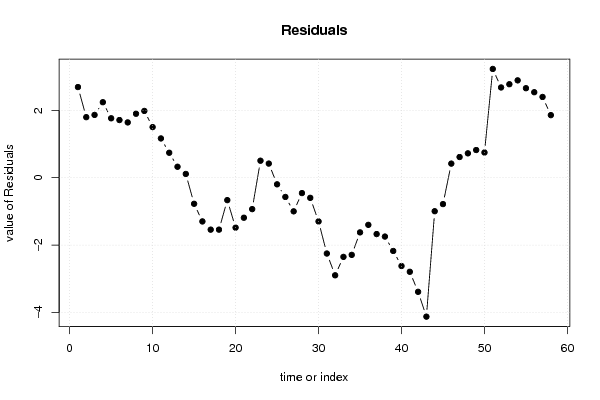
| Multiple Linear Regression - Actuals, Interpolation, and Residuals | |||
| Time or Index | Actuals | Interpolation Forecast | Residuals Prediction Error |
| 1 | 101.82 | 99.1289908915418 | 2.69100910845817 |
| 2 | 101.68 | 99.8833143627193 | 1.79668563728074 |
| 3 | 101.68 | 99.8160025364321 | 1.8639974635679 |
| 4 | 102.45 | 100.209341222613 | 2.24065877738671 |
| 5 | 102.45 | 100.686388022292 | 1.76361197770813 |
| 6 | 102.45 | 100.738656480832 | 1.71134351916843 |
| 7 | 102.45 | 100.808900314953 | 1.64109968504704 |
| 8 | 102.45 | 100.551572705429 | 1.89842729457067 |
| 9 | 102.45 | 100.46807806773 | 1.98192193227048 |
| 10 | 102.52 | 101.018300709364 | 1.50169929063628 |
| 11 | 102.52 | 101.354668176511 | 1.16533182348867 |
| 12 | 102.85 | 102.109758304841 | 0.740241695158778 |
| 13 | 102.85 | 102.525677561411 | 0.324322438588775 |
| 14 | 102.85 | 102.73934107161 | 0.110658928390464 |
| 15 | 103.25 | 104.025212462075 | -0.775212462074822 |
| 16 | 103.25 | 104.54942325109 | -1.29942325109008 |
| 17 | 103.25 | 104.793173496783 | -1.54317349678332 |
| 18 | 103.25 | 104.793173496783 | -1.54317349678332 |
| 19 | 104.45 | 105.117237939729 | -0.667237939729463 |
| 20 | 104.45 | 105.934283561154 | -1.48428356115413 |
| 21 | 104.45 | 105.63955605206 | -1.18955605206033 |
| 22 | 104.8 | 105.733639277432 | -0.933639277431806 |
| 23 | 104.8 | 104.296251534151 | 0.503748465848818 |
| 24 | 105.29 | 104.871204578088 | 0.418795421912119 |
| 25 | 105.29 | 105.487366581976 | -0.197366581975724 |
| 26 | 105.29 | 105.862233479544 | -0.572233479544481 |
| 27 | 105.29 | 106.289943828518 | -0.999943828517574 |
| 28 | 106.04 | 106.49723627926 | -0.457236279260278 |
| 29 | 105.94 | 106.539051046092 | -0.599051046092054 |
| 30 | 105.94 | 107.240023383389 | -1.30002338338867 |
| 31 | 105.94 | 108.192267650252 | -2.25226765025234 |
| 32 | 106.28 | 109.178805000074 | -2.898805000074 |
| 33 | 106.48 | 108.831938448889 | -2.35193844888933 |
| 34 | 107.19 | 109.482299995852 | -2.29229999585161 |
| 35 | 108.14 | 109.764549671966 | -1.624549671966 |
| 36 | 108.22 | 109.620938331601 | -1.40093833160082 |
| 37 | 108.22 | 109.894583648501 | -1.67458364850079 |
| 38 | 108.61 | 110.358944095401 | -1.74894409540147 |
| 39 | 108.61 | 110.786462780086 | -2.17646278008635 |
| 40 | 108.61 | 111.232294231551 | -2.6222942315512 |
| 41 | 108.61 | 111.404142974918 | -2.79414297491778 |
| 42 | 109.06 | 112.449512145712 | -3.3895121457118 |
| 43 | 109.06 | 113.186818562748 | -4.1268185627482 |
| 44 | 112.93 | 113.926290330466 | -0.99629033046596 |
| 45 | 115.84 | 116.624235092372 | -0.784235092371691 |
| 46 | 118.57 | 118.152384370809 | 0.417615629191263 |
| 47 | 118.57 | 117.956696236192 | 0.613303763807932 |
| 48 | 118.86 | 118.137532667349 | 0.722467332650511 |
| 49 | 118.98 | 118.158440050765 | 0.821559949234639 |
| 50 | 119.27 | 118.522853256626 | 0.747146743373847 |
| 51 | 119.39 | 116.161458649483 | 3.2285413505167 |
| 52 | 119.49 | 116.811053104864 | 2.67894689513567 |
| 53 | 119.59 | 116.815451116616 | 2.77454888338434 |
| 54 | 120.12 | 117.230666777099 | 2.88933322290094 |
| 55 | 120.14 | 117.483021382007 | 2.65697861799328 |
| 56 | 120.14 | 117.602218338257 | 2.53778166174283 |
| 57 | 120.14 | 117.743377395894 | 2.39662260410551 |
| 58 | 120.14 | 118.282763017244 | 1.85723698275572 |
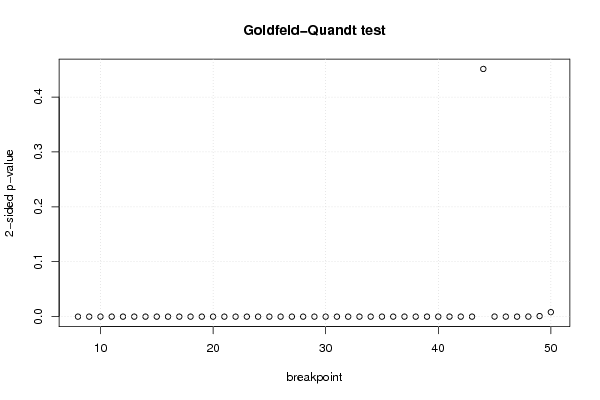
| Goldfeld-Quandt test for Heteroskedasticity | |||
| p-values | Alternative Hypothesis | ||
| breakpoint index | greater | 2-sided | less |
| 8 | 1.13598124113878e-06 | 2.27196248227755e-06 | 0.999998864018759 |
| 9 | 9.70252128244858e-09 | 1.94050425648972e-08 | 0.999999990297479 |
| 10 | 2.52824073214198e-09 | 5.05648146428396e-09 | 0.99999999747176 |
| 11 | 5.54012850145283e-11 | 1.10802570029057e-10 | 0.9999999999446 |
| 12 | 1.5991809348111e-09 | 3.1983618696222e-09 | 0.99999999840082 |
| 13 | 2.97258277185911e-10 | 5.94516554371821e-10 | 0.999999999702742 |
| 14 | 1.93145792500856e-11 | 3.86291585001713e-11 | 0.999999999980685 |
| 15 | 1.38598836815997e-12 | 2.77197673631995e-12 | 0.999999999998614 |
| 16 | 2.49644826937591e-10 | 4.99289653875182e-10 | 0.999999999750355 |
| 17 | 1.21167577926627e-10 | 2.42335155853255e-10 | 0.999999999878832 |
| 18 | 2.39715237498904e-11 | 4.79430474997807e-11 | 0.999999999976029 |
| 19 | 6.10354653733504e-09 | 1.22070930746701e-08 | 0.999999993896453 |
| 20 | 1.55240657835638e-09 | 3.10481315671275e-09 | 0.999999998447593 |
| 21 | 3.87622631678974e-10 | 7.75245263357947e-10 | 0.999999999612377 |
| 22 | 2.05100380557812e-10 | 4.10200761115624e-10 | 0.9999999997949 |
| 23 | 1.68989075731177e-10 | 3.37978151462355e-10 | 0.99999999983101 |
| 24 | 2.46514572704537e-10 | 4.93029145409075e-10 | 0.999999999753485 |
| 25 | 1.30323316801616e-10 | 2.60646633603231e-10 | 0.999999999869677 |
| 26 | 5.85939582691572e-11 | 1.17187916538314e-10 | 0.999999999941406 |
| 27 | 1.53441913446699e-11 | 3.06883826893398e-11 | 0.999999999984656 |
| 28 | 1.25077354724212e-11 | 2.50154709448423e-11 | 0.999999999987492 |
| 29 | 1.90926202867972e-11 | 3.81852405735943e-11 | 0.999999999980907 |
| 30 | 2.16696546353225e-11 | 4.33393092706449e-11 | 0.99999999997833 |
| 31 | 1.41703728469257e-11 | 2.83407456938513e-11 | 0.99999999998583 |
| 32 | 5.51593918058384e-12 | 1.10318783611677e-11 | 0.999999999994484 |
| 33 | 2.45292467131184e-12 | 4.90584934262368e-12 | 0.999999999997547 |
| 34 | 1.26589138451631e-12 | 2.53178276903262e-12 | 0.999999999998734 |
| 35 | 9.01542954649426e-11 | 1.80308590929885e-10 | 0.999999999909846 |
| 36 | 8.1674834475354e-10 | 1.63349668950708e-09 | 0.999999999183252 |
| 37 | 2.70869271842361e-09 | 5.41738543684723e-09 | 0.999999997291307 |
| 38 | 4.07929231129995e-09 | 8.1585846225999e-09 | 0.999999995920708 |
| 39 | 1.19246499472265e-08 | 2.3849299894453e-08 | 0.99999998807535 |
| 40 | 5.98593285585884e-09 | 1.19718657117177e-08 | 0.999999994014067 |
| 41 | 4.09608423020599e-09 | 8.19216846041197e-09 | 0.999999995903916 |
| 42 | 1.80530425354025e-09 | 3.61060850708049e-09 | 0.999999998194696 |
| 43 | 4.64181317624204e-07 | 9.28362635248407e-07 | 0.999999535818682 |
| 44 | 0.225556161495129 | 0.451112322990258 | 0.774443838504871 |
| 45 | 0.999933456590562 | 0.000133086818876828 | 6.65434094384139e-05 |
| 46 | 0.999984652596758 | 3.06948064850125e-05 | 1.53474032425063e-05 |
| 47 | 0.999986263947679 | 2.74721046426296e-05 | 1.37360523213148e-05 |
| 48 | 0.999929472802998 | 0.000141054394003493 | 7.05271970017467e-05 |
| 49 | 0.999478207472525 | 0.00104358505494938 | 0.000521792527474692 |
| 50 | 0.995907631262439 | 0.0081847374751227 | 0.00409236873756135 |
| Meta Analysis of Goldfeld-Quandt test for Heteroskedasticity | |||
| Description | # significant tests | % significant tests | OK/NOK |
| 1% type I error level | 42 | 0.976744186046512 | NOK |
| 5% type I error level | 42 | 0.976744186046512 | NOK |
| 10% type I error level | 42 | 0.976744186046512 | NOK |