Free Statistics

of Irreproducible Research!

Author's title

Author*The author of this computation has been verified*
R Software ModulePatrick.Wessarwasp_pairs.wasp
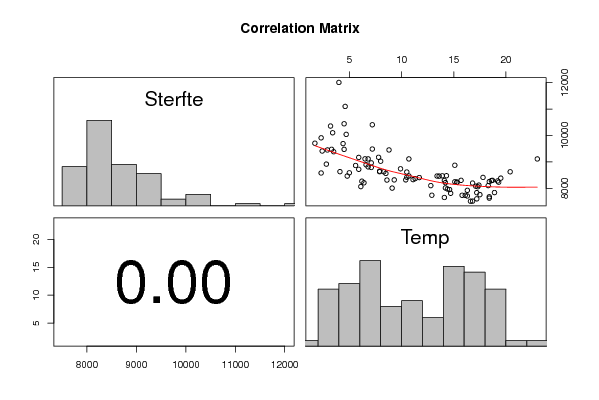
Title produced by softwareKendall tau Correlation Matrix
Date of computationFri, 10 Dec 2010 13:20:02 +0000
Cite this page as followsStatistical Computations at FreeStatistics.org, Office for Research Development and Education, URL https://freestatistics.org/blog/index.php?v=date/2010/Dec/10/t1291987240adj4v4naol26ief.htm/, Retrieved Mon, 29 Apr 2024 12:06:09 +0000
Statistical Computations at FreeStatistics.org, Office for Research Development and Education, URL https://freestatistics.org/blog/index.php?pk=107662, Retrieved Mon, 29 Apr 2024 12:06:09 +0000
QR Codes:

Original text written by user:
IsPrivate?No (this computation is public)
User-defined keywords
Estimated Impact147
Family? (F = Feedback message, R = changed R code, M = changed R Module, P = changed Parameters, D = changed Data)
-     [Kendall tau Correlation Matrix] [] [2010-12-05 17:44:33] [b98453cac15ba1066b407e146608df68]
-   PD  [Kendall tau Correlation Matrix] [WS 10 Pearson Cor...] [2010-12-10 12:57:02] [8081b8996d5947580de3eb171e82db4f]
-   PD      [Kendall tau Correlation Matrix] [WS 10 Kendall tau...] [2010-12-10 13:20:02] [4d0f7ea43b071af5c75b527ee1ef14c2] [Current]
Feedback Forum

Post a new message
Dataseries X:
12008	4.0
9169	5.9
8788	7.1
8417	10.5
8247	15.1
8197	16.8
8236	15.3
8253	18.4
7733	16.1
8366	11.3
8626	7.9
8863	5.6
10102	3.4
8463	4.8
9114	6.5
8563	8.5
8872	15.1
8301	15.7
8301	18.7
8278	19.2
7736	12.9
7973	14.4
8268	6.2
9476	3.3
11100	4.6
8962	7.1
9173	7.8
8738	9.9
8459	13.6
8078	17.1
8411	17.8
8291	18.6
7810	14.7
8616	10.5
8312	8.6
9692	4.4
9911	2.3
8915	2.8
9452	8.8
9112	10.7
8472	13.9
8230	19.3
8384	19.5
8625	20.4
8221	15.3
8649	7.9
8625	8.3
10443	4.5
10357	3.2
8586	5.0
8892	6.6
8329	11.1
8101	12.8
7922	16.3
8120	17.4
7838	18.9
7735	15.8
8406	11.7
8209	6.4
9451	2.9
10041	4.7
9411	2.4
10405	7.2
8467	10.7
8464	13.4
8102	18.3
7627	18.4
7513	16.8
7510	16.6
8291	14.1
8064	6.1
9383	3.5
9706	1.7
8579	2.3
9474	4.5
8318	9.3
8213	14.2
8059	17.3
9111	23.0
7708	16.3
7680	18.4
8014	14.2
8007	9.1
8718	5.9
9486	7.2
9113	6.8
9025	8.0
8476	14.3
7952	14.6
7759	17.5
7835	17.2
7600	17.2
7651	14.1
8319	10.4
8812	6.8
8630	4.1


Summary of computational transaction
Raw Inputview raw input (R code)
Raw Outputview raw output of R engine
Computing time1 seconds
R Server'Gwilym Jenkins' @ 72.249.127.135

\begin{tabular}{lllllllll}
\hline
Summary of computational transaction \tabularnewline
Raw Input & view raw input (R code)  \tabularnewline
Raw Output & view raw output of R engine  \tabularnewline
Computing time & 1 seconds \tabularnewline
R Server & 'Gwilym Jenkins' @ 72.249.127.135 \tabularnewline
\hline
\end{tabular}
%Source: https://freestatistics.org/blog/index.php?pk=107662&T=0

[TABLE]
[ROW][C]Summary of computational transaction[/C][/ROW]
[ROW][C]Raw Input[/C][C]view raw input (R code) [/C][/ROW]
[ROW][C]Raw Output[/C][C]view raw output of R engine [/C][/ROW]
[ROW][C]Computing time[/C][C]1 seconds[/C][/ROW]
[ROW][C]R Server[/C][C]'Gwilym Jenkins' @ 72.249.127.135[/C][/ROW]
[/TABLE]
Source: https://freestatistics.org/blog/index.php?pk=107662&T=0

Globally Unique Identifier (entire table): ba.freestatistics.org/blog/index.php?pk=107662&T=0

As an alternative you can also use a QR Code:  

The GUIDs for individual cells are displayed in the table below:

Summary of computational transaction
Raw Inputview raw input (R code)
Raw Outputview raw output of R engine
Computing time1 seconds
R Server'Gwilym Jenkins' @ 72.249.127.135


Correlations for all pairs of data series (method=kendall)
SterfteTemp
Sterfte1-0.525
Temp-0.5251

\begin{tabular}{lllllllll}
\hline
Correlations for all pairs of data series (method=kendall) \tabularnewline
  & Sterfte & Temp \tabularnewline
Sterfte & 1 & -0.525 \tabularnewline
Temp & -0.525 & 1 \tabularnewline
\hline
\end{tabular}
%Source: https://freestatistics.org/blog/index.php?pk=107662&T=1

[TABLE]
[ROW][C]Correlations for all pairs of data series (method=kendall)[/C][/ROW]
[ROW][C] [/C][C]Sterfte[/C][C]Temp[/C][/ROW]
[ROW][C]Sterfte[/C][C]1[/C][C]-0.525[/C][/ROW]
[ROW][C]Temp[/C][C]-0.525[/C][C]1[/C][/ROW]
[/TABLE]
Source: https://freestatistics.org/blog/index.php?pk=107662&T=1

Globally Unique Identifier (entire table): ba.freestatistics.org/blog/index.php?pk=107662&T=1

As an alternative you can also use a QR Code:  

The GUIDs for individual cells are displayed in the table below:

Correlations for all pairs of data series (method=kendall)
SterfteTemp
Sterfte1-0.525
Temp-0.5251


Correlations for all pairs of data series with p-values
pairPearson rSpearman rhoKendall tau
Sterfte;Temp-0.6712-0.7231-0.5254
p-value(0)(0)(0)

\begin{tabular}{lllllllll}
\hline
Correlations for all pairs of data series with p-values \tabularnewline
pair & Pearson r & Spearman rho & Kendall tau \tabularnewline
Sterfte;Temp & -0.6712 & -0.7231 & -0.5254 \tabularnewline
p-value & (0) & (0) & (0) \tabularnewline
\hline
\end{tabular}
%Source: https://freestatistics.org/blog/index.php?pk=107662&T=2

[TABLE]
[ROW][C]Correlations for all pairs of data series with p-values[/C][/ROW]
[ROW][C]pair[/C][C]Pearson r[/C][C]Spearman rho[/C][C]Kendall tau[/C][/ROW]
[ROW][C]Sterfte;Temp[/C][C]-0.6712[/C][C]-0.7231[/C][C]-0.5254[/C][/ROW]
[ROW][C]p-value[/C][C](0)[/C][C](0)[/C][C](0)[/C][/ROW]
[/TABLE]
Source: https://freestatistics.org/blog/index.php?pk=107662&T=2

Globally Unique Identifier (entire table): ba.freestatistics.org/blog/index.php?pk=107662&T=2

As an alternative you can also use a QR Code:  

The GUIDs for individual cells are displayed in the table below:

Correlations for all pairs of data series with p-values
pairPearson rSpearman rhoKendall tau
Sterfte;Temp-0.6712-0.7231-0.5254
p-value(0)(0)(0)


Parameters (Session):
par1 = kendall ;
Parameters (R input):
par1 = kendall ;
R code (references can be found in the software module):
panel.tau <- function(x, y, digits=2, prefix='', cex.cor)
{
usr <- par('usr'); on.exit(par(usr))
par(usr = c(0, 1, 0, 1))
rr <- cor.test(x, y, method=par1)
r <- round(rr$p.value,2)
txt <- format(c(r, 0.123456789), digits=digits)[1]
txt <- paste(prefix, txt, sep='')
if(missing(cex.cor)) cex <- 0.5/strwidth(txt)
text(0.5, 0.5, txt, cex = cex)
}
panel.hist <- function(x, ...)
{
usr <- par('usr'); on.exit(par(usr))
par(usr = c(usr[1:2], 0, 1.5) )
h <- hist(x, plot = FALSE)
breaks <- h$breaks; nB <- length(breaks)
y <- h$counts; y <- y/max(y)
rect(breaks[-nB], 0, breaks[-1], y, col='grey', ...)
}
bitmap(file='test1.png')
pairs(t(y),diag.panel=panel.hist, upper.panel=panel.smooth, lower.panel=panel.tau, main=main)
dev.off()
load(file='createtable')
n <- length(y[,1])
n
a<-table.start()
a<-table.row.start(a)
a<-table.element(a,paste('Correlations for all pairs of data series (method=',par1,')',sep=''),n+1,TRUE)
a<-table.row.end(a)
a<-table.row.start(a)
a<-table.element(a,' ',header=TRUE)
for (i in 1:n) {
a<-table.element(a,dimnames(t(x))[[2]][i],header=TRUE)
}
a<-table.row.end(a)
for (i in 1:n) {
a<-table.row.start(a)
a<-table.element(a,dimnames(t(x))[[2]][i],header=TRUE)
for (j in 1:n) {
r <- cor.test(y[i,],y[j,],method=par1)
a<-table.element(a,round(r$estimate,3))
}
a<-table.row.end(a)
}
a<-table.end(a)
table.save(a,file='mytable.tab')
a<-table.start()
a<-table.row.start(a)
a<-table.element(a,'Correlations for all pairs of data series with p-values',4,TRUE)
a<-table.row.end(a)
a<-table.row.start(a)
a<-table.element(a,'pair',1,TRUE)
a<-table.element(a,'Pearson r',1,TRUE)
a<-table.element(a,'Spearman rho',1,TRUE)
a<-table.element(a,'Kendall tau',1,TRUE)
a<-table.row.end(a)
cor.test(y[1,],y[2,],method=par1)
for (i in 1:(n-1))
{
for (j in (i+1):n)
{
a<-table.row.start(a)
dum <- paste(dimnames(t(x))[[2]][i],';',dimnames(t(x))[[2]][j],sep='')
a<-table.element(a,dum,header=TRUE)
rp <- cor.test(y[i,],y[j,],method='pearson')
a<-table.element(a,round(rp$estimate,4))
rs <- cor.test(y[i,],y[j,],method='spearman')
a<-table.element(a,round(rs$estimate,4))
rk <- cor.test(y[i,],y[j,],method='kendall')
a<-table.element(a,round(rk$estimate,4))
a<-table.row.end(a)
a<-table.row.start(a)
a<-table.element(a,'p-value',header=T)
a<-table.element(a,paste('(',round(rp$p.value,4),')',sep=''))
a<-table.element(a,paste('(',round(rs$p.value,4),')',sep=''))
a<-table.element(a,paste('(',round(rk$p.value,4),')',sep=''))
a<-table.row.end(a)
}
}
a<-table.end(a)
table.save(a,file='mytable1.tab')