Free Statistics

of Irreproducible Research!

Author's title

Author*The author of this computation has been verified*
R Software Modulerwasp_regression_trees1.wasp
Title produced by softwareRecursive Partitioning (Regression Trees)
Date of computationFri, 10 Dec 2010 13:21:51 +0000
Cite this page as followsStatistical Computations at FreeStatistics.org, Office for Research Development and Education, URL https://freestatistics.org/blog/index.php?v=date/2010/Dec/10/t1291987230c3tx596vhimzrye.htm/, Retrieved Mon, 29 Apr 2024 15:16:02 +0000
Statistical Computations at FreeStatistics.org, Office for Research Development and Education, URL https://freestatistics.org/blog/index.php?pk=107661, Retrieved Mon, 29 Apr 2024 15:16:02 +0000
QR Codes:

Original text written by user:
IsPrivate?No (this computation is public)
User-defined keywords
Estimated Impact89
Family? (F = Feedback message, R = changed R code, M = changed R Module, P = changed Parameters, D = changed Data)
-     [Recursive Partitioning (Regression Trees)] [] [2010-12-05 18:59:57] [b98453cac15ba1066b407e146608df68]
-   PD    [Recursive Partitioning (Regression Trees)] [] [2010-12-10 13:21:51] [8e16b01a5be2b3f7f3ad6418d9d6fd5b] [Current]
Feedback Forum

Post a new message
Dataseries X:
356	182	89
386	213	97
444	227	154
387	209	81
327	219	110
448	221	116
225	114	73
182	97	73
460	205	174
411	215	103
342	224	130
361	189	91
377	182	136
331	201	106
428	198	136
340	173	122
352	238	131
461	258	135
221	122	75
198	101	68
422	259	143
329	243	115
320	188	93
375	173	128
364	224	152
351	215	125
380	196	107
319	159	116
322	187	220
386	208	137
221	131	34
187	93	51
344	210	153
342	228	145
365	176	116
313	195	145
356	188	98
337	188	118
389	190	139
326	188	140
343	176	113
357	225	149
220	93	79
218	79	47
391	235	166
425	247	180
332	195	122
298	197	134
360	211	114
336	156	125
325	209	181
393	180	142
301	185	143
426	303	187
265	129	137
210	85	62
429	249	239
440	231	157
357	212	139
431	240	187
442	234	99
442	217	146
544	287	175
420	221	148
396	208	130
482	241	183
261	156	115
211	96	80
448	320	223
468	242	131
464	227	201
425	200	157


Summary of computational transaction
Raw Inputview raw input (R code)
Raw Outputview raw output of R engine
Computing time6 seconds
R Server'George Udny Yule' @ 72.249.76.132

\begin{tabular}{lllllllll}
\hline
Summary of computational transaction \tabularnewline
Raw Input & view raw input (R code)  \tabularnewline
Raw Output & view raw output of R engine  \tabularnewline
Computing time & 6 seconds \tabularnewline
R Server & 'George Udny Yule' @ 72.249.76.132 \tabularnewline
\hline
\end{tabular}
%Source: https://freestatistics.org/blog/index.php?pk=107661&T=0

[TABLE]
[ROW][C]Summary of computational transaction[/C][/ROW]
[ROW][C]Raw Input[/C][C]view raw input (R code) [/C][/ROW]
[ROW][C]Raw Output[/C][C]view raw output of R engine [/C][/ROW]
[ROW][C]Computing time[/C][C]6 seconds[/C][/ROW]
[ROW][C]R Server[/C][C]'George Udny Yule' @ 72.249.76.132[/C][/ROW]
[/TABLE]
Source: https://freestatistics.org/blog/index.php?pk=107661&T=0

Globally Unique Identifier (entire table): ba.freestatistics.org/blog/index.php?pk=107661&T=0

As an alternative you can also use a QR Code:  

The GUIDs for individual cells are displayed in the table below:

Summary of computational transaction
Raw Inputview raw input (R code)
Raw Outputview raw output of R engine
Computing time6 seconds
R Server'George Udny Yule' @ 72.249.76.132


Goodness of Fit
Correlation0.8406
R-squared0.7067
RMSE42.7464

\begin{tabular}{lllllllll}
\hline
Goodness of Fit \tabularnewline
Correlation & 0.8406 \tabularnewline
R-squared & 0.7067 \tabularnewline
RMSE & 42.7464 \tabularnewline
\hline
\end{tabular}
%Source: https://freestatistics.org/blog/index.php?pk=107661&T=1

[TABLE]
[ROW][C]Goodness of Fit[/C][/ROW]
[ROW][C]Correlation[/C][C]0.8406[/C][/ROW]
[ROW][C]R-squared[/C][C]0.7067[/C][/ROW]
[ROW][C]RMSE[/C][C]42.7464[/C][/ROW]
[/TABLE]
Source: https://freestatistics.org/blog/index.php?pk=107661&T=1

Globally Unique Identifier (entire table): ba.freestatistics.org/blog/index.php?pk=107661&T=1

As an alternative you can also use a QR Code:  

The GUIDs for individual cells are displayed in the table below:

Goodness of Fit
Correlation0.8406
R-squared0.7067
RMSE42.7464


Actuals, Predictions, and Residuals
#ActualsForecastsResiduals
1356364.634146341463-8.6341463414634
2386364.63414634146321.3658536585366
344443014
4387364.63414634146322.3658536585366
5327364.634146341463-37.6341463414634
6448364.63414634146383.3658536585366
7225227.307692307692-2.30769230769232
8182227.307692307692-45.3076923076923
9460364.63414634146395.3658536585366
10411364.63414634146346.3658536585366
11342364.634146341463-22.6341463414634
12361364.634146341463-3.63414634146341
13377364.63414634146312.3658536585366
14331364.634146341463-33.6341463414634
15428364.63414634146363.3658536585366
16340364.634146341463-24.6341463414634
17352430-78
1846143031
19221227.307692307692-6.30769230769232
20198227.307692307692-29.3076923076923
21422430-8
22329430-101
23320364.634146341463-44.6341463414634
24375364.63414634146310.3658536585366
25364364.634146341463-0.634146341463406
26351364.634146341463-13.6341463414634
27380364.63414634146315.3658536585366
28319364.634146341463-45.6341463414634
29322364.634146341463-42.6341463414634
30386364.63414634146321.3658536585366
31221227.307692307692-6.30769230769232
32187227.307692307692-40.3076923076923
33344364.634146341463-20.6341463414634
34342430-88
35365364.6341463414630.365853658536594
36313364.634146341463-51.6341463414634
37356364.634146341463-8.6341463414634
38337364.634146341463-27.6341463414634
39389364.63414634146324.3658536585366
40326364.634146341463-38.6341463414634
41343364.634146341463-21.6341463414634
42357364.634146341463-7.6341463414634
43220227.307692307692-7.30769230769232
44218227.307692307692-9.30769230769232
45391430-39
46425430-5
47332364.634146341463-32.6341463414634
48298364.634146341463-66.6341463414634
49360364.634146341463-4.63414634146341
50336227.307692307692108.692307692308
51325364.634146341463-39.6341463414634
52393364.63414634146328.3658536585366
53301364.634146341463-63.6341463414634
54426430-4
55265227.30769230769237.6923076923077
56210227.307692307692-17.3076923076923
57429430-1
5844043010
59357364.634146341463-7.6341463414634
604314301
6144243012
62442364.63414634146377.3658536585366
63544430114
64420364.63414634146355.3658536585366
65396364.63414634146331.3658536585366
6648243052
67261227.30769230769233.6923076923077
68211227.307692307692-16.3076923076923
6944843018
7046843038
7146443034
72425364.63414634146360.3658536585366

\begin{tabular}{lllllllll}
\hline
Actuals, Predictions, and Residuals \tabularnewline
# & Actuals & Forecasts & Residuals \tabularnewline
1 & 356 & 364.634146341463 & -8.6341463414634 \tabularnewline
2 & 386 & 364.634146341463 & 21.3658536585366 \tabularnewline
3 & 444 & 430 & 14 \tabularnewline
4 & 387 & 364.634146341463 & 22.3658536585366 \tabularnewline
5 & 327 & 364.634146341463 & -37.6341463414634 \tabularnewline
6 & 448 & 364.634146341463 & 83.3658536585366 \tabularnewline
7 & 225 & 227.307692307692 & -2.30769230769232 \tabularnewline
8 & 182 & 227.307692307692 & -45.3076923076923 \tabularnewline
9 & 460 & 364.634146341463 & 95.3658536585366 \tabularnewline
10 & 411 & 364.634146341463 & 46.3658536585366 \tabularnewline
11 & 342 & 364.634146341463 & -22.6341463414634 \tabularnewline
12 & 361 & 364.634146341463 & -3.63414634146341 \tabularnewline
13 & 377 & 364.634146341463 & 12.3658536585366 \tabularnewline
14 & 331 & 364.634146341463 & -33.6341463414634 \tabularnewline
15 & 428 & 364.634146341463 & 63.3658536585366 \tabularnewline
16 & 340 & 364.634146341463 & -24.6341463414634 \tabularnewline
17 & 352 & 430 & -78 \tabularnewline
18 & 461 & 430 & 31 \tabularnewline
19 & 221 & 227.307692307692 & -6.30769230769232 \tabularnewline
20 & 198 & 227.307692307692 & -29.3076923076923 \tabularnewline
21 & 422 & 430 & -8 \tabularnewline
22 & 329 & 430 & -101 \tabularnewline
23 & 320 & 364.634146341463 & -44.6341463414634 \tabularnewline
24 & 375 & 364.634146341463 & 10.3658536585366 \tabularnewline
25 & 364 & 364.634146341463 & -0.634146341463406 \tabularnewline
26 & 351 & 364.634146341463 & -13.6341463414634 \tabularnewline
27 & 380 & 364.634146341463 & 15.3658536585366 \tabularnewline
28 & 319 & 364.634146341463 & -45.6341463414634 \tabularnewline
29 & 322 & 364.634146341463 & -42.6341463414634 \tabularnewline
30 & 386 & 364.634146341463 & 21.3658536585366 \tabularnewline
31 & 221 & 227.307692307692 & -6.30769230769232 \tabularnewline
32 & 187 & 227.307692307692 & -40.3076923076923 \tabularnewline
33 & 344 & 364.634146341463 & -20.6341463414634 \tabularnewline
34 & 342 & 430 & -88 \tabularnewline
35 & 365 & 364.634146341463 & 0.365853658536594 \tabularnewline
36 & 313 & 364.634146341463 & -51.6341463414634 \tabularnewline
37 & 356 & 364.634146341463 & -8.6341463414634 \tabularnewline
38 & 337 & 364.634146341463 & -27.6341463414634 \tabularnewline
39 & 389 & 364.634146341463 & 24.3658536585366 \tabularnewline
40 & 326 & 364.634146341463 & -38.6341463414634 \tabularnewline
41 & 343 & 364.634146341463 & -21.6341463414634 \tabularnewline
42 & 357 & 364.634146341463 & -7.6341463414634 \tabularnewline
43 & 220 & 227.307692307692 & -7.30769230769232 \tabularnewline
44 & 218 & 227.307692307692 & -9.30769230769232 \tabularnewline
45 & 391 & 430 & -39 \tabularnewline
46 & 425 & 430 & -5 \tabularnewline
47 & 332 & 364.634146341463 & -32.6341463414634 \tabularnewline
48 & 298 & 364.634146341463 & -66.6341463414634 \tabularnewline
49 & 360 & 364.634146341463 & -4.63414634146341 \tabularnewline
50 & 336 & 227.307692307692 & 108.692307692308 \tabularnewline
51 & 325 & 364.634146341463 & -39.6341463414634 \tabularnewline
52 & 393 & 364.634146341463 & 28.3658536585366 \tabularnewline
53 & 301 & 364.634146341463 & -63.6341463414634 \tabularnewline
54 & 426 & 430 & -4 \tabularnewline
55 & 265 & 227.307692307692 & 37.6923076923077 \tabularnewline
56 & 210 & 227.307692307692 & -17.3076923076923 \tabularnewline
57 & 429 & 430 & -1 \tabularnewline
58 & 440 & 430 & 10 \tabularnewline
59 & 357 & 364.634146341463 & -7.6341463414634 \tabularnewline
60 & 431 & 430 & 1 \tabularnewline
61 & 442 & 430 & 12 \tabularnewline
62 & 442 & 364.634146341463 & 77.3658536585366 \tabularnewline
63 & 544 & 430 & 114 \tabularnewline
64 & 420 & 364.634146341463 & 55.3658536585366 \tabularnewline
65 & 396 & 364.634146341463 & 31.3658536585366 \tabularnewline
66 & 482 & 430 & 52 \tabularnewline
67 & 261 & 227.307692307692 & 33.6923076923077 \tabularnewline
68 & 211 & 227.307692307692 & -16.3076923076923 \tabularnewline
69 & 448 & 430 & 18 \tabularnewline
70 & 468 & 430 & 38 \tabularnewline
71 & 464 & 430 & 34 \tabularnewline
72 & 425 & 364.634146341463 & 60.3658536585366 \tabularnewline
\hline
\end{tabular}
%Source: https://freestatistics.org/blog/index.php?pk=107661&T=2

[TABLE]
[ROW][C]Actuals, Predictions, and Residuals[/C][/ROW]
[ROW][C]#[/C][C]Actuals[/C][C]Forecasts[/C][C]Residuals[/C][/ROW]
[ROW][C]1[/C][C]356[/C][C]364.634146341463[/C][C]-8.6341463414634[/C][/ROW]
[ROW][C]2[/C][C]386[/C][C]364.634146341463[/C][C]21.3658536585366[/C][/ROW]
[ROW][C]3[/C][C]444[/C][C]430[/C][C]14[/C][/ROW]
[ROW][C]4[/C][C]387[/C][C]364.634146341463[/C][C]22.3658536585366[/C][/ROW]
[ROW][C]5[/C][C]327[/C][C]364.634146341463[/C][C]-37.6341463414634[/C][/ROW]
[ROW][C]6[/C][C]448[/C][C]364.634146341463[/C][C]83.3658536585366[/C][/ROW]
[ROW][C]7[/C][C]225[/C][C]227.307692307692[/C][C]-2.30769230769232[/C][/ROW]
[ROW][C]8[/C][C]182[/C][C]227.307692307692[/C][C]-45.3076923076923[/C][/ROW]
[ROW][C]9[/C][C]460[/C][C]364.634146341463[/C][C]95.3658536585366[/C][/ROW]
[ROW][C]10[/C][C]411[/C][C]364.634146341463[/C][C]46.3658536585366[/C][/ROW]
[ROW][C]11[/C][C]342[/C][C]364.634146341463[/C][C]-22.6341463414634[/C][/ROW]
[ROW][C]12[/C][C]361[/C][C]364.634146341463[/C][C]-3.63414634146341[/C][/ROW]
[ROW][C]13[/C][C]377[/C][C]364.634146341463[/C][C]12.3658536585366[/C][/ROW]
[ROW][C]14[/C][C]331[/C][C]364.634146341463[/C][C]-33.6341463414634[/C][/ROW]
[ROW][C]15[/C][C]428[/C][C]364.634146341463[/C][C]63.3658536585366[/C][/ROW]
[ROW][C]16[/C][C]340[/C][C]364.634146341463[/C][C]-24.6341463414634[/C][/ROW]
[ROW][C]17[/C][C]352[/C][C]430[/C][C]-78[/C][/ROW]
[ROW][C]18[/C][C]461[/C][C]430[/C][C]31[/C][/ROW]
[ROW][C]19[/C][C]221[/C][C]227.307692307692[/C][C]-6.30769230769232[/C][/ROW]
[ROW][C]20[/C][C]198[/C][C]227.307692307692[/C][C]-29.3076923076923[/C][/ROW]
[ROW][C]21[/C][C]422[/C][C]430[/C][C]-8[/C][/ROW]
[ROW][C]22[/C][C]329[/C][C]430[/C][C]-101[/C][/ROW]
[ROW][C]23[/C][C]320[/C][C]364.634146341463[/C][C]-44.6341463414634[/C][/ROW]
[ROW][C]24[/C][C]375[/C][C]364.634146341463[/C][C]10.3658536585366[/C][/ROW]
[ROW][C]25[/C][C]364[/C][C]364.634146341463[/C][C]-0.634146341463406[/C][/ROW]
[ROW][C]26[/C][C]351[/C][C]364.634146341463[/C][C]-13.6341463414634[/C][/ROW]
[ROW][C]27[/C][C]380[/C][C]364.634146341463[/C][C]15.3658536585366[/C][/ROW]
[ROW][C]28[/C][C]319[/C][C]364.634146341463[/C][C]-45.6341463414634[/C][/ROW]
[ROW][C]29[/C][C]322[/C][C]364.634146341463[/C][C]-42.6341463414634[/C][/ROW]
[ROW][C]30[/C][C]386[/C][C]364.634146341463[/C][C]21.3658536585366[/C][/ROW]
[ROW][C]31[/C][C]221[/C][C]227.307692307692[/C][C]-6.30769230769232[/C][/ROW]
[ROW][C]32[/C][C]187[/C][C]227.307692307692[/C][C]-40.3076923076923[/C][/ROW]
[ROW][C]33[/C][C]344[/C][C]364.634146341463[/C][C]-20.6341463414634[/C][/ROW]
[ROW][C]34[/C][C]342[/C][C]430[/C][C]-88[/C][/ROW]
[ROW][C]35[/C][C]365[/C][C]364.634146341463[/C][C]0.365853658536594[/C][/ROW]
[ROW][C]36[/C][C]313[/C][C]364.634146341463[/C][C]-51.6341463414634[/C][/ROW]
[ROW][C]37[/C][C]356[/C][C]364.634146341463[/C][C]-8.6341463414634[/C][/ROW]
[ROW][C]38[/C][C]337[/C][C]364.634146341463[/C][C]-27.6341463414634[/C][/ROW]
[ROW][C]39[/C][C]389[/C][C]364.634146341463[/C][C]24.3658536585366[/C][/ROW]
[ROW][C]40[/C][C]326[/C][C]364.634146341463[/C][C]-38.6341463414634[/C][/ROW]
[ROW][C]41[/C][C]343[/C][C]364.634146341463[/C][C]-21.6341463414634[/C][/ROW]
[ROW][C]42[/C][C]357[/C][C]364.634146341463[/C][C]-7.6341463414634[/C][/ROW]
[ROW][C]43[/C][C]220[/C][C]227.307692307692[/C][C]-7.30769230769232[/C][/ROW]
[ROW][C]44[/C][C]218[/C][C]227.307692307692[/C][C]-9.30769230769232[/C][/ROW]
[ROW][C]45[/C][C]391[/C][C]430[/C][C]-39[/C][/ROW]
[ROW][C]46[/C][C]425[/C][C]430[/C][C]-5[/C][/ROW]
[ROW][C]47[/C][C]332[/C][C]364.634146341463[/C][C]-32.6341463414634[/C][/ROW]
[ROW][C]48[/C][C]298[/C][C]364.634146341463[/C][C]-66.6341463414634[/C][/ROW]
[ROW][C]49[/C][C]360[/C][C]364.634146341463[/C][C]-4.63414634146341[/C][/ROW]
[ROW][C]50[/C][C]336[/C][C]227.307692307692[/C][C]108.692307692308[/C][/ROW]
[ROW][C]51[/C][C]325[/C][C]364.634146341463[/C][C]-39.6341463414634[/C][/ROW]
[ROW][C]52[/C][C]393[/C][C]364.634146341463[/C][C]28.3658536585366[/C][/ROW]
[ROW][C]53[/C][C]301[/C][C]364.634146341463[/C][C]-63.6341463414634[/C][/ROW]
[ROW][C]54[/C][C]426[/C][C]430[/C][C]-4[/C][/ROW]
[ROW][C]55[/C][C]265[/C][C]227.307692307692[/C][C]37.6923076923077[/C][/ROW]
[ROW][C]56[/C][C]210[/C][C]227.307692307692[/C][C]-17.3076923076923[/C][/ROW]
[ROW][C]57[/C][C]429[/C][C]430[/C][C]-1[/C][/ROW]
[ROW][C]58[/C][C]440[/C][C]430[/C][C]10[/C][/ROW]
[ROW][C]59[/C][C]357[/C][C]364.634146341463[/C][C]-7.6341463414634[/C][/ROW]
[ROW][C]60[/C][C]431[/C][C]430[/C][C]1[/C][/ROW]
[ROW][C]61[/C][C]442[/C][C]430[/C][C]12[/C][/ROW]
[ROW][C]62[/C][C]442[/C][C]364.634146341463[/C][C]77.3658536585366[/C][/ROW]
[ROW][C]63[/C][C]544[/C][C]430[/C][C]114[/C][/ROW]
[ROW][C]64[/C][C]420[/C][C]364.634146341463[/C][C]55.3658536585366[/C][/ROW]
[ROW][C]65[/C][C]396[/C][C]364.634146341463[/C][C]31.3658536585366[/C][/ROW]
[ROW][C]66[/C][C]482[/C][C]430[/C][C]52[/C][/ROW]
[ROW][C]67[/C][C]261[/C][C]227.307692307692[/C][C]33.6923076923077[/C][/ROW]
[ROW][C]68[/C][C]211[/C][C]227.307692307692[/C][C]-16.3076923076923[/C][/ROW]
[ROW][C]69[/C][C]448[/C][C]430[/C][C]18[/C][/ROW]
[ROW][C]70[/C][C]468[/C][C]430[/C][C]38[/C][/ROW]
[ROW][C]71[/C][C]464[/C][C]430[/C][C]34[/C][/ROW]
[ROW][C]72[/C][C]425[/C][C]364.634146341463[/C][C]60.3658536585366[/C][/ROW]
[/TABLE]
Source: https://freestatistics.org/blog/index.php?pk=107661&T=2

Globally Unique Identifier (entire table): ba.freestatistics.org/blog/index.php?pk=107661&T=2

As an alternative you can also use a QR Code:  

The GUIDs for individual cells are displayed in the table below:

Actuals, Predictions, and Residuals
#ActualsForecastsResiduals
1356364.634146341463-8.6341463414634
2386364.63414634146321.3658536585366
344443014
4387364.63414634146322.3658536585366
5327364.634146341463-37.6341463414634
6448364.63414634146383.3658536585366
7225227.307692307692-2.30769230769232
8182227.307692307692-45.3076923076923
9460364.63414634146395.3658536585366
10411364.63414634146346.3658536585366
11342364.634146341463-22.6341463414634
12361364.634146341463-3.63414634146341
13377364.63414634146312.3658536585366
14331364.634146341463-33.6341463414634
15428364.63414634146363.3658536585366
16340364.634146341463-24.6341463414634
17352430-78
1846143031
19221227.307692307692-6.30769230769232
20198227.307692307692-29.3076923076923
21422430-8
22329430-101
23320364.634146341463-44.6341463414634
24375364.63414634146310.3658536585366
25364364.634146341463-0.634146341463406
26351364.634146341463-13.6341463414634
27380364.63414634146315.3658536585366
28319364.634146341463-45.6341463414634
29322364.634146341463-42.6341463414634
30386364.63414634146321.3658536585366
31221227.307692307692-6.30769230769232
32187227.307692307692-40.3076923076923
33344364.634146341463-20.6341463414634
34342430-88
35365364.6341463414630.365853658536594
36313364.634146341463-51.6341463414634
37356364.634146341463-8.6341463414634
38337364.634146341463-27.6341463414634
39389364.63414634146324.3658536585366
40326364.634146341463-38.6341463414634
41343364.634146341463-21.6341463414634
42357364.634146341463-7.6341463414634
43220227.307692307692-7.30769230769232
44218227.307692307692-9.30769230769232
45391430-39
46425430-5
47332364.634146341463-32.6341463414634
48298364.634146341463-66.6341463414634
49360364.634146341463-4.63414634146341
50336227.307692307692108.692307692308
51325364.634146341463-39.6341463414634
52393364.63414634146328.3658536585366
53301364.634146341463-63.6341463414634
54426430-4
55265227.30769230769237.6923076923077
56210227.307692307692-17.3076923076923
57429430-1
5844043010
59357364.634146341463-7.6341463414634
604314301
6144243012
62442364.63414634146377.3658536585366
63544430114
64420364.63414634146355.3658536585366
65396364.63414634146331.3658536585366
6648243052
67261227.30769230769233.6923076923077
68211227.307692307692-16.3076923076923
6944843018
7046843038
7146443034
72425364.63414634146360.3658536585366


Parameters (Session):
par1 = 1 ; par2 = none ; par3 = 3 ; par4 = no ;
Parameters (R input):
par1 = 1 ; par2 = none ; par3 = 3 ; par4 = no ;
R code (references can be found in the software module):
library(party)
library(Hmisc)
par1 <- as.numeric(par1)
par3 <- as.numeric(par3)
x <- data.frame(t(y))
is.data.frame(x)
x <- x[!is.na(x[,par1]),]
k <- length(x[1,])
n <- length(x[,1])
colnames(x)[par1]
x[,par1]
if (par2 == 'kmeans') {
cl <- kmeans(x[,par1], par3)
print(cl)
clm <- matrix(cbind(cl$centers,1:par3),ncol=2)
clm <- clm[sort.list(clm[,1]),]
for (i in 1:par3) {
cl$cluster[cl$cluster==clm[i,2]] <- paste('C',i,sep='')
}
cl$cluster <- as.factor(cl$cluster)
print(cl$cluster)
x[,par1] <- cl$cluster
}
if (par2 == 'quantiles') {
x[,par1] <- cut2(x[,par1],g=par3)
}
if (par2 == 'hclust') {
hc <- hclust(dist(x[,par1])^2, 'cen')
print(hc)
memb <- cutree(hc, k = par3)
dum <- c(mean(x[memb==1,par1]))
for (i in 2:par3) {
dum <- c(dum, mean(x[memb==i,par1]))
}
hcm <- matrix(cbind(dum,1:par3),ncol=2)
hcm <- hcm[sort.list(hcm[,1]),]
for (i in 1:par3) {
memb[memb==hcm[i,2]] <- paste('C',i,sep='')
}
memb <- as.factor(memb)
print(memb)
x[,par1] <- memb
}
if (par2=='equal') {
ed <- cut(as.numeric(x[,par1]),par3,labels=paste('C',1:par3,sep=''))
x[,par1] <- as.factor(ed)
}
table(x[,par1])
colnames(x)
colnames(x)[par1]
x[,par1]
if (par2 == 'none') {
m <- ctree(as.formula(paste(colnames(x)[par1],' ~ .',sep='')),data = x)
}
load(file='createtable')
if (par2 != 'none') {
m <- ctree(as.formula(paste('as.factor(',colnames(x)[par1],') ~ .',sep='')),data = x)
if (par4=='yes') {
a<-table.start()
a<-table.row.start(a)
a<-table.element(a,'10-Fold Cross Validation',3+2*par3,TRUE)
a<-table.row.end(a)
a<-table.row.start(a)
a<-table.element(a,'',1,TRUE)
a<-table.element(a,'Prediction (training)',par3+1,TRUE)
a<-table.element(a,'Prediction (testing)',par3+1,TRUE)
a<-table.row.end(a)
a<-table.row.start(a)
a<-table.element(a,'Actual',1,TRUE)
for (jjj in 1:par3) a<-table.element(a,paste('C',jjj,sep=''),1,TRUE)
a<-table.element(a,'CV',1,TRUE)
for (jjj in 1:par3) a<-table.element(a,paste('C',jjj,sep=''),1,TRUE)
a<-table.element(a,'CV',1,TRUE)
a<-table.row.end(a)
for (i in 1:10) {
ind <- sample(2, nrow(x), replace=T, prob=c(0.9,0.1))
m.ct <- ctree(as.formula(paste('as.factor(',colnames(x)[par1],') ~ .',sep='')),data =x[ind==1,])
if (i==1) {
m.ct.i.pred <- predict(m.ct, newdata=x[ind==1,])
m.ct.i.actu <- x[ind==1,par1]
m.ct.x.pred <- predict(m.ct, newdata=x[ind==2,])
m.ct.x.actu <- x[ind==2,par1]
} else {
m.ct.i.pred <- c(m.ct.i.pred,predict(m.ct, newdata=x[ind==1,]))
m.ct.i.actu <- c(m.ct.i.actu,x[ind==1,par1])
m.ct.x.pred <- c(m.ct.x.pred,predict(m.ct, newdata=x[ind==2,]))
m.ct.x.actu <- c(m.ct.x.actu,x[ind==2,par1])
}
}
print(m.ct.i.tab <- table(m.ct.i.actu,m.ct.i.pred))
numer <- 0
for (i in 1:par3) {
print(m.ct.i.tab[i,i] / sum(m.ct.i.tab[i,]))
numer <- numer + m.ct.i.tab[i,i]
}
print(m.ct.i.cp <- numer / sum(m.ct.i.tab))
print(m.ct.x.tab <- table(m.ct.x.actu,m.ct.x.pred))
numer <- 0
for (i in 1:par3) {
print(m.ct.x.tab[i,i] / sum(m.ct.x.tab[i,]))
numer <- numer + m.ct.x.tab[i,i]
}
print(m.ct.x.cp <- numer / sum(m.ct.x.tab))
for (i in 1:par3) {
a<-table.row.start(a)
a<-table.element(a,paste('C',i,sep=''),1,TRUE)
for (jjj in 1:par3) a<-table.element(a,m.ct.i.tab[i,jjj])
a<-table.element(a,round(m.ct.i.tab[i,i]/sum(m.ct.i.tab[i,]),4))
for (jjj in 1:par3) a<-table.element(a,m.ct.x.tab[i,jjj])
a<-table.element(a,round(m.ct.x.tab[i,i]/sum(m.ct.x.tab[i,]),4))
a<-table.row.end(a)
}
a<-table.row.start(a)
a<-table.element(a,'Overall',1,TRUE)
for (jjj in 1:par3) a<-table.element(a,'-')
a<-table.element(a,round(m.ct.i.cp,4))
for (jjj in 1:par3) a<-table.element(a,'-')
a<-table.element(a,round(m.ct.x.cp,4))
a<-table.row.end(a)
a<-table.end(a)
table.save(a,file='mytable3.tab')
}
}
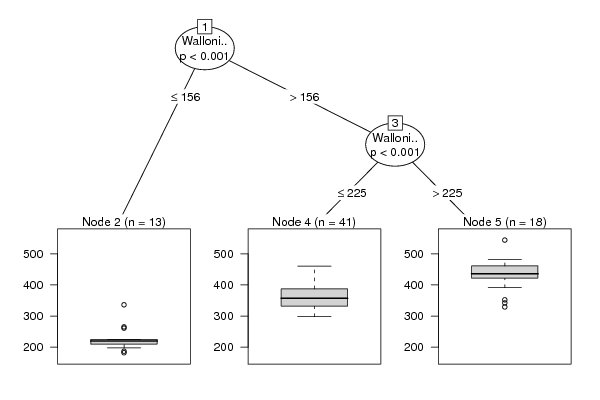
m
bitmap(file='test1.png')
plot(m)
dev.off()
bitmap(file='test1a.png')
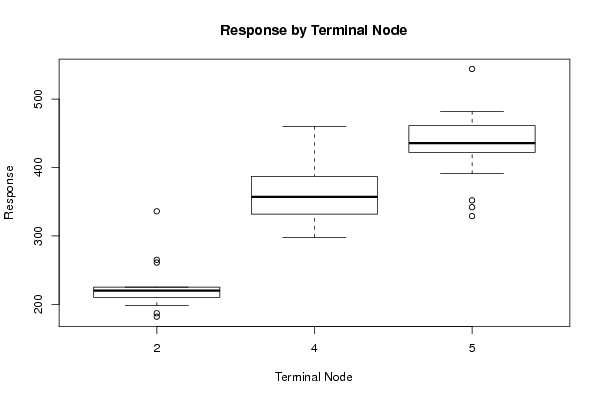
plot(x[,par1] ~ as.factor(where(m)),main='Response by Terminal Node',xlab='Terminal Node',ylab='Response')
dev.off()
if (par2 == 'none') {
forec <- predict(m)
result <- as.data.frame(cbind(x[,par1],forec,x[,par1]-forec))
colnames(result) <- c('Actuals','Forecasts','Residuals')
print(result)
}
if (par2 != 'none') {
print(cbind(as.factor(x[,par1]),predict(m)))
myt <- table(as.factor(x[,par1]),predict(m))
print(myt)
}
bitmap(file='test2.png')
if(par2=='none') {
op <- par(mfrow=c(2,2))
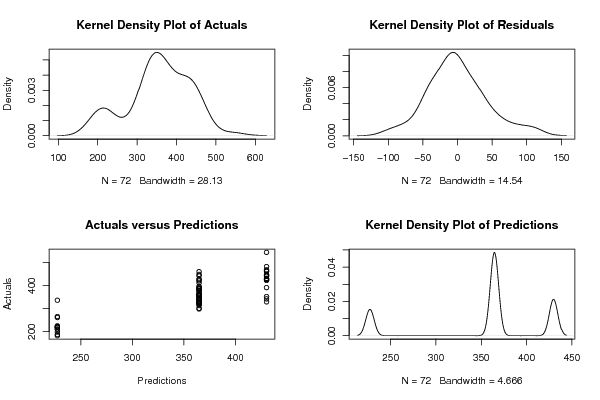
plot(density(result$Actuals),main='Kernel Density Plot of Actuals')
plot(density(result$Residuals),main='Kernel Density Plot of Residuals')
plot(result$Forecasts,result$Actuals,main='Actuals versus Predictions',xlab='Predictions',ylab='Actuals')
plot(density(result$Forecasts),main='Kernel Density Plot of Predictions')
par(op)
}
if(par2!='none') {
plot(myt,main='Confusion Matrix',xlab='Actual',ylab='Predicted')
}
dev.off()
if (par2 == 'none') {
detcoef <- cor(result$Forecasts,result$Actuals)
a<-table.start()
a<-table.row.start(a)
a<-table.element(a,'Goodness of Fit',2,TRUE)
a<-table.row.end(a)
a<-table.row.start(a)
a<-table.element(a,'Correlation',1,TRUE)
a<-table.element(a,round(detcoef,4))
a<-table.row.end(a)
a<-table.row.start(a)
a<-table.element(a,'R-squared',1,TRUE)
a<-table.element(a,round(detcoef*detcoef,4))
a<-table.row.end(a)
a<-table.row.start(a)
a<-table.element(a,'RMSE',1,TRUE)
a<-table.element(a,round(sqrt(mean((result$Residuals)^2)),4))
a<-table.row.end(a)
a<-table.end(a)
table.save(a,file='mytable1.tab')
a<-table.start()
a<-table.row.start(a)
a<-table.element(a,'Actuals, Predictions, and Residuals',4,TRUE)
a<-table.row.end(a)
a<-table.row.start(a)
a<-table.element(a,'#',header=TRUE)
a<-table.element(a,'Actuals',header=TRUE)
a<-table.element(a,'Forecasts',header=TRUE)
a<-table.element(a,'Residuals',header=TRUE)
a<-table.row.end(a)
for (i in 1:length(result$Actuals)) {
a<-table.row.start(a)
a<-table.element(a,i,header=TRUE)
a<-table.element(a,result$Actuals[i])
a<-table.element(a,result$Forecasts[i])
a<-table.element(a,result$Residuals[i])
a<-table.row.end(a)
}
a<-table.end(a)
table.save(a,file='mytable.tab')
}
if (par2 != 'none') {
a<-table.start()
a<-table.row.start(a)
a<-table.element(a,'Confusion Matrix (predicted in columns / actuals in rows)',par3+1,TRUE)
a<-table.row.end(a)
a<-table.row.start(a)
a<-table.element(a,'',1,TRUE)
for (i in 1:par3) {
a<-table.element(a,paste('C',i,sep=''),1,TRUE)
}
a<-table.row.end(a)
for (i in 1:par3) {
a<-table.row.start(a)
a<-table.element(a,paste('C',i,sep=''),1,TRUE)
for (j in 1:par3) {
a<-table.element(a,myt[i,j])
}
a<-table.row.end(a)
}
a<-table.end(a)
table.save(a,file='mytable2.tab')
}