Free Statistics

of Irreproducible Research!

Author's title

Author*The author of this computation has been verified*
R Software Modulerwasp_regression_trees1.wasp
Title produced by softwareRecursive Partitioning (Regression Trees)
Date of computationFri, 10 Dec 2010 13:15:07 +0000
Cite this page as followsStatistical Computations at FreeStatistics.org, Office for Research Development and Education, URL https://freestatistics.org/blog/index.php?v=date/2010/Dec/10/t1291986915bepn0d2warj8vzm.htm/, Retrieved Mon, 29 Apr 2024 14:32:55 +0000
Statistical Computations at FreeStatistics.org, Office for Research Development and Education, URL https://freestatistics.org/blog/index.php?pk=107654, Retrieved Mon, 29 Apr 2024 14:32:55 +0000
QR Codes:

Original text written by user:
IsPrivate?No (this computation is public)
User-defined keywords
Estimated Impact180
Family? (F = Feedback message, R = changed R code, M = changed R Module, P = changed Parameters, D = changed Data)
-     [Recursive Partitioning (Regression Trees)] [] [2010-12-05 18:59:57] [b98453cac15ba1066b407e146608df68]
-   PD  [Recursive Partitioning (Regression Trees)] [] [2010-12-10 11:03:09] [049b50ae610f671f7417ed8e2d1295c1]
-   PD      [Recursive Partitioning (Regression Trees)] [] [2010-12-10 13:15:07] [1638ccfec791c539017705f3e680eb33] [Current]
Feedback Forum

Post a new message
Dataseries X:
2148	77.405	82.145	315.3
2118	85.056	78.213	329.3
1603	90.088	88.099	308.2
2066	99.285	106.25	335.8
2095	80.428	80.487	343.7
2210	88.017	80.336	349.2
1609	93.489	90.065	312.4
1964	103.961	108.888	337.6
2114	82.591	82.747	360.2
2054	90.913	82.213	372.1
1424	96.787	93.41	341.8
2025	106.045	109.465	377.4
2003	84.752	84.373	337.2
2017	94.173	98.715	384.6
1528	97.733	99.646	358.6
2130	108.499	115.239	383.4
2017	87.972	89.082	384.4
2260	96.091	89.934	402.7
1805	101.846	99.957	372.1
2394	115.652	122.717	364.9
2586	91.269	95.895	314.9
2429	100.911	97.085	320.7
1910	105.248	109.414	308.6
2515	118.681	126.945	328.7


Summary of computational transaction
Raw Inputview raw input (R code)
Raw Outputview raw output of R engine
Computing time5 seconds
R Server'George Udny Yule' @ 72.249.76.132

\begin{tabular}{lllllllll}
\hline
Summary of computational transaction \tabularnewline
Raw Input & view raw input (R code)  \tabularnewline
Raw Output & view raw output of R engine  \tabularnewline
Computing time & 5 seconds \tabularnewline
R Server & 'George Udny Yule' @ 72.249.76.132 \tabularnewline
\hline
\end{tabular}
%Source: https://freestatistics.org/blog/index.php?pk=107654&T=0

[TABLE]
[ROW][C]Summary of computational transaction[/C][/ROW]
[ROW][C]Raw Input[/C][C]view raw input (R code) [/C][/ROW]
[ROW][C]Raw Output[/C][C]view raw output of R engine [/C][/ROW]
[ROW][C]Computing time[/C][C]5 seconds[/C][/ROW]
[ROW][C]R Server[/C][C]'George Udny Yule' @ 72.249.76.132[/C][/ROW]
[/TABLE]
Source: https://freestatistics.org/blog/index.php?pk=107654&T=0

Globally Unique Identifier (entire table): ba.freestatistics.org/blog/index.php?pk=107654&T=0

As an alternative you can also use a QR Code:  

The GUIDs for individual cells are displayed in the table below:

Summary of computational transaction
Raw Inputview raw input (R code)
Raw Outputview raw output of R engine
Computing time5 seconds
R Server'George Udny Yule' @ 72.249.76.132


Goodness of Fit
CorrelationNA
R-squaredNA
RMSE289.5119

\begin{tabular}{lllllllll}
\hline
Goodness of Fit \tabularnewline
Correlation & NA \tabularnewline
R-squared & NA \tabularnewline
RMSE & 289.5119 \tabularnewline
\hline
\end{tabular}
%Source: https://freestatistics.org/blog/index.php?pk=107654&T=1

[TABLE]
[ROW][C]Goodness of Fit[/C][/ROW]
[ROW][C]Correlation[/C][C]NA[/C][/ROW]
[ROW][C]R-squared[/C][C]NA[/C][/ROW]
[ROW][C]RMSE[/C][C]289.5119[/C][/ROW]
[/TABLE]
Source: https://freestatistics.org/blog/index.php?pk=107654&T=1

Globally Unique Identifier (entire table): ba.freestatistics.org/blog/index.php?pk=107654&T=1

As an alternative you can also use a QR Code:  

The GUIDs for individual cells are displayed in the table below:

Goodness of Fit
CorrelationNA
R-squaredNA
RMSE289.5119


Actuals, Predictions, and Residuals
#ActualsForecastsResiduals
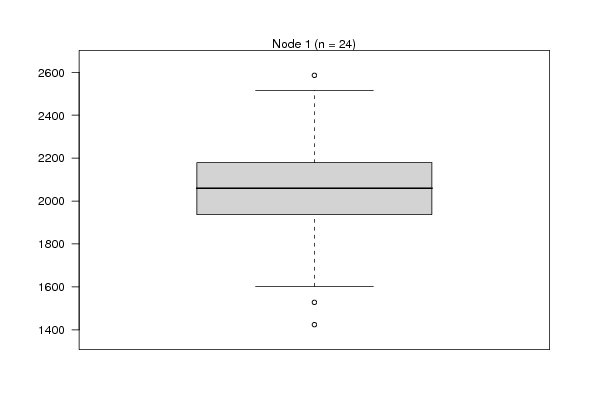
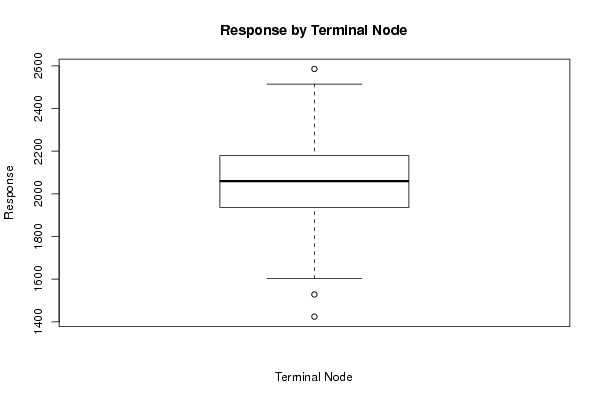
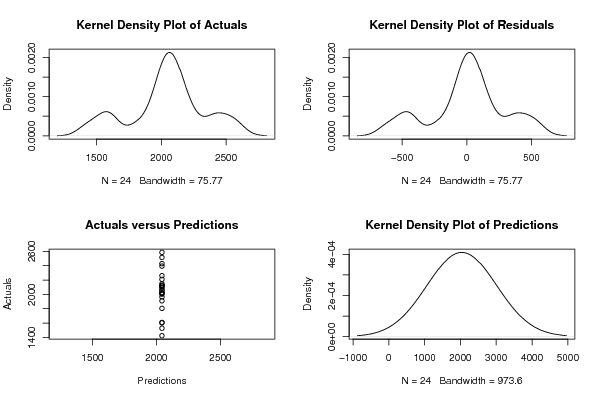
121482042.66666666667105.333333333333
221182042.6666666666775.3333333333333
316032042.66666666667-439.666666666667
420662042.6666666666723.3333333333333
520952042.6666666666752.3333333333333
622102042.66666666667167.333333333333
716092042.66666666667-433.666666666667
819642042.66666666667-78.6666666666667
921142042.6666666666771.3333333333333
1020542042.6666666666711.3333333333333
1114242042.66666666667-618.666666666667
1220252042.66666666667-17.6666666666667
1320032042.66666666667-39.6666666666667
1420172042.66666666667-25.6666666666667
1515282042.66666666667-514.666666666667
1621302042.6666666666787.3333333333333
1720172042.66666666667-25.6666666666667
1822602042.66666666667217.333333333333
1918052042.66666666667-237.666666666667
2023942042.66666666667351.333333333333
2125862042.66666666667543.333333333333
2224292042.66666666667386.333333333333
2319102042.66666666667-132.666666666667
2425152042.66666666667472.333333333333

\begin{tabular}{lllllllll}
\hline
Actuals, Predictions, and Residuals \tabularnewline
# & Actuals & Forecasts & Residuals \tabularnewline
1 & 2148 & 2042.66666666667 & 105.333333333333 \tabularnewline
2 & 2118 & 2042.66666666667 & 75.3333333333333 \tabularnewline
3 & 1603 & 2042.66666666667 & -439.666666666667 \tabularnewline
4 & 2066 & 2042.66666666667 & 23.3333333333333 \tabularnewline
5 & 2095 & 2042.66666666667 & 52.3333333333333 \tabularnewline
6 & 2210 & 2042.66666666667 & 167.333333333333 \tabularnewline
7 & 1609 & 2042.66666666667 & -433.666666666667 \tabularnewline
8 & 1964 & 2042.66666666667 & -78.6666666666667 \tabularnewline
9 & 2114 & 2042.66666666667 & 71.3333333333333 \tabularnewline
10 & 2054 & 2042.66666666667 & 11.3333333333333 \tabularnewline
11 & 1424 & 2042.66666666667 & -618.666666666667 \tabularnewline
12 & 2025 & 2042.66666666667 & -17.6666666666667 \tabularnewline
13 & 2003 & 2042.66666666667 & -39.6666666666667 \tabularnewline
14 & 2017 & 2042.66666666667 & -25.6666666666667 \tabularnewline
15 & 1528 & 2042.66666666667 & -514.666666666667 \tabularnewline
16 & 2130 & 2042.66666666667 & 87.3333333333333 \tabularnewline
17 & 2017 & 2042.66666666667 & -25.6666666666667 \tabularnewline
18 & 2260 & 2042.66666666667 & 217.333333333333 \tabularnewline
19 & 1805 & 2042.66666666667 & -237.666666666667 \tabularnewline
20 & 2394 & 2042.66666666667 & 351.333333333333 \tabularnewline
21 & 2586 & 2042.66666666667 & 543.333333333333 \tabularnewline
22 & 2429 & 2042.66666666667 & 386.333333333333 \tabularnewline
23 & 1910 & 2042.66666666667 & -132.666666666667 \tabularnewline
24 & 2515 & 2042.66666666667 & 472.333333333333 \tabularnewline
\hline
\end{tabular}
%Source: https://freestatistics.org/blog/index.php?pk=107654&T=2

[TABLE]
[ROW][C]Actuals, Predictions, and Residuals[/C][/ROW]
[ROW][C]#[/C][C]Actuals[/C][C]Forecasts[/C][C]Residuals[/C][/ROW]
[ROW][C]1[/C][C]2148[/C][C]2042.66666666667[/C][C]105.333333333333[/C][/ROW]
[ROW][C]2[/C][C]2118[/C][C]2042.66666666667[/C][C]75.3333333333333[/C][/ROW]
[ROW][C]3[/C][C]1603[/C][C]2042.66666666667[/C][C]-439.666666666667[/C][/ROW]
[ROW][C]4[/C][C]2066[/C][C]2042.66666666667[/C][C]23.3333333333333[/C][/ROW]
[ROW][C]5[/C][C]2095[/C][C]2042.66666666667[/C][C]52.3333333333333[/C][/ROW]
[ROW][C]6[/C][C]2210[/C][C]2042.66666666667[/C][C]167.333333333333[/C][/ROW]
[ROW][C]7[/C][C]1609[/C][C]2042.66666666667[/C][C]-433.666666666667[/C][/ROW]
[ROW][C]8[/C][C]1964[/C][C]2042.66666666667[/C][C]-78.6666666666667[/C][/ROW]
[ROW][C]9[/C][C]2114[/C][C]2042.66666666667[/C][C]71.3333333333333[/C][/ROW]
[ROW][C]10[/C][C]2054[/C][C]2042.66666666667[/C][C]11.3333333333333[/C][/ROW]
[ROW][C]11[/C][C]1424[/C][C]2042.66666666667[/C][C]-618.666666666667[/C][/ROW]
[ROW][C]12[/C][C]2025[/C][C]2042.66666666667[/C][C]-17.6666666666667[/C][/ROW]
[ROW][C]13[/C][C]2003[/C][C]2042.66666666667[/C][C]-39.6666666666667[/C][/ROW]
[ROW][C]14[/C][C]2017[/C][C]2042.66666666667[/C][C]-25.6666666666667[/C][/ROW]
[ROW][C]15[/C][C]1528[/C][C]2042.66666666667[/C][C]-514.666666666667[/C][/ROW]
[ROW][C]16[/C][C]2130[/C][C]2042.66666666667[/C][C]87.3333333333333[/C][/ROW]
[ROW][C]17[/C][C]2017[/C][C]2042.66666666667[/C][C]-25.6666666666667[/C][/ROW]
[ROW][C]18[/C][C]2260[/C][C]2042.66666666667[/C][C]217.333333333333[/C][/ROW]
[ROW][C]19[/C][C]1805[/C][C]2042.66666666667[/C][C]-237.666666666667[/C][/ROW]
[ROW][C]20[/C][C]2394[/C][C]2042.66666666667[/C][C]351.333333333333[/C][/ROW]
[ROW][C]21[/C][C]2586[/C][C]2042.66666666667[/C][C]543.333333333333[/C][/ROW]
[ROW][C]22[/C][C]2429[/C][C]2042.66666666667[/C][C]386.333333333333[/C][/ROW]
[ROW][C]23[/C][C]1910[/C][C]2042.66666666667[/C][C]-132.666666666667[/C][/ROW]
[ROW][C]24[/C][C]2515[/C][C]2042.66666666667[/C][C]472.333333333333[/C][/ROW]
[/TABLE]
Source: https://freestatistics.org/blog/index.php?pk=107654&T=2

Globally Unique Identifier (entire table): ba.freestatistics.org/blog/index.php?pk=107654&T=2

As an alternative you can also use a QR Code:  

The GUIDs for individual cells are displayed in the table below:

Actuals, Predictions, and Residuals
#ActualsForecastsResiduals
121482042.66666666667105.333333333333
221182042.6666666666775.3333333333333
316032042.66666666667-439.666666666667
420662042.6666666666723.3333333333333
520952042.6666666666752.3333333333333
622102042.66666666667167.333333333333
716092042.66666666667-433.666666666667
819642042.66666666667-78.6666666666667
921142042.6666666666771.3333333333333
1020542042.6666666666711.3333333333333
1114242042.66666666667-618.666666666667
1220252042.66666666667-17.6666666666667
1320032042.66666666667-39.6666666666667
1420172042.66666666667-25.6666666666667
1515282042.66666666667-514.666666666667
1621302042.6666666666787.3333333333333
1720172042.66666666667-25.6666666666667
1822602042.66666666667217.333333333333
1918052042.66666666667-237.666666666667
2023942042.66666666667351.333333333333
2125862042.66666666667543.333333333333
2224292042.66666666667386.333333333333
2319102042.66666666667-132.666666666667
2425152042.66666666667472.333333333333


Parameters (Session):
par1 = 1 ; par2 = none ; par3 = 3 ; par4 = no ;
Parameters (R input):
par1 = 1 ; par2 = none ; par3 = 3 ; par4 = no ;
R code (references can be found in the software module):
library(party)
library(Hmisc)
par1 <- as.numeric(par1)
par3 <- as.numeric(par3)
x <- data.frame(t(y))
is.data.frame(x)
x <- x[!is.na(x[,par1]),]
k <- length(x[1,])
n <- length(x[,1])
colnames(x)[par1]
x[,par1]
if (par2 == 'kmeans') {
cl <- kmeans(x[,par1], par3)
print(cl)
clm <- matrix(cbind(cl$centers,1:par3),ncol=2)
clm <- clm[sort.list(clm[,1]),]
for (i in 1:par3) {
cl$cluster[cl$cluster==clm[i,2]] <- paste('C',i,sep='')
}
cl$cluster <- as.factor(cl$cluster)
print(cl$cluster)
x[,par1] <- cl$cluster
}
if (par2 == 'quantiles') {
x[,par1] <- cut2(x[,par1],g=par3)
}
if (par2 == 'hclust') {
hc <- hclust(dist(x[,par1])^2, 'cen')
print(hc)
memb <- cutree(hc, k = par3)
dum <- c(mean(x[memb==1,par1]))
for (i in 2:par3) {
dum <- c(dum, mean(x[memb==i,par1]))
}
hcm <- matrix(cbind(dum,1:par3),ncol=2)
hcm <- hcm[sort.list(hcm[,1]),]
for (i in 1:par3) {
memb[memb==hcm[i,2]] <- paste('C',i,sep='')
}
memb <- as.factor(memb)
print(memb)
x[,par1] <- memb
}
if (par2=='equal') {
ed <- cut(as.numeric(x[,par1]),par3,labels=paste('C',1:par3,sep=''))
x[,par1] <- as.factor(ed)
}
table(x[,par1])
colnames(x)
colnames(x)[par1]
x[,par1]
if (par2 == 'none') {
m <- ctree(as.formula(paste(colnames(x)[par1],' ~ .',sep='')),data = x)
}
load(file='createtable')
if (par2 != 'none') {
m <- ctree(as.formula(paste('as.factor(',colnames(x)[par1],') ~ .',sep='')),data = x)
if (par4=='yes') {
a<-table.start()
a<-table.row.start(a)
a<-table.element(a,'10-Fold Cross Validation',3+2*par3,TRUE)
a<-table.row.end(a)
a<-table.row.start(a)
a<-table.element(a,'',1,TRUE)
a<-table.element(a,'Prediction (training)',par3+1,TRUE)
a<-table.element(a,'Prediction (testing)',par3+1,TRUE)
a<-table.row.end(a)
a<-table.row.start(a)
a<-table.element(a,'Actual',1,TRUE)
for (jjj in 1:par3) a<-table.element(a,paste('C',jjj,sep=''),1,TRUE)
a<-table.element(a,'CV',1,TRUE)
for (jjj in 1:par3) a<-table.element(a,paste('C',jjj,sep=''),1,TRUE)
a<-table.element(a,'CV',1,TRUE)
a<-table.row.end(a)
for (i in 1:10) {
ind <- sample(2, nrow(x), replace=T, prob=c(0.9,0.1))
m.ct <- ctree(as.formula(paste('as.factor(',colnames(x)[par1],') ~ .',sep='')),data =x[ind==1,])
if (i==1) {
m.ct.i.pred <- predict(m.ct, newdata=x[ind==1,])
m.ct.i.actu <- x[ind==1,par1]
m.ct.x.pred <- predict(m.ct, newdata=x[ind==2,])
m.ct.x.actu <- x[ind==2,par1]
} else {
m.ct.i.pred <- c(m.ct.i.pred,predict(m.ct, newdata=x[ind==1,]))
m.ct.i.actu <- c(m.ct.i.actu,x[ind==1,par1])
m.ct.x.pred <- c(m.ct.x.pred,predict(m.ct, newdata=x[ind==2,]))
m.ct.x.actu <- c(m.ct.x.actu,x[ind==2,par1])
}
}
print(m.ct.i.tab <- table(m.ct.i.actu,m.ct.i.pred))
numer <- 0
for (i in 1:par3) {
print(m.ct.i.tab[i,i] / sum(m.ct.i.tab[i,]))
numer <- numer + m.ct.i.tab[i,i]
}
print(m.ct.i.cp <- numer / sum(m.ct.i.tab))
print(m.ct.x.tab <- table(m.ct.x.actu,m.ct.x.pred))
numer <- 0
for (i in 1:par3) {
print(m.ct.x.tab[i,i] / sum(m.ct.x.tab[i,]))
numer <- numer + m.ct.x.tab[i,i]
}
print(m.ct.x.cp <- numer / sum(m.ct.x.tab))
for (i in 1:par3) {
a<-table.row.start(a)
a<-table.element(a,paste('C',i,sep=''),1,TRUE)
for (jjj in 1:par3) a<-table.element(a,m.ct.i.tab[i,jjj])
a<-table.element(a,round(m.ct.i.tab[i,i]/sum(m.ct.i.tab[i,]),4))
for (jjj in 1:par3) a<-table.element(a,m.ct.x.tab[i,jjj])
a<-table.element(a,round(m.ct.x.tab[i,i]/sum(m.ct.x.tab[i,]),4))
a<-table.row.end(a)
}
a<-table.row.start(a)
a<-table.element(a,'Overall',1,TRUE)
for (jjj in 1:par3) a<-table.element(a,'-')
a<-table.element(a,round(m.ct.i.cp,4))
for (jjj in 1:par3) a<-table.element(a,'-')
a<-table.element(a,round(m.ct.x.cp,4))
a<-table.row.end(a)
a<-table.end(a)
table.save(a,file='mytable3.tab')
}
}
m
bitmap(file='test1.png')
plot(m)
dev.off()
bitmap(file='test1a.png')
plot(x[,par1] ~ as.factor(where(m)),main='Response by Terminal Node',xlab='Terminal Node',ylab='Response')
dev.off()
if (par2 == 'none') {
forec <- predict(m)
result <- as.data.frame(cbind(x[,par1],forec,x[,par1]-forec))
colnames(result) <- c('Actuals','Forecasts','Residuals')
print(result)
}
if (par2 != 'none') {
print(cbind(as.factor(x[,par1]),predict(m)))
myt <- table(as.factor(x[,par1]),predict(m))
print(myt)
}
bitmap(file='test2.png')
if(par2=='none') {
op <- par(mfrow=c(2,2))
plot(density(result$Actuals),main='Kernel Density Plot of Actuals')
plot(density(result$Residuals),main='Kernel Density Plot of Residuals')
plot(result$Forecasts,result$Actuals,main='Actuals versus Predictions',xlab='Predictions',ylab='Actuals')
plot(density(result$Forecasts),main='Kernel Density Plot of Predictions')
par(op)
}
if(par2!='none') {
plot(myt,main='Confusion Matrix',xlab='Actual',ylab='Predicted')
}
dev.off()
if (par2 == 'none') {
detcoef <- cor(result$Forecasts,result$Actuals)
a<-table.start()
a<-table.row.start(a)
a<-table.element(a,'Goodness of Fit',2,TRUE)
a<-table.row.end(a)
a<-table.row.start(a)
a<-table.element(a,'Correlation',1,TRUE)
a<-table.element(a,round(detcoef,4))
a<-table.row.end(a)
a<-table.row.start(a)
a<-table.element(a,'R-squared',1,TRUE)
a<-table.element(a,round(detcoef*detcoef,4))
a<-table.row.end(a)
a<-table.row.start(a)
a<-table.element(a,'RMSE',1,TRUE)
a<-table.element(a,round(sqrt(mean((result$Residuals)^2)),4))
a<-table.row.end(a)
a<-table.end(a)
table.save(a,file='mytable1.tab')
a<-table.start()
a<-table.row.start(a)
a<-table.element(a,'Actuals, Predictions, and Residuals',4,TRUE)
a<-table.row.end(a)
a<-table.row.start(a)
a<-table.element(a,'#',header=TRUE)
a<-table.element(a,'Actuals',header=TRUE)
a<-table.element(a,'Forecasts',header=TRUE)
a<-table.element(a,'Residuals',header=TRUE)
a<-table.row.end(a)
for (i in 1:length(result$Actuals)) {
a<-table.row.start(a)
a<-table.element(a,i,header=TRUE)
a<-table.element(a,result$Actuals[i])
a<-table.element(a,result$Forecasts[i])
a<-table.element(a,result$Residuals[i])
a<-table.row.end(a)
}
a<-table.end(a)
table.save(a,file='mytable.tab')
}
if (par2 != 'none') {
a<-table.start()
a<-table.row.start(a)
a<-table.element(a,'Confusion Matrix (predicted in columns / actuals in rows)',par3+1,TRUE)
a<-table.row.end(a)
a<-table.row.start(a)
a<-table.element(a,'',1,TRUE)
for (i in 1:par3) {
a<-table.element(a,paste('C',i,sep=''),1,TRUE)
}
a<-table.row.end(a)
for (i in 1:par3) {
a<-table.row.start(a)
a<-table.element(a,paste('C',i,sep=''),1,TRUE)
for (j in 1:par3) {
a<-table.element(a,myt[i,j])
}
a<-table.row.end(a)
}
a<-table.end(a)
table.save(a,file='mytable2.tab')
}