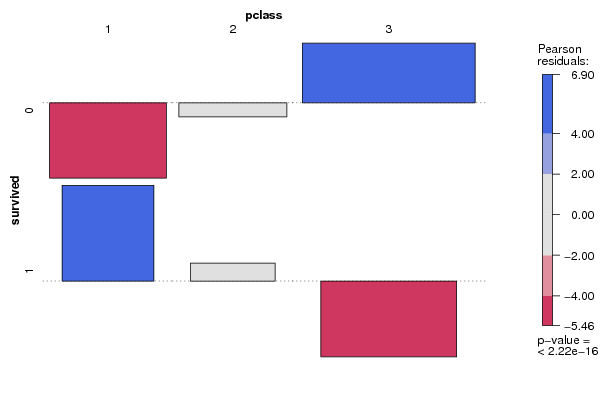
| Tabulation of Results | |||
| survived x pclass | |||
| 1 | 2 | 3 | 0 | 123 | 158 | 528 | 1 | 200 | 119 | 181 |
| Tabulation of Expected Results | |||
| survived x pclass | |||
| 1 | 2 | 3 | 0 | 199.62 | 171.19 | 438.18 | 1 | 123.38 | 105.81 | 270.82 |
| Statistical Results | |
| Pearson's Chi-squared test | |
| Chi Square Statistic | 127.86 |
| Degrees of Freedom | 2 |
| P value | 0 |