Free Statistics

of Irreproducible Research!

Author's title

Author*The author of this computation has been verified*
R Software Modulerwasp_autocorrelation.wasp
Title produced by software(Partial) Autocorrelation Function
Date of computationFri, 10 Dec 2010 13:04:22 +0000
Cite this page as followsStatistical Computations at FreeStatistics.org, Office for Research Development and Education, URL https://freestatistics.org/blog/index.php?v=date/2010/Dec/10/t1291986209um8awjkwjhfnguw.htm/, Retrieved Mon, 29 Apr 2024 13:12:05 +0000
Statistical Computations at FreeStatistics.org, Office for Research Development and Education, URL https://freestatistics.org/blog/index.php?pk=107644, Retrieved Mon, 29 Apr 2024 13:12:05 +0000
QR Codes:

Original text written by user:
IsPrivate?No (this computation is public)
User-defined keywords
Estimated Impact88
Family? (F = Feedback message, R = changed R code, M = changed R Module, P = changed Parameters, D = changed Data)
-       [(Partial) Autocorrelation Function] [Workshop 9 (Feedb...] [2010-12-10 13:04:22] [c9b1b69acb8f4b2b921fdfd5091a94b7] [Current]
Feedback Forum

Post a new message
Dataseries X:
16198.9
16554.2
19554.2
15903.8
18003.8
18329.6
16260.7
14851.9
18174.1
18406.6
18466.5
16016.5
17428.5
17167.2
19630
17183.6
18344.7
19301.4
18147.5
16192.9
18374.4
20515.2
18957.2
16471.5
18746.8
19009.5
19211.2
20547.7
19325.8
20605.5
20056.9
16141.4
20359.8
19711.6
15638.6
14384.5
13855.6
14308.3
15290.6
14423.8
13779.7
15686.3
14733.8
12522.5
16189.4
16059.1
16007.1
15806.8
15160
15692.1
18908.9
16969.9
16997.5
19858.9
17681.2


Summary of computational transaction
Raw Inputview raw input (R code)
Raw Outputview raw output of R engine
Computing time1 seconds
R Server'RServer@AstonUniversity' @ vre.aston.ac.uk

\begin{tabular}{lllllllll}
\hline
Summary of computational transaction \tabularnewline
Raw Input & view raw input (R code)  \tabularnewline
Raw Output & view raw output of R engine  \tabularnewline
Computing time & 1 seconds \tabularnewline
R Server & 'RServer@AstonUniversity' @ vre.aston.ac.uk \tabularnewline
\hline
\end{tabular}
%Source: https://freestatistics.org/blog/index.php?pk=107644&T=0

[TABLE]
[ROW][C]Summary of computational transaction[/C][/ROW]
[ROW][C]Raw Input[/C][C]view raw input (R code) [/C][/ROW]
[ROW][C]Raw Output[/C][C]view raw output of R engine [/C][/ROW]
[ROW][C]Computing time[/C][C]1 seconds[/C][/ROW]
[ROW][C]R Server[/C][C]'RServer@AstonUniversity' @ vre.aston.ac.uk[/C][/ROW]
[/TABLE]
Source: https://freestatistics.org/blog/index.php?pk=107644&T=0

Globally Unique Identifier (entire table): ba.freestatistics.org/blog/index.php?pk=107644&T=0

As an alternative you can also use a QR Code:  

The GUIDs for individual cells are displayed in the table below:

Summary of computational transaction
Raw Inputview raw input (R code)
Raw Outputview raw output of R engine
Computing time1 seconds
R Server'RServer@AstonUniversity' @ vre.aston.ac.uk


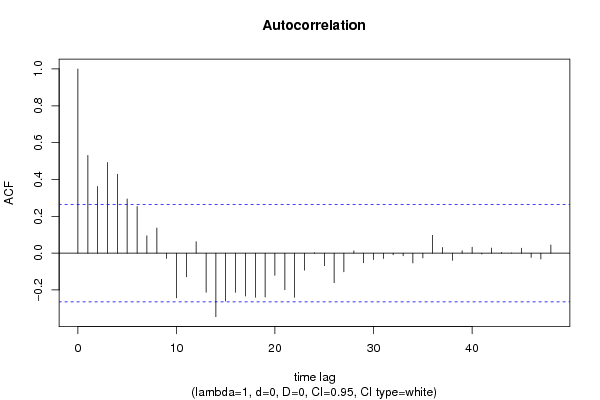
Autocorrelation Function
Time lag kACF(k)T-STATP-value
10.5307733.93630.000117
20.3616812.68230.004818
30.4920133.64890.000293
40.4283353.17660.001222
50.2937152.17820.016846
60.2530131.87640.032955
70.0938120.69570.244765
80.136251.01050.158351
9-0.028809-0.21370.415804
10-0.242793-1.80060.038625
11-0.12828-0.95140.172794
120.0620620.46030.32357
13-0.212876-1.57870.060067
14-0.344768-2.55690.006676
15-0.260041-1.92850.029479
16-0.2122-1.57370.060644
17-0.232678-1.72560.045018
18-0.239137-1.77350.040842
19-0.238293-1.76720.041369
20-0.119912-0.88930.188861
21-0.199002-1.47580.072844
22-0.239976-1.77970.040324
23-0.092287-0.68440.248292
240.0025210.01870.492577
25-0.068036-0.50460.307938
26-0.160176-1.18790.119989
27-0.101337-0.75150.227767
280.0124680.09250.463331
29-0.052268-0.38760.349893
30-0.034815-0.25820.398611
31-0.029733-0.22050.413146
32-0.008904-0.0660.473794
33-0.014074-0.10440.458624
34-0.052998-0.3930.347904
35-0.025947-0.19240.424059
360.0966290.71660.238321
370.0303350.2250.411419
38-0.039037-0.28950.386641
390.013070.09690.461568
400.0324120.24040.405468
41-0.005206-0.03860.48467
420.0273780.2030.419926
430.0038030.02820.488802
440.0002960.00220.499128
450.0271310.20120.42064
46-0.023207-0.17210.431992
47-0.031743-0.23540.407383
480.0440070.32640.372693

\begin{tabular}{lllllllll}
\hline
Autocorrelation Function \tabularnewline
Time lag k & ACF(k) & T-STAT & P-value \tabularnewline
1 & 0.530773 & 3.9363 & 0.000117 \tabularnewline
2 & 0.361681 & 2.6823 & 0.004818 \tabularnewline
3 & 0.492013 & 3.6489 & 0.000293 \tabularnewline
4 & 0.428335 & 3.1766 & 0.001222 \tabularnewline
5 & 0.293715 & 2.1782 & 0.016846 \tabularnewline
6 & 0.253013 & 1.8764 & 0.032955 \tabularnewline
7 & 0.093812 & 0.6957 & 0.244765 \tabularnewline
8 & 0.13625 & 1.0105 & 0.158351 \tabularnewline
9 & -0.028809 & -0.2137 & 0.415804 \tabularnewline
10 & -0.242793 & -1.8006 & 0.038625 \tabularnewline
11 & -0.12828 & -0.9514 & 0.172794 \tabularnewline
12 & 0.062062 & 0.4603 & 0.32357 \tabularnewline
13 & -0.212876 & -1.5787 & 0.060067 \tabularnewline
14 & -0.344768 & -2.5569 & 0.006676 \tabularnewline
15 & -0.260041 & -1.9285 & 0.029479 \tabularnewline
16 & -0.2122 & -1.5737 & 0.060644 \tabularnewline
17 & -0.232678 & -1.7256 & 0.045018 \tabularnewline
18 & -0.239137 & -1.7735 & 0.040842 \tabularnewline
19 & -0.238293 & -1.7672 & 0.041369 \tabularnewline
20 & -0.119912 & -0.8893 & 0.188861 \tabularnewline
21 & -0.199002 & -1.4758 & 0.072844 \tabularnewline
22 & -0.239976 & -1.7797 & 0.040324 \tabularnewline
23 & -0.092287 & -0.6844 & 0.248292 \tabularnewline
24 & 0.002521 & 0.0187 & 0.492577 \tabularnewline
25 & -0.068036 & -0.5046 & 0.307938 \tabularnewline
26 & -0.160176 & -1.1879 & 0.119989 \tabularnewline
27 & -0.101337 & -0.7515 & 0.227767 \tabularnewline
28 & 0.012468 & 0.0925 & 0.463331 \tabularnewline
29 & -0.052268 & -0.3876 & 0.349893 \tabularnewline
30 & -0.034815 & -0.2582 & 0.398611 \tabularnewline
31 & -0.029733 & -0.2205 & 0.413146 \tabularnewline
32 & -0.008904 & -0.066 & 0.473794 \tabularnewline
33 & -0.014074 & -0.1044 & 0.458624 \tabularnewline
34 & -0.052998 & -0.393 & 0.347904 \tabularnewline
35 & -0.025947 & -0.1924 & 0.424059 \tabularnewline
36 & 0.096629 & 0.7166 & 0.238321 \tabularnewline
37 & 0.030335 & 0.225 & 0.411419 \tabularnewline
38 & -0.039037 & -0.2895 & 0.386641 \tabularnewline
39 & 0.01307 & 0.0969 & 0.461568 \tabularnewline
40 & 0.032412 & 0.2404 & 0.405468 \tabularnewline
41 & -0.005206 & -0.0386 & 0.48467 \tabularnewline
42 & 0.027378 & 0.203 & 0.419926 \tabularnewline
43 & 0.003803 & 0.0282 & 0.488802 \tabularnewline
44 & 0.000296 & 0.0022 & 0.499128 \tabularnewline
45 & 0.027131 & 0.2012 & 0.42064 \tabularnewline
46 & -0.023207 & -0.1721 & 0.431992 \tabularnewline
47 & -0.031743 & -0.2354 & 0.407383 \tabularnewline
48 & 0.044007 & 0.3264 & 0.372693 \tabularnewline
\hline
\end{tabular}
%Source: https://freestatistics.org/blog/index.php?pk=107644&T=1

[TABLE]
[ROW][C]Autocorrelation Function[/C][/ROW]
[ROW][C]Time lag k[/C][C]ACF(k)[/C][C]T-STAT[/C][C]P-value[/C][/ROW]
[ROW][C]1[/C][C]0.530773[/C][C]3.9363[/C][C]0.000117[/C][/ROW]
[ROW][C]2[/C][C]0.361681[/C][C]2.6823[/C][C]0.004818[/C][/ROW]
[ROW][C]3[/C][C]0.492013[/C][C]3.6489[/C][C]0.000293[/C][/ROW]
[ROW][C]4[/C][C]0.428335[/C][C]3.1766[/C][C]0.001222[/C][/ROW]
[ROW][C]5[/C][C]0.293715[/C][C]2.1782[/C][C]0.016846[/C][/ROW]
[ROW][C]6[/C][C]0.253013[/C][C]1.8764[/C][C]0.032955[/C][/ROW]
[ROW][C]7[/C][C]0.093812[/C][C]0.6957[/C][C]0.244765[/C][/ROW]
[ROW][C]8[/C][C]0.13625[/C][C]1.0105[/C][C]0.158351[/C][/ROW]
[ROW][C]9[/C][C]-0.028809[/C][C]-0.2137[/C][C]0.415804[/C][/ROW]
[ROW][C]10[/C][C]-0.242793[/C][C]-1.8006[/C][C]0.038625[/C][/ROW]
[ROW][C]11[/C][C]-0.12828[/C][C]-0.9514[/C][C]0.172794[/C][/ROW]
[ROW][C]12[/C][C]0.062062[/C][C]0.4603[/C][C]0.32357[/C][/ROW]
[ROW][C]13[/C][C]-0.212876[/C][C]-1.5787[/C][C]0.060067[/C][/ROW]
[ROW][C]14[/C][C]-0.344768[/C][C]-2.5569[/C][C]0.006676[/C][/ROW]
[ROW][C]15[/C][C]-0.260041[/C][C]-1.9285[/C][C]0.029479[/C][/ROW]
[ROW][C]16[/C][C]-0.2122[/C][C]-1.5737[/C][C]0.060644[/C][/ROW]
[ROW][C]17[/C][C]-0.232678[/C][C]-1.7256[/C][C]0.045018[/C][/ROW]
[ROW][C]18[/C][C]-0.239137[/C][C]-1.7735[/C][C]0.040842[/C][/ROW]
[ROW][C]19[/C][C]-0.238293[/C][C]-1.7672[/C][C]0.041369[/C][/ROW]
[ROW][C]20[/C][C]-0.119912[/C][C]-0.8893[/C][C]0.188861[/C][/ROW]
[ROW][C]21[/C][C]-0.199002[/C][C]-1.4758[/C][C]0.072844[/C][/ROW]
[ROW][C]22[/C][C]-0.239976[/C][C]-1.7797[/C][C]0.040324[/C][/ROW]
[ROW][C]23[/C][C]-0.092287[/C][C]-0.6844[/C][C]0.248292[/C][/ROW]
[ROW][C]24[/C][C]0.002521[/C][C]0.0187[/C][C]0.492577[/C][/ROW]
[ROW][C]25[/C][C]-0.068036[/C][C]-0.5046[/C][C]0.307938[/C][/ROW]
[ROW][C]26[/C][C]-0.160176[/C][C]-1.1879[/C][C]0.119989[/C][/ROW]
[ROW][C]27[/C][C]-0.101337[/C][C]-0.7515[/C][C]0.227767[/C][/ROW]
[ROW][C]28[/C][C]0.012468[/C][C]0.0925[/C][C]0.463331[/C][/ROW]
[ROW][C]29[/C][C]-0.052268[/C][C]-0.3876[/C][C]0.349893[/C][/ROW]
[ROW][C]30[/C][C]-0.034815[/C][C]-0.2582[/C][C]0.398611[/C][/ROW]
[ROW][C]31[/C][C]-0.029733[/C][C]-0.2205[/C][C]0.413146[/C][/ROW]
[ROW][C]32[/C][C]-0.008904[/C][C]-0.066[/C][C]0.473794[/C][/ROW]
[ROW][C]33[/C][C]-0.014074[/C][C]-0.1044[/C][C]0.458624[/C][/ROW]
[ROW][C]34[/C][C]-0.052998[/C][C]-0.393[/C][C]0.347904[/C][/ROW]
[ROW][C]35[/C][C]-0.025947[/C][C]-0.1924[/C][C]0.424059[/C][/ROW]
[ROW][C]36[/C][C]0.096629[/C][C]0.7166[/C][C]0.238321[/C][/ROW]
[ROW][C]37[/C][C]0.030335[/C][C]0.225[/C][C]0.411419[/C][/ROW]
[ROW][C]38[/C][C]-0.039037[/C][C]-0.2895[/C][C]0.386641[/C][/ROW]
[ROW][C]39[/C][C]0.01307[/C][C]0.0969[/C][C]0.461568[/C][/ROW]
[ROW][C]40[/C][C]0.032412[/C][C]0.2404[/C][C]0.405468[/C][/ROW]
[ROW][C]41[/C][C]-0.005206[/C][C]-0.0386[/C][C]0.48467[/C][/ROW]
[ROW][C]42[/C][C]0.027378[/C][C]0.203[/C][C]0.419926[/C][/ROW]
[ROW][C]43[/C][C]0.003803[/C][C]0.0282[/C][C]0.488802[/C][/ROW]
[ROW][C]44[/C][C]0.000296[/C][C]0.0022[/C][C]0.499128[/C][/ROW]
[ROW][C]45[/C][C]0.027131[/C][C]0.2012[/C][C]0.42064[/C][/ROW]
[ROW][C]46[/C][C]-0.023207[/C][C]-0.1721[/C][C]0.431992[/C][/ROW]
[ROW][C]47[/C][C]-0.031743[/C][C]-0.2354[/C][C]0.407383[/C][/ROW]
[ROW][C]48[/C][C]0.044007[/C][C]0.3264[/C][C]0.372693[/C][/ROW]
[/TABLE]
Source: https://freestatistics.org/blog/index.php?pk=107644&T=1

Globally Unique Identifier (entire table): ba.freestatistics.org/blog/index.php?pk=107644&T=1

As an alternative you can also use a QR Code:  

The GUIDs for individual cells are displayed in the table below:

Autocorrelation Function
Time lag kACF(k)T-STATP-value
10.5307733.93630.000117
20.3616812.68230.004818
30.4920133.64890.000293
40.4283353.17660.001222
50.2937152.17820.016846
60.2530131.87640.032955
70.0938120.69570.244765
80.136251.01050.158351
9-0.028809-0.21370.415804
10-0.242793-1.80060.038625
11-0.12828-0.95140.172794
120.0620620.46030.32357
13-0.212876-1.57870.060067
14-0.344768-2.55690.006676
15-0.260041-1.92850.029479
16-0.2122-1.57370.060644
17-0.232678-1.72560.045018
18-0.239137-1.77350.040842
19-0.238293-1.76720.041369
20-0.119912-0.88930.188861
21-0.199002-1.47580.072844
22-0.239976-1.77970.040324
23-0.092287-0.68440.248292
240.0025210.01870.492577
25-0.068036-0.50460.307938
26-0.160176-1.18790.119989
27-0.101337-0.75150.227767
280.0124680.09250.463331
29-0.052268-0.38760.349893
30-0.034815-0.25820.398611
31-0.029733-0.22050.413146
32-0.008904-0.0660.473794
33-0.014074-0.10440.458624
34-0.052998-0.3930.347904
35-0.025947-0.19240.424059
360.0966290.71660.238321
370.0303350.2250.411419
38-0.039037-0.28950.386641
390.013070.09690.461568
400.0324120.24040.405468
41-0.005206-0.03860.48467
420.0273780.2030.419926
430.0038030.02820.488802
440.0002960.00220.499128
450.0271310.20120.42064
46-0.023207-0.17210.431992
47-0.031743-0.23540.407383
480.0440070.32640.372693


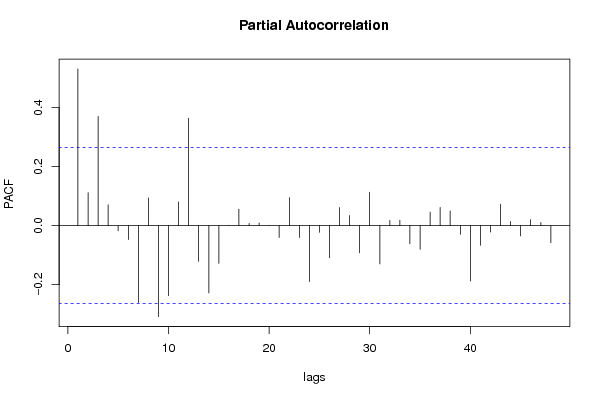
Partial Autocorrelation Function
Time lag kPACF(k)T-STATP-value
10.5307733.93630.000117
20.1113220.82560.206303
30.3697972.74250.004107
40.0703160.52150.302065
5-0.017739-0.13160.447907
6-0.047223-0.35020.363757
7-0.260674-1.93320.029182
80.0935620.69390.245341
9-0.308448-2.28750.013018
10-0.237351-1.76020.041964
110.0798390.59210.278104
120.3640542.69990.004599
13-0.120541-0.8940.18762
14-0.227984-1.69080.04827
15-0.12773-0.94730.173822
16-0.00073-0.00540.497849
170.0554750.41140.341185
180.0074540.05530.478058
190.0086950.06450.474409
200.0004670.00350.498625
21-0.04035-0.29920.38294
220.0944830.70070.243221
23-0.04044-0.29990.382688
24-0.189332-1.40410.082952
25-0.022516-0.1670.433998
26-0.10879-0.80680.211625
270.061530.45630.32498
280.0343610.25480.399902
29-0.091734-0.68030.249579
300.1128220.83670.203188
31-0.129644-0.96150.170263
320.0175120.12990.44857
330.0179660.13320.447246
34-0.061355-0.4550.325443
35-0.080362-0.5960.276817
360.0458250.33980.367634
370.0611780.45370.325912
380.0497470.36890.356798
39-0.029274-0.21710.414465
40-0.188048-1.39460.084371
41-0.066823-0.49560.311086
42-0.021616-0.16030.436612
430.0723460.53650.296878
440.0142650.10580.458066
45-0.034917-0.25890.398321
460.0204240.15150.440081
470.0105220.0780.469041
48-0.057953-0.42980.334514

\begin{tabular}{lllllllll}
\hline
Partial Autocorrelation Function \tabularnewline
Time lag k & PACF(k) & T-STAT & P-value \tabularnewline
1 & 0.530773 & 3.9363 & 0.000117 \tabularnewline
2 & 0.111322 & 0.8256 & 0.206303 \tabularnewline
3 & 0.369797 & 2.7425 & 0.004107 \tabularnewline
4 & 0.070316 & 0.5215 & 0.302065 \tabularnewline
5 & -0.017739 & -0.1316 & 0.447907 \tabularnewline
6 & -0.047223 & -0.3502 & 0.363757 \tabularnewline
7 & -0.260674 & -1.9332 & 0.029182 \tabularnewline
8 & 0.093562 & 0.6939 & 0.245341 \tabularnewline
9 & -0.308448 & -2.2875 & 0.013018 \tabularnewline
10 & -0.237351 & -1.7602 & 0.041964 \tabularnewline
11 & 0.079839 & 0.5921 & 0.278104 \tabularnewline
12 & 0.364054 & 2.6999 & 0.004599 \tabularnewline
13 & -0.120541 & -0.894 & 0.18762 \tabularnewline
14 & -0.227984 & -1.6908 & 0.04827 \tabularnewline
15 & -0.12773 & -0.9473 & 0.173822 \tabularnewline
16 & -0.00073 & -0.0054 & 0.497849 \tabularnewline
17 & 0.055475 & 0.4114 & 0.341185 \tabularnewline
18 & 0.007454 & 0.0553 & 0.478058 \tabularnewline
19 & 0.008695 & 0.0645 & 0.474409 \tabularnewline
20 & 0.000467 & 0.0035 & 0.498625 \tabularnewline
21 & -0.04035 & -0.2992 & 0.38294 \tabularnewline
22 & 0.094483 & 0.7007 & 0.243221 \tabularnewline
23 & -0.04044 & -0.2999 & 0.382688 \tabularnewline
24 & -0.189332 & -1.4041 & 0.082952 \tabularnewline
25 & -0.022516 & -0.167 & 0.433998 \tabularnewline
26 & -0.10879 & -0.8068 & 0.211625 \tabularnewline
27 & 0.06153 & 0.4563 & 0.32498 \tabularnewline
28 & 0.034361 & 0.2548 & 0.399902 \tabularnewline
29 & -0.091734 & -0.6803 & 0.249579 \tabularnewline
30 & 0.112822 & 0.8367 & 0.203188 \tabularnewline
31 & -0.129644 & -0.9615 & 0.170263 \tabularnewline
32 & 0.017512 & 0.1299 & 0.44857 \tabularnewline
33 & 0.017966 & 0.1332 & 0.447246 \tabularnewline
34 & -0.061355 & -0.455 & 0.325443 \tabularnewline
35 & -0.080362 & -0.596 & 0.276817 \tabularnewline
36 & 0.045825 & 0.3398 & 0.367634 \tabularnewline
37 & 0.061178 & 0.4537 & 0.325912 \tabularnewline
38 & 0.049747 & 0.3689 & 0.356798 \tabularnewline
39 & -0.029274 & -0.2171 & 0.414465 \tabularnewline
40 & -0.188048 & -1.3946 & 0.084371 \tabularnewline
41 & -0.066823 & -0.4956 & 0.311086 \tabularnewline
42 & -0.021616 & -0.1603 & 0.436612 \tabularnewline
43 & 0.072346 & 0.5365 & 0.296878 \tabularnewline
44 & 0.014265 & 0.1058 & 0.458066 \tabularnewline
45 & -0.034917 & -0.2589 & 0.398321 \tabularnewline
46 & 0.020424 & 0.1515 & 0.440081 \tabularnewline
47 & 0.010522 & 0.078 & 0.469041 \tabularnewline
48 & -0.057953 & -0.4298 & 0.334514 \tabularnewline
\hline
\end{tabular}
%Source: https://freestatistics.org/blog/index.php?pk=107644&T=2

[TABLE]
[ROW][C]Partial Autocorrelation Function[/C][/ROW]
[ROW][C]Time lag k[/C][C]PACF(k)[/C][C]T-STAT[/C][C]P-value[/C][/ROW]
[ROW][C]1[/C][C]0.530773[/C][C]3.9363[/C][C]0.000117[/C][/ROW]
[ROW][C]2[/C][C]0.111322[/C][C]0.8256[/C][C]0.206303[/C][/ROW]
[ROW][C]3[/C][C]0.369797[/C][C]2.7425[/C][C]0.004107[/C][/ROW]
[ROW][C]4[/C][C]0.070316[/C][C]0.5215[/C][C]0.302065[/C][/ROW]
[ROW][C]5[/C][C]-0.017739[/C][C]-0.1316[/C][C]0.447907[/C][/ROW]
[ROW][C]6[/C][C]-0.047223[/C][C]-0.3502[/C][C]0.363757[/C][/ROW]
[ROW][C]7[/C][C]-0.260674[/C][C]-1.9332[/C][C]0.029182[/C][/ROW]
[ROW][C]8[/C][C]0.093562[/C][C]0.6939[/C][C]0.245341[/C][/ROW]
[ROW][C]9[/C][C]-0.308448[/C][C]-2.2875[/C][C]0.013018[/C][/ROW]
[ROW][C]10[/C][C]-0.237351[/C][C]-1.7602[/C][C]0.041964[/C][/ROW]
[ROW][C]11[/C][C]0.079839[/C][C]0.5921[/C][C]0.278104[/C][/ROW]
[ROW][C]12[/C][C]0.364054[/C][C]2.6999[/C][C]0.004599[/C][/ROW]
[ROW][C]13[/C][C]-0.120541[/C][C]-0.894[/C][C]0.18762[/C][/ROW]
[ROW][C]14[/C][C]-0.227984[/C][C]-1.6908[/C][C]0.04827[/C][/ROW]
[ROW][C]15[/C][C]-0.12773[/C][C]-0.9473[/C][C]0.173822[/C][/ROW]
[ROW][C]16[/C][C]-0.00073[/C][C]-0.0054[/C][C]0.497849[/C][/ROW]
[ROW][C]17[/C][C]0.055475[/C][C]0.4114[/C][C]0.341185[/C][/ROW]
[ROW][C]18[/C][C]0.007454[/C][C]0.0553[/C][C]0.478058[/C][/ROW]
[ROW][C]19[/C][C]0.008695[/C][C]0.0645[/C][C]0.474409[/C][/ROW]
[ROW][C]20[/C][C]0.000467[/C][C]0.0035[/C][C]0.498625[/C][/ROW]
[ROW][C]21[/C][C]-0.04035[/C][C]-0.2992[/C][C]0.38294[/C][/ROW]
[ROW][C]22[/C][C]0.094483[/C][C]0.7007[/C][C]0.243221[/C][/ROW]
[ROW][C]23[/C][C]-0.04044[/C][C]-0.2999[/C][C]0.382688[/C][/ROW]
[ROW][C]24[/C][C]-0.189332[/C][C]-1.4041[/C][C]0.082952[/C][/ROW]
[ROW][C]25[/C][C]-0.022516[/C][C]-0.167[/C][C]0.433998[/C][/ROW]
[ROW][C]26[/C][C]-0.10879[/C][C]-0.8068[/C][C]0.211625[/C][/ROW]
[ROW][C]27[/C][C]0.06153[/C][C]0.4563[/C][C]0.32498[/C][/ROW]
[ROW][C]28[/C][C]0.034361[/C][C]0.2548[/C][C]0.399902[/C][/ROW]
[ROW][C]29[/C][C]-0.091734[/C][C]-0.6803[/C][C]0.249579[/C][/ROW]
[ROW][C]30[/C][C]0.112822[/C][C]0.8367[/C][C]0.203188[/C][/ROW]
[ROW][C]31[/C][C]-0.129644[/C][C]-0.9615[/C][C]0.170263[/C][/ROW]
[ROW][C]32[/C][C]0.017512[/C][C]0.1299[/C][C]0.44857[/C][/ROW]
[ROW][C]33[/C][C]0.017966[/C][C]0.1332[/C][C]0.447246[/C][/ROW]
[ROW][C]34[/C][C]-0.061355[/C][C]-0.455[/C][C]0.325443[/C][/ROW]
[ROW][C]35[/C][C]-0.080362[/C][C]-0.596[/C][C]0.276817[/C][/ROW]
[ROW][C]36[/C][C]0.045825[/C][C]0.3398[/C][C]0.367634[/C][/ROW]
[ROW][C]37[/C][C]0.061178[/C][C]0.4537[/C][C]0.325912[/C][/ROW]
[ROW][C]38[/C][C]0.049747[/C][C]0.3689[/C][C]0.356798[/C][/ROW]
[ROW][C]39[/C][C]-0.029274[/C][C]-0.2171[/C][C]0.414465[/C][/ROW]
[ROW][C]40[/C][C]-0.188048[/C][C]-1.3946[/C][C]0.084371[/C][/ROW]
[ROW][C]41[/C][C]-0.066823[/C][C]-0.4956[/C][C]0.311086[/C][/ROW]
[ROW][C]42[/C][C]-0.021616[/C][C]-0.1603[/C][C]0.436612[/C][/ROW]
[ROW][C]43[/C][C]0.072346[/C][C]0.5365[/C][C]0.296878[/C][/ROW]
[ROW][C]44[/C][C]0.014265[/C][C]0.1058[/C][C]0.458066[/C][/ROW]
[ROW][C]45[/C][C]-0.034917[/C][C]-0.2589[/C][C]0.398321[/C][/ROW]
[ROW][C]46[/C][C]0.020424[/C][C]0.1515[/C][C]0.440081[/C][/ROW]
[ROW][C]47[/C][C]0.010522[/C][C]0.078[/C][C]0.469041[/C][/ROW]
[ROW][C]48[/C][C]-0.057953[/C][C]-0.4298[/C][C]0.334514[/C][/ROW]
[/TABLE]
Source: https://freestatistics.org/blog/index.php?pk=107644&T=2

Globally Unique Identifier (entire table): ba.freestatistics.org/blog/index.php?pk=107644&T=2

As an alternative you can also use a QR Code:  

The GUIDs for individual cells are displayed in the table below:

Partial Autocorrelation Function
Time lag kPACF(k)T-STATP-value
10.5307733.93630.000117
20.1113220.82560.206303
30.3697972.74250.004107
40.0703160.52150.302065
5-0.017739-0.13160.447907
6-0.047223-0.35020.363757
7-0.260674-1.93320.029182
80.0935620.69390.245341
9-0.308448-2.28750.013018
10-0.237351-1.76020.041964
110.0798390.59210.278104
120.3640542.69990.004599
13-0.120541-0.8940.18762
14-0.227984-1.69080.04827
15-0.12773-0.94730.173822
16-0.00073-0.00540.497849
170.0554750.41140.341185
180.0074540.05530.478058
190.0086950.06450.474409
200.0004670.00350.498625
21-0.04035-0.29920.38294
220.0944830.70070.243221
23-0.04044-0.29990.382688
24-0.189332-1.40410.082952
25-0.022516-0.1670.433998
26-0.10879-0.80680.211625
270.061530.45630.32498
280.0343610.25480.399902
29-0.091734-0.68030.249579
300.1128220.83670.203188
31-0.129644-0.96150.170263
320.0175120.12990.44857
330.0179660.13320.447246
34-0.061355-0.4550.325443
35-0.080362-0.5960.276817
360.0458250.33980.367634
370.0611780.45370.325912
380.0497470.36890.356798
39-0.029274-0.21710.414465
40-0.188048-1.39460.084371
41-0.066823-0.49560.311086
42-0.021616-0.16030.436612
430.0723460.53650.296878
440.0142650.10580.458066
45-0.034917-0.25890.398321
460.0204240.15150.440081
470.0105220.0780.469041
48-0.057953-0.42980.334514


Parameters (Session):
par1 = 48 ; par2 = 1 ; par3 = 0 ; par4 = 0 ; par5 = 12 ; par6 = White Noise ; par7 = 0.95 ;
Parameters (R input):
par1 = 48 ; par2 = 1 ; par3 = 0 ; par4 = 0 ; par5 = 12 ; par6 = White Noise ; par7 = 0.95 ;
R code (references can be found in the software module):
if (par1 == 'Default') {
par1 = 10*log10(length(x))
} else {
par1 <- as.numeric(par1)
}
par2 <- as.numeric(par2)
par3 <- as.numeric(par3)
par4 <- as.numeric(par4)
par5 <- as.numeric(par5)
if (par6 == 'White Noise') par6 <- 'white' else par6 <- 'ma'
par7 <- as.numeric(par7)
if (par2 == 0) {
x <- log(x)
} else {
x <- (x ^ par2 - 1) / par2
}
if (par3 > 0) x <- diff(x,lag=1,difference=par3)
if (par4 > 0) x <- diff(x,lag=par5,difference=par4)
bitmap(file='pic1.png')
racf <- acf(x, par1, main='Autocorrelation', xlab='time lag', ylab='ACF', ci.type=par6, ci=par7, sub=paste('(lambda=',par2,', d=',par3,', D=',par4,', CI=', par7, ', CI type=',par6,')',sep=''))
dev.off()
bitmap(file='pic2.png')
rpacf <- pacf(x,par1,main='Partial Autocorrelation',xlab='lags',ylab='PACF')
dev.off()
(myacf <- c(racf$acf))
(mypacf <- c(rpacf$acf))
lengthx <- length(x)
sqrtn <- sqrt(lengthx)
load(file='createtable')
a<-table.start()
a<-table.row.start(a)
a<-table.element(a,'Autocorrelation Function',4,TRUE)
a<-table.row.end(a)
a<-table.row.start(a)
a<-table.element(a,'Time lag k',header=TRUE)
a<-table.element(a,hyperlink('basics.htm','ACF(k)','click here for more information about the Autocorrelation Function'),header=TRUE)
a<-table.element(a,'T-STAT',header=TRUE)
a<-table.element(a,'P-value',header=TRUE)
a<-table.row.end(a)
for (i in 2:(par1+1)) {
a<-table.row.start(a)
a<-table.element(a,i-1,header=TRUE)
a<-table.element(a,round(myacf[i],6))
mytstat <- myacf[i]*sqrtn
a<-table.element(a,round(mytstat,4))
a<-table.element(a,round(1-pt(abs(mytstat),lengthx),6))
a<-table.row.end(a)
}
a<-table.end(a)
table.save(a,file='mytable.tab')
a<-table.start()
a<-table.row.start(a)
a<-table.element(a,'Partial Autocorrelation Function',4,TRUE)
a<-table.row.end(a)
a<-table.row.start(a)
a<-table.element(a,'Time lag k',header=TRUE)
a<-table.element(a,hyperlink('basics.htm','PACF(k)','click here for more information about the Partial Autocorrelation Function'),header=TRUE)
a<-table.element(a,'T-STAT',header=TRUE)
a<-table.element(a,'P-value',header=TRUE)
a<-table.row.end(a)
for (i in 1:par1) {
a<-table.row.start(a)
a<-table.element(a,i,header=TRUE)
a<-table.element(a,round(mypacf[i],6))
mytstat <- mypacf[i]*sqrtn
a<-table.element(a,round(mytstat,4))
a<-table.element(a,round(1-pt(abs(mytstat),lengthx),6))
a<-table.row.end(a)
}
a<-table.end(a)
table.save(a,file='mytable1.tab')