Free Statistics

of Irreproducible Research!

Author's title

Author*The author of this computation has been verified*
R Software Modulerwasp_percentiles.wasp
Title produced by softwarePercentiles
Date of computationFri, 10 Dec 2010 12:26:14 +0000
Cite this page as followsStatistical Computations at FreeStatistics.org, Office for Research Development and Education, URL https://freestatistics.org/blog/index.php?v=date/2010/Dec/10/t1291983875ltz9fhq8sdb1pkr.htm/, Retrieved Mon, 29 Apr 2024 13:27:50 +0000
Statistical Computations at FreeStatistics.org, Office for Research Development and Education, URL https://freestatistics.org/blog/index.php?pk=107602, Retrieved Mon, 29 Apr 2024 13:27:50 +0000
QR Codes:

Original text written by user:
IsPrivate?No (this computation is public)
User-defined keywords
Estimated Impact104
Family? (F = Feedback message, R = changed R code, M = changed R Module, P = changed Parameters, D = changed Data)
F     [Percentiles] [Percentiles of ti...] [2010-09-25 09:52:29] [b98453cac15ba1066b407e146608df68]
- R  D    [Percentiles] [Percentielen - Pr...] [2010-12-10 12:26:14] [934c3727858e074bf543f25f5906ed72] [Current]
Feedback Forum

Post a new message
Dataseries X:
351.1
418.38
448.61
556.42
561.9
654.87
686.7
608.39
537.55
546.21
564.24
443.23
417.53
434.47
474.39
528.79
520.09
559.05
527.45
527.25
528.42
473.7
474.99
433.88
424.6
406.73
419.62
451.19
470.14
439.75
515.5
571.51
547.13
493.47
414.98
352.94
361.63
394.7
408.36
443.83
448.75
457.59
542.93
506.8
499.06
433
428.24
383.92
417.37
403.97
439.64
447.14
444.25
484.44
460.27
492.36
471.85
517.99
340.37
339.07


Summary of computational transaction
Raw Inputview raw input (R code)
Raw Outputview raw output of R engine
Computing time2 seconds
R Server'George Udny Yule' @ 72.249.76.132

\begin{tabular}{lllllllll}
\hline
Summary of computational transaction \tabularnewline
Raw Input & view raw input (R code)  \tabularnewline
Raw Output & view raw output of R engine  \tabularnewline
Computing time & 2 seconds \tabularnewline
R Server & 'George Udny Yule' @ 72.249.76.132 \tabularnewline
\hline
\end{tabular}
%Source: https://freestatistics.org/blog/index.php?pk=107602&T=0

[TABLE]
[ROW][C]Summary of computational transaction[/C][/ROW]
[ROW][C]Raw Input[/C][C]view raw input (R code) [/C][/ROW]
[ROW][C]Raw Output[/C][C]view raw output of R engine [/C][/ROW]
[ROW][C]Computing time[/C][C]2 seconds[/C][/ROW]
[ROW][C]R Server[/C][C]'George Udny Yule' @ 72.249.76.132[/C][/ROW]
[/TABLE]
Source: https://freestatistics.org/blog/index.php?pk=107602&T=0

Globally Unique Identifier (entire table): ba.freestatistics.org/blog/index.php?pk=107602&T=0

As an alternative you can also use a QR Code:  

The GUIDs for individual cells are displayed in the table below:

Summary of computational transaction
Raw Inputview raw input (R code)
Raw Outputview raw output of R engine
Computing time2 seconds
R Server'George Udny Yule' @ 72.249.76.132


Percentiles - Ungrouped Data
pWeighted Average at XnpWeighted Average at X(n+1)pEmpirical Distribution FunctionEmpirical Distribution Function - AveragingEmpirical Distribution Function - InterpolationClosest ObservationTrue Basic - Statistics Graphics ToolkitMS Excel (old versions)
0.02339.33339.356340.37340.37342.3014339.07340.084339.07
0.04344.662345.0912351.1351.1351.7624340.37346.3788340.37
0.06352.204352.3144352.94352.94357.6326352.94351.7256352.94
0.08359.892360.5872361.63361.63377.6788361.63353.9828361.63
0.1383.92384.998383.92389.31393.622383.92393.622383.92
0.12396.554397.6664403.97403.97404.1908394.7401.0036394.7
0.14405.074405.4604406.73406.73407.1538403.97405.2396406.73
0.16407.708407.9688408.36408.36411.2728408.36407.1212408.36
0.18413.656414.8476414.98414.98416.4618414.98408.4924414.98
0.2417.37417.402417.37417.45417.498417.37417.498417.37
0.22417.7417.887418.38418.38418.363417.53418.023417.53
0.24418.876419.1736419.62419.62420.4168418.38418.8264419.62
0.26422.608423.9028424.6424.6425.8376424.6420.3172424.6
0.28427.512428.6208428.24428.24430.7152428.24432.6192428.24
0.3433433.264433433.44433.616433433.616433
0.32433.998434.1868434.47434.47434.3992433.88434.1632434.47
0.34436.538438.2958439.64439.64439.6466434.47435.8142439.64
0.36439.706439.7456439.75439.75440.5852439.75439.6444439.75
0.38442.534443.338443.23443.23443.482443.23443.722443.23
0.4443.83443.998443.83444.04444.082443.83444.082443.83
0.42444.828446.0418447.14447.14446.5042444.25445.3482447.14
0.44447.728448.3748448.61448.61448.5512447.14447.3752448.61
0.46448.694448.8964448.75448.75449.0916448.75451.0436448.75
0.48450.702452.982451.19451.19453.238451.19455.798451.19
0.5457.59458.93457.59458.93458.93457.59458.93458.93
0.52462.244467.3764470.14470.14466.9816460.27463.0336470.14
0.54470.824471.7474471.85471.85471.6106470.14470.2426471.85
0.56472.96473.8104473.7473.7473.7276473.7474.2796473.7
0.58474.252474.618474.39474.39474.522474.39474.762474.39
0.6474.99480.66474.99479.715478.77474.99478.77484.44
0.62486.024490.9344492.36492.36489.0336484.44485.8656492.36
0.64492.804493.6936493.47493.47493.2036492.36498.8364493.47
0.66496.824501.0724499.06499.06498.7246499.06504.7876499.06
0.68505.252510.976506.8506.8507.844506.8511.324506.8
0.7515.5517.243515.5516.745516.247515.5516.247517.99
0.72518.41519.922520.09520.09518.998517.99518.158520.09
0.74522.954527.278527.25527.25524.8156520.09527.422527.25
0.76527.37527.7992527.45527.45527.418527.45528.0708527.45
0.78528.226528.6346528.42528.42528.4274528.42528.5754528.79
0.8528.79535.798528.79533.17530.542528.79530.542537.55
0.82538.626542.9956542.93542.93539.5944537.55546.1444542.93
0.84544.242546.4308546.21546.21544.7668542.93546.9092546.21
0.86546.762551.4034547.13547.13546.8908547.13552.1466547.13
0.88554.562558.2084556.42556.42555.6768556.42557.2616559.05
0.9559.05561.615559.05560.475559.335559.05559.335561.9
0.92562.368565.1124564.24564.24562.5552561.9570.6376564.24
0.94567.148584.0492571.51571.51567.5842564.24595.8508571.51
0.96593.638634.4188608.39608.39595.1132608.39628.8412654.87
0.98645.574679.6974654.87654.87646.5036654.87661.8726686.7

\begin{tabular}{lllllllll}
\hline
Percentiles - Ungrouped Data \tabularnewline
p & Weighted Average at Xnp & Weighted Average at X(n+1)p & Empirical Distribution Function & Empirical Distribution Function - Averaging & Empirical Distribution Function - Interpolation & Closest Observation & True Basic - Statistics Graphics Toolkit & MS Excel (old versions) \tabularnewline
0.02 & 339.33 & 339.356 & 340.37 & 340.37 & 342.3014 & 339.07 & 340.084 & 339.07 \tabularnewline
0.04 & 344.662 & 345.0912 & 351.1 & 351.1 & 351.7624 & 340.37 & 346.3788 & 340.37 \tabularnewline
0.06 & 352.204 & 352.3144 & 352.94 & 352.94 & 357.6326 & 352.94 & 351.7256 & 352.94 \tabularnewline
0.08 & 359.892 & 360.5872 & 361.63 & 361.63 & 377.6788 & 361.63 & 353.9828 & 361.63 \tabularnewline
0.1 & 383.92 & 384.998 & 383.92 & 389.31 & 393.622 & 383.92 & 393.622 & 383.92 \tabularnewline
0.12 & 396.554 & 397.6664 & 403.97 & 403.97 & 404.1908 & 394.7 & 401.0036 & 394.7 \tabularnewline
0.14 & 405.074 & 405.4604 & 406.73 & 406.73 & 407.1538 & 403.97 & 405.2396 & 406.73 \tabularnewline
0.16 & 407.708 & 407.9688 & 408.36 & 408.36 & 411.2728 & 408.36 & 407.1212 & 408.36 \tabularnewline
0.18 & 413.656 & 414.8476 & 414.98 & 414.98 & 416.4618 & 414.98 & 408.4924 & 414.98 \tabularnewline
0.2 & 417.37 & 417.402 & 417.37 & 417.45 & 417.498 & 417.37 & 417.498 & 417.37 \tabularnewline
0.22 & 417.7 & 417.887 & 418.38 & 418.38 & 418.363 & 417.53 & 418.023 & 417.53 \tabularnewline
0.24 & 418.876 & 419.1736 & 419.62 & 419.62 & 420.4168 & 418.38 & 418.8264 & 419.62 \tabularnewline
0.26 & 422.608 & 423.9028 & 424.6 & 424.6 & 425.8376 & 424.6 & 420.3172 & 424.6 \tabularnewline
0.28 & 427.512 & 428.6208 & 428.24 & 428.24 & 430.7152 & 428.24 & 432.6192 & 428.24 \tabularnewline
0.3 & 433 & 433.264 & 433 & 433.44 & 433.616 & 433 & 433.616 & 433 \tabularnewline
0.32 & 433.998 & 434.1868 & 434.47 & 434.47 & 434.3992 & 433.88 & 434.1632 & 434.47 \tabularnewline
0.34 & 436.538 & 438.2958 & 439.64 & 439.64 & 439.6466 & 434.47 & 435.8142 & 439.64 \tabularnewline
0.36 & 439.706 & 439.7456 & 439.75 & 439.75 & 440.5852 & 439.75 & 439.6444 & 439.75 \tabularnewline
0.38 & 442.534 & 443.338 & 443.23 & 443.23 & 443.482 & 443.23 & 443.722 & 443.23 \tabularnewline
0.4 & 443.83 & 443.998 & 443.83 & 444.04 & 444.082 & 443.83 & 444.082 & 443.83 \tabularnewline
0.42 & 444.828 & 446.0418 & 447.14 & 447.14 & 446.5042 & 444.25 & 445.3482 & 447.14 \tabularnewline
0.44 & 447.728 & 448.3748 & 448.61 & 448.61 & 448.5512 & 447.14 & 447.3752 & 448.61 \tabularnewline
0.46 & 448.694 & 448.8964 & 448.75 & 448.75 & 449.0916 & 448.75 & 451.0436 & 448.75 \tabularnewline
0.48 & 450.702 & 452.982 & 451.19 & 451.19 & 453.238 & 451.19 & 455.798 & 451.19 \tabularnewline
0.5 & 457.59 & 458.93 & 457.59 & 458.93 & 458.93 & 457.59 & 458.93 & 458.93 \tabularnewline
0.52 & 462.244 & 467.3764 & 470.14 & 470.14 & 466.9816 & 460.27 & 463.0336 & 470.14 \tabularnewline
0.54 & 470.824 & 471.7474 & 471.85 & 471.85 & 471.6106 & 470.14 & 470.2426 & 471.85 \tabularnewline
0.56 & 472.96 & 473.8104 & 473.7 & 473.7 & 473.7276 & 473.7 & 474.2796 & 473.7 \tabularnewline
0.58 & 474.252 & 474.618 & 474.39 & 474.39 & 474.522 & 474.39 & 474.762 & 474.39 \tabularnewline
0.6 & 474.99 & 480.66 & 474.99 & 479.715 & 478.77 & 474.99 & 478.77 & 484.44 \tabularnewline
0.62 & 486.024 & 490.9344 & 492.36 & 492.36 & 489.0336 & 484.44 & 485.8656 & 492.36 \tabularnewline
0.64 & 492.804 & 493.6936 & 493.47 & 493.47 & 493.2036 & 492.36 & 498.8364 & 493.47 \tabularnewline
0.66 & 496.824 & 501.0724 & 499.06 & 499.06 & 498.7246 & 499.06 & 504.7876 & 499.06 \tabularnewline
0.68 & 505.252 & 510.976 & 506.8 & 506.8 & 507.844 & 506.8 & 511.324 & 506.8 \tabularnewline
0.7 & 515.5 & 517.243 & 515.5 & 516.745 & 516.247 & 515.5 & 516.247 & 517.99 \tabularnewline
0.72 & 518.41 & 519.922 & 520.09 & 520.09 & 518.998 & 517.99 & 518.158 & 520.09 \tabularnewline
0.74 & 522.954 & 527.278 & 527.25 & 527.25 & 524.8156 & 520.09 & 527.422 & 527.25 \tabularnewline
0.76 & 527.37 & 527.7992 & 527.45 & 527.45 & 527.418 & 527.45 & 528.0708 & 527.45 \tabularnewline
0.78 & 528.226 & 528.6346 & 528.42 & 528.42 & 528.4274 & 528.42 & 528.5754 & 528.79 \tabularnewline
0.8 & 528.79 & 535.798 & 528.79 & 533.17 & 530.542 & 528.79 & 530.542 & 537.55 \tabularnewline
0.82 & 538.626 & 542.9956 & 542.93 & 542.93 & 539.5944 & 537.55 & 546.1444 & 542.93 \tabularnewline
0.84 & 544.242 & 546.4308 & 546.21 & 546.21 & 544.7668 & 542.93 & 546.9092 & 546.21 \tabularnewline
0.86 & 546.762 & 551.4034 & 547.13 & 547.13 & 546.8908 & 547.13 & 552.1466 & 547.13 \tabularnewline
0.88 & 554.562 & 558.2084 & 556.42 & 556.42 & 555.6768 & 556.42 & 557.2616 & 559.05 \tabularnewline
0.9 & 559.05 & 561.615 & 559.05 & 560.475 & 559.335 & 559.05 & 559.335 & 561.9 \tabularnewline
0.92 & 562.368 & 565.1124 & 564.24 & 564.24 & 562.5552 & 561.9 & 570.6376 & 564.24 \tabularnewline
0.94 & 567.148 & 584.0492 & 571.51 & 571.51 & 567.5842 & 564.24 & 595.8508 & 571.51 \tabularnewline
0.96 & 593.638 & 634.4188 & 608.39 & 608.39 & 595.1132 & 608.39 & 628.8412 & 654.87 \tabularnewline
0.98 & 645.574 & 679.6974 & 654.87 & 654.87 & 646.5036 & 654.87 & 661.8726 & 686.7 \tabularnewline
\hline
\end{tabular}
%Source: https://freestatistics.org/blog/index.php?pk=107602&T=1

[TABLE]
[ROW][C]Percentiles - Ungrouped Data[/C][/ROW]
[ROW][C]p[/C][C]Weighted Average at Xnp[/C][C]Weighted Average at X(n+1)p[/C][C]Empirical Distribution Function[/C][C]Empirical Distribution Function - Averaging[/C][C]Empirical Distribution Function - Interpolation[/C][C]Closest Observation[/C][C]True Basic - Statistics Graphics Toolkit[/C][C]MS Excel (old versions)[/C][/ROW]
[ROW][C]0.02[/C][C]339.33[/C][C]339.356[/C][C]340.37[/C][C]340.37[/C][C]342.3014[/C][C]339.07[/C][C]340.084[/C][C]339.07[/C][/ROW]
[ROW][C]0.04[/C][C]344.662[/C][C]345.0912[/C][C]351.1[/C][C]351.1[/C][C]351.7624[/C][C]340.37[/C][C]346.3788[/C][C]340.37[/C][/ROW]
[ROW][C]0.06[/C][C]352.204[/C][C]352.3144[/C][C]352.94[/C][C]352.94[/C][C]357.6326[/C][C]352.94[/C][C]351.7256[/C][C]352.94[/C][/ROW]
[ROW][C]0.08[/C][C]359.892[/C][C]360.5872[/C][C]361.63[/C][C]361.63[/C][C]377.6788[/C][C]361.63[/C][C]353.9828[/C][C]361.63[/C][/ROW]
[ROW][C]0.1[/C][C]383.92[/C][C]384.998[/C][C]383.92[/C][C]389.31[/C][C]393.622[/C][C]383.92[/C][C]393.622[/C][C]383.92[/C][/ROW]
[ROW][C]0.12[/C][C]396.554[/C][C]397.6664[/C][C]403.97[/C][C]403.97[/C][C]404.1908[/C][C]394.7[/C][C]401.0036[/C][C]394.7[/C][/ROW]
[ROW][C]0.14[/C][C]405.074[/C][C]405.4604[/C][C]406.73[/C][C]406.73[/C][C]407.1538[/C][C]403.97[/C][C]405.2396[/C][C]406.73[/C][/ROW]
[ROW][C]0.16[/C][C]407.708[/C][C]407.9688[/C][C]408.36[/C][C]408.36[/C][C]411.2728[/C][C]408.36[/C][C]407.1212[/C][C]408.36[/C][/ROW]
[ROW][C]0.18[/C][C]413.656[/C][C]414.8476[/C][C]414.98[/C][C]414.98[/C][C]416.4618[/C][C]414.98[/C][C]408.4924[/C][C]414.98[/C][/ROW]
[ROW][C]0.2[/C][C]417.37[/C][C]417.402[/C][C]417.37[/C][C]417.45[/C][C]417.498[/C][C]417.37[/C][C]417.498[/C][C]417.37[/C][/ROW]
[ROW][C]0.22[/C][C]417.7[/C][C]417.887[/C][C]418.38[/C][C]418.38[/C][C]418.363[/C][C]417.53[/C][C]418.023[/C][C]417.53[/C][/ROW]
[ROW][C]0.24[/C][C]418.876[/C][C]419.1736[/C][C]419.62[/C][C]419.62[/C][C]420.4168[/C][C]418.38[/C][C]418.8264[/C][C]419.62[/C][/ROW]
[ROW][C]0.26[/C][C]422.608[/C][C]423.9028[/C][C]424.6[/C][C]424.6[/C][C]425.8376[/C][C]424.6[/C][C]420.3172[/C][C]424.6[/C][/ROW]
[ROW][C]0.28[/C][C]427.512[/C][C]428.6208[/C][C]428.24[/C][C]428.24[/C][C]430.7152[/C][C]428.24[/C][C]432.6192[/C][C]428.24[/C][/ROW]
[ROW][C]0.3[/C][C]433[/C][C]433.264[/C][C]433[/C][C]433.44[/C][C]433.616[/C][C]433[/C][C]433.616[/C][C]433[/C][/ROW]
[ROW][C]0.32[/C][C]433.998[/C][C]434.1868[/C][C]434.47[/C][C]434.47[/C][C]434.3992[/C][C]433.88[/C][C]434.1632[/C][C]434.47[/C][/ROW]
[ROW][C]0.34[/C][C]436.538[/C][C]438.2958[/C][C]439.64[/C][C]439.64[/C][C]439.6466[/C][C]434.47[/C][C]435.8142[/C][C]439.64[/C][/ROW]
[ROW][C]0.36[/C][C]439.706[/C][C]439.7456[/C][C]439.75[/C][C]439.75[/C][C]440.5852[/C][C]439.75[/C][C]439.6444[/C][C]439.75[/C][/ROW]
[ROW][C]0.38[/C][C]442.534[/C][C]443.338[/C][C]443.23[/C][C]443.23[/C][C]443.482[/C][C]443.23[/C][C]443.722[/C][C]443.23[/C][/ROW]
[ROW][C]0.4[/C][C]443.83[/C][C]443.998[/C][C]443.83[/C][C]444.04[/C][C]444.082[/C][C]443.83[/C][C]444.082[/C][C]443.83[/C][/ROW]
[ROW][C]0.42[/C][C]444.828[/C][C]446.0418[/C][C]447.14[/C][C]447.14[/C][C]446.5042[/C][C]444.25[/C][C]445.3482[/C][C]447.14[/C][/ROW]
[ROW][C]0.44[/C][C]447.728[/C][C]448.3748[/C][C]448.61[/C][C]448.61[/C][C]448.5512[/C][C]447.14[/C][C]447.3752[/C][C]448.61[/C][/ROW]
[ROW][C]0.46[/C][C]448.694[/C][C]448.8964[/C][C]448.75[/C][C]448.75[/C][C]449.0916[/C][C]448.75[/C][C]451.0436[/C][C]448.75[/C][/ROW]
[ROW][C]0.48[/C][C]450.702[/C][C]452.982[/C][C]451.19[/C][C]451.19[/C][C]453.238[/C][C]451.19[/C][C]455.798[/C][C]451.19[/C][/ROW]
[ROW][C]0.5[/C][C]457.59[/C][C]458.93[/C][C]457.59[/C][C]458.93[/C][C]458.93[/C][C]457.59[/C][C]458.93[/C][C]458.93[/C][/ROW]
[ROW][C]0.52[/C][C]462.244[/C][C]467.3764[/C][C]470.14[/C][C]470.14[/C][C]466.9816[/C][C]460.27[/C][C]463.0336[/C][C]470.14[/C][/ROW]
[ROW][C]0.54[/C][C]470.824[/C][C]471.7474[/C][C]471.85[/C][C]471.85[/C][C]471.6106[/C][C]470.14[/C][C]470.2426[/C][C]471.85[/C][/ROW]
[ROW][C]0.56[/C][C]472.96[/C][C]473.8104[/C][C]473.7[/C][C]473.7[/C][C]473.7276[/C][C]473.7[/C][C]474.2796[/C][C]473.7[/C][/ROW]
[ROW][C]0.58[/C][C]474.252[/C][C]474.618[/C][C]474.39[/C][C]474.39[/C][C]474.522[/C][C]474.39[/C][C]474.762[/C][C]474.39[/C][/ROW]
[ROW][C]0.6[/C][C]474.99[/C][C]480.66[/C][C]474.99[/C][C]479.715[/C][C]478.77[/C][C]474.99[/C][C]478.77[/C][C]484.44[/C][/ROW]
[ROW][C]0.62[/C][C]486.024[/C][C]490.9344[/C][C]492.36[/C][C]492.36[/C][C]489.0336[/C][C]484.44[/C][C]485.8656[/C][C]492.36[/C][/ROW]
[ROW][C]0.64[/C][C]492.804[/C][C]493.6936[/C][C]493.47[/C][C]493.47[/C][C]493.2036[/C][C]492.36[/C][C]498.8364[/C][C]493.47[/C][/ROW]
[ROW][C]0.66[/C][C]496.824[/C][C]501.0724[/C][C]499.06[/C][C]499.06[/C][C]498.7246[/C][C]499.06[/C][C]504.7876[/C][C]499.06[/C][/ROW]
[ROW][C]0.68[/C][C]505.252[/C][C]510.976[/C][C]506.8[/C][C]506.8[/C][C]507.844[/C][C]506.8[/C][C]511.324[/C][C]506.8[/C][/ROW]
[ROW][C]0.7[/C][C]515.5[/C][C]517.243[/C][C]515.5[/C][C]516.745[/C][C]516.247[/C][C]515.5[/C][C]516.247[/C][C]517.99[/C][/ROW]
[ROW][C]0.72[/C][C]518.41[/C][C]519.922[/C][C]520.09[/C][C]520.09[/C][C]518.998[/C][C]517.99[/C][C]518.158[/C][C]520.09[/C][/ROW]
[ROW][C]0.74[/C][C]522.954[/C][C]527.278[/C][C]527.25[/C][C]527.25[/C][C]524.8156[/C][C]520.09[/C][C]527.422[/C][C]527.25[/C][/ROW]
[ROW][C]0.76[/C][C]527.37[/C][C]527.7992[/C][C]527.45[/C][C]527.45[/C][C]527.418[/C][C]527.45[/C][C]528.0708[/C][C]527.45[/C][/ROW]
[ROW][C]0.78[/C][C]528.226[/C][C]528.6346[/C][C]528.42[/C][C]528.42[/C][C]528.4274[/C][C]528.42[/C][C]528.5754[/C][C]528.79[/C][/ROW]
[ROW][C]0.8[/C][C]528.79[/C][C]535.798[/C][C]528.79[/C][C]533.17[/C][C]530.542[/C][C]528.79[/C][C]530.542[/C][C]537.55[/C][/ROW]
[ROW][C]0.82[/C][C]538.626[/C][C]542.9956[/C][C]542.93[/C][C]542.93[/C][C]539.5944[/C][C]537.55[/C][C]546.1444[/C][C]542.93[/C][/ROW]
[ROW][C]0.84[/C][C]544.242[/C][C]546.4308[/C][C]546.21[/C][C]546.21[/C][C]544.7668[/C][C]542.93[/C][C]546.9092[/C][C]546.21[/C][/ROW]
[ROW][C]0.86[/C][C]546.762[/C][C]551.4034[/C][C]547.13[/C][C]547.13[/C][C]546.8908[/C][C]547.13[/C][C]552.1466[/C][C]547.13[/C][/ROW]
[ROW][C]0.88[/C][C]554.562[/C][C]558.2084[/C][C]556.42[/C][C]556.42[/C][C]555.6768[/C][C]556.42[/C][C]557.2616[/C][C]559.05[/C][/ROW]
[ROW][C]0.9[/C][C]559.05[/C][C]561.615[/C][C]559.05[/C][C]560.475[/C][C]559.335[/C][C]559.05[/C][C]559.335[/C][C]561.9[/C][/ROW]
[ROW][C]0.92[/C][C]562.368[/C][C]565.1124[/C][C]564.24[/C][C]564.24[/C][C]562.5552[/C][C]561.9[/C][C]570.6376[/C][C]564.24[/C][/ROW]
[ROW][C]0.94[/C][C]567.148[/C][C]584.0492[/C][C]571.51[/C][C]571.51[/C][C]567.5842[/C][C]564.24[/C][C]595.8508[/C][C]571.51[/C][/ROW]
[ROW][C]0.96[/C][C]593.638[/C][C]634.4188[/C][C]608.39[/C][C]608.39[/C][C]595.1132[/C][C]608.39[/C][C]628.8412[/C][C]654.87[/C][/ROW]
[ROW][C]0.98[/C][C]645.574[/C][C]679.6974[/C][C]654.87[/C][C]654.87[/C][C]646.5036[/C][C]654.87[/C][C]661.8726[/C][C]686.7[/C][/ROW]
[/TABLE]
Source: https://freestatistics.org/blog/index.php?pk=107602&T=1

Globally Unique Identifier (entire table): ba.freestatistics.org/blog/index.php?pk=107602&T=1

As an alternative you can also use a QR Code:  

The GUIDs for individual cells are displayed in the table below:

Percentiles - Ungrouped Data
pWeighted Average at XnpWeighted Average at X(n+1)pEmpirical Distribution FunctionEmpirical Distribution Function - AveragingEmpirical Distribution Function - InterpolationClosest ObservationTrue Basic - Statistics Graphics ToolkitMS Excel (old versions)
0.02339.33339.356340.37340.37342.3014339.07340.084339.07
0.04344.662345.0912351.1351.1351.7624340.37346.3788340.37
0.06352.204352.3144352.94352.94357.6326352.94351.7256352.94
0.08359.892360.5872361.63361.63377.6788361.63353.9828361.63
0.1383.92384.998383.92389.31393.622383.92393.622383.92
0.12396.554397.6664403.97403.97404.1908394.7401.0036394.7
0.14405.074405.4604406.73406.73407.1538403.97405.2396406.73
0.16407.708407.9688408.36408.36411.2728408.36407.1212408.36
0.18413.656414.8476414.98414.98416.4618414.98408.4924414.98
0.2417.37417.402417.37417.45417.498417.37417.498417.37
0.22417.7417.887418.38418.38418.363417.53418.023417.53
0.24418.876419.1736419.62419.62420.4168418.38418.8264419.62
0.26422.608423.9028424.6424.6425.8376424.6420.3172424.6
0.28427.512428.6208428.24428.24430.7152428.24432.6192428.24
0.3433433.264433433.44433.616433433.616433
0.32433.998434.1868434.47434.47434.3992433.88434.1632434.47
0.34436.538438.2958439.64439.64439.6466434.47435.8142439.64
0.36439.706439.7456439.75439.75440.5852439.75439.6444439.75
0.38442.534443.338443.23443.23443.482443.23443.722443.23
0.4443.83443.998443.83444.04444.082443.83444.082443.83
0.42444.828446.0418447.14447.14446.5042444.25445.3482447.14
0.44447.728448.3748448.61448.61448.5512447.14447.3752448.61
0.46448.694448.8964448.75448.75449.0916448.75451.0436448.75
0.48450.702452.982451.19451.19453.238451.19455.798451.19
0.5457.59458.93457.59458.93458.93457.59458.93458.93
0.52462.244467.3764470.14470.14466.9816460.27463.0336470.14
0.54470.824471.7474471.85471.85471.6106470.14470.2426471.85
0.56472.96473.8104473.7473.7473.7276473.7474.2796473.7
0.58474.252474.618474.39474.39474.522474.39474.762474.39
0.6474.99480.66474.99479.715478.77474.99478.77484.44
0.62486.024490.9344492.36492.36489.0336484.44485.8656492.36
0.64492.804493.6936493.47493.47493.2036492.36498.8364493.47
0.66496.824501.0724499.06499.06498.7246499.06504.7876499.06
0.68505.252510.976506.8506.8507.844506.8511.324506.8
0.7515.5517.243515.5516.745516.247515.5516.247517.99
0.72518.41519.922520.09520.09518.998517.99518.158520.09
0.74522.954527.278527.25527.25524.8156520.09527.422527.25
0.76527.37527.7992527.45527.45527.418527.45528.0708527.45
0.78528.226528.6346528.42528.42528.4274528.42528.5754528.79
0.8528.79535.798528.79533.17530.542528.79530.542537.55
0.82538.626542.9956542.93542.93539.5944537.55546.1444542.93
0.84544.242546.4308546.21546.21544.7668542.93546.9092546.21
0.86546.762551.4034547.13547.13546.8908547.13552.1466547.13
0.88554.562558.2084556.42556.42555.6768556.42557.2616559.05
0.9559.05561.615559.05560.475559.335559.05559.335561.9
0.92562.368565.1124564.24564.24562.5552561.9570.6376564.24
0.94567.148584.0492571.51571.51567.5842564.24595.8508571.51
0.96593.638634.4188608.39608.39595.1132608.39628.8412654.87
0.98645.574679.6974654.87654.87646.5036654.87661.8726686.7


Parameters (Session):
Parameters (R input):
R code (references can be found in the software module):
x <-sort(x[!is.na(x)])
q1 <- function(data,n,p,i,f) {
np <- n*p;
i <<- floor(np)
f <<- np - i
qvalue <- (1-f)*data[i] + f*data[i+1]
}
q2 <- function(data,n,p,i,f) {
np <- (n+1)*p
i <<- floor(np)
f <<- np - i
qvalue <- (1-f)*data[i] + f*data[i+1]
}
q3 <- function(data,n,p,i,f) {
np <- n*p
i <<- floor(np)
f <<- np - i
if (f==0) {
qvalue <- data[i]
} else {
qvalue <- data[i+1]
}
}
q4 <- function(data,n,p,i,f) {
np <- n*p
i <<- floor(np)
f <<- np - i
if (f==0) {
qvalue <- (data[i]+data[i+1])/2
} else {
qvalue <- data[i+1]
}
}
q5 <- function(data,n,p,i,f) {
np <- (n-1)*p
i <<- floor(np)
f <<- np - i
if (f==0) {
qvalue <- data[i+1]
} else {
qvalue <- data[i+1] + f*(data[i+2]-data[i+1])
}
}
q6 <- function(data,n,p,i,f) {
np <- n*p+0.5
i <<- floor(np)
f <<- np - i
qvalue <- data[i]
}
q7 <- function(data,n,p,i,f) {
np <- (n+1)*p
i <<- floor(np)
f <<- np - i
if (f==0) {
qvalue <- data[i]
} else {
qvalue <- f*data[i] + (1-f)*data[i+1]
}
}
q8 <- function(data,n,p,i,f) {
np <- (n+1)*p
i <<- floor(np)
f <<- np - i
if (f==0) {
qvalue <- data[i]
} else {
if (f == 0.5) {
qvalue <- (data[i]+data[i+1])/2
} else {
if (f < 0.5) {
qvalue <- data[i]
} else {
qvalue <- data[i+1]
}
}
}
}
lx <- length(x)
qval <- array(NA,dim=c(99,8))
mystep <- 25
mystart <- 25
if (lx>10){
mystep=10
mystart=10
}
if (lx>20){
mystep=5
mystart=5
}
if (lx>50){
mystep=2
mystart=2
}
if (lx>=100){
mystep=1
mystart=1
}
for (perc in seq(mystart,99,mystep)) {
qval[perc,1] <- q1(x,lx,perc/100,i,f)
qval[perc,2] <- q2(x,lx,perc/100,i,f)
qval[perc,3] <- q3(x,lx,perc/100,i,f)
qval[perc,4] <- q4(x,lx,perc/100,i,f)
qval[perc,5] <- q5(x,lx,perc/100,i,f)
qval[perc,6] <- q6(x,lx,perc/100,i,f)
qval[perc,7] <- q7(x,lx,perc/100,i,f)
qval[perc,8] <- q8(x,lx,perc/100,i,f)
}
bitmap(file='test1.png')
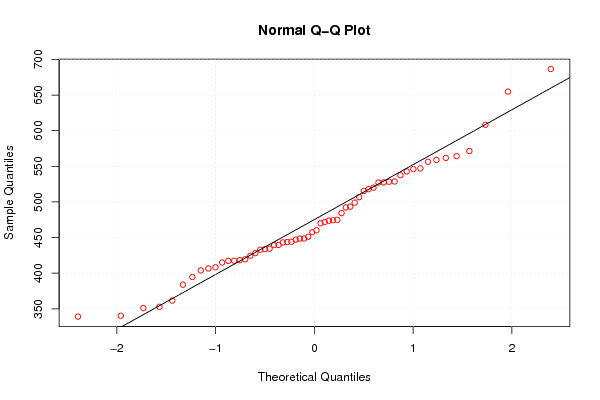
myqqnorm <- qqnorm(x,col=2)
qqline(x)
grid()
dev.off()
load(file='createtable')
a<-table.start()
a<-table.row.start(a)
a<-table.element(a,'Percentiles - Ungrouped Data',9,TRUE)
a<-table.row.end(a)
a<-table.row.start(a)
a<-table.element(a,'p',1,TRUE)
a<-table.element(a,hyperlink('method_1.htm', 'Weighted Average at Xnp',''),1,TRUE)
a<-table.element(a,hyperlink('method_2.htm','Weighted Average at X(n+1)p',''),1,TRUE)
a<-table.element(a,hyperlink('method_3.htm','Empirical Distribution Function',''),1,TRUE)
a<-table.element(a,hyperlink('method_4.htm','Empirical Distribution Function - Averaging',''),1,TRUE)
a<-table.element(a,hyperlink('method_5.htm','Empirical Distribution Function - Interpolation',''),1,TRUE)
a<-table.element(a,hyperlink('method_6.htm','Closest Observation',''),1,TRUE)
a<-table.element(a,hyperlink('method_7.htm','True Basic - Statistics Graphics Toolkit',''),1,TRUE)
a<-table.element(a,hyperlink('method_8.htm','MS Excel (old versions)',''),1,TRUE)
a<-table.row.end(a)
for (perc in seq(mystart,99,mystep)) {
a<-table.row.start(a)
a<-table.element(a,round(perc/100,2),1,TRUE)
for (j in 1:8) {
a<-table.element(a,round(qval[perc,j],6))
}
a<-table.row.end(a)
}
a<-table.end(a)
table.save(a,file='mytable.tab')