Free Statistics

of Irreproducible Research!

Author's title

Author*The author of this computation has been verified*
R Software Modulerwasp_centraltendency.wasp
Title produced by softwareCentral Tendency
Date of computationFri, 10 Dec 2010 12:12:01 +0000
Cite this page as followsStatistical Computations at FreeStatistics.org, Office for Research Development and Education, URL https://freestatistics.org/blog/index.php?v=date/2010/Dec/10/t1291983008oy58vutudwcghyg.htm/, Retrieved Mon, 29 Apr 2024 10:58:05 +0000
Statistical Computations at FreeStatistics.org, Office for Research Development and Education, URL https://freestatistics.org/blog/index.php?pk=107592, Retrieved Mon, 29 Apr 2024 10:58:05 +0000
QR Codes:

Original text written by user:
IsPrivate?No (this computation is public)
User-defined keywords
Estimated Impact128
Family? (F = Feedback message, R = changed R code, M = changed R Module, P = changed Parameters, D = changed Data)
F     [Central Tendency] [Time needed to su...] [2010-09-25 09:42:08] [b98453cac15ba1066b407e146608df68]
- R  D    [Central Tendency] [paper 3.1] [2010-12-10 12:12:01] [5f761c4a622da19727fd2adf71158b48] [Current]
Feedback Forum

Post a new message
Dataseries X:
627
696
825
677
656
785
412
352
839
729
696
641
695
638
762
635
721
854
418
367
824
687
601
676
740
691
683
594
729
731
386
331
707
715
657
653
642
643
718
654
632
731
392
344
792
852
649
629
685
617
715
715
629
916
531
357
917
828
708
858
775
785
1006
789
734
906
532
387
991
841
892
782


Summary of computational transaction
Raw Inputview raw input (R code)
Raw Outputview raw output of R engine
Computing time4 seconds
R Server'George Udny Yule' @ 72.249.76.132

\begin{tabular}{lllllllll}
\hline
Summary of computational transaction \tabularnewline
Raw Input & view raw input (R code)  \tabularnewline
Raw Output & view raw output of R engine  \tabularnewline
Computing time & 4 seconds \tabularnewline
R Server & 'George Udny Yule' @ 72.249.76.132 \tabularnewline
\hline
\end{tabular}
%Source: https://freestatistics.org/blog/index.php?pk=107592&T=0

[TABLE]
[ROW][C]Summary of computational transaction[/C][/ROW]
[ROW][C]Raw Input[/C][C]view raw input (R code) [/C][/ROW]
[ROW][C]Raw Output[/C][C]view raw output of R engine [/C][/ROW]
[ROW][C]Computing time[/C][C]4 seconds[/C][/ROW]
[ROW][C]R Server[/C][C]'George Udny Yule' @ 72.249.76.132[/C][/ROW]
[/TABLE]
Source: https://freestatistics.org/blog/index.php?pk=107592&T=0

Globally Unique Identifier (entire table): ba.freestatistics.org/blog/index.php?pk=107592&T=0

As an alternative you can also use a QR Code:  

The GUIDs for individual cells are displayed in the table below:

Summary of computational transaction
Raw Inputview raw input (R code)
Raw Outputview raw output of R engine
Computing time4 seconds
R Server'George Udny Yule' @ 72.249.76.132


Central Tendency - Ungrouped Data
MeasureValueS.E.Value/S.E.
Arithmetic Mean680.61111111111118.447092170008236.8953060373205
Geometric Mean659.728212263828
Harmonic Mean635.054753946218
Quadratic Mean698.134975806573
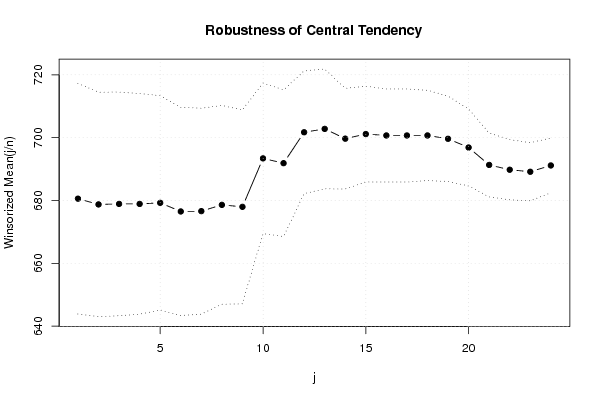
Winsorized Mean ( 1 / 24 )680.58333333333318.348966339489037.0910993426722
Winsorized Mean ( 2 / 24 )678.7517.852834210801738.0191734256585
Winsorized Mean ( 3 / 24 )678.91666666666717.791609630368938.1593729163103
Winsorized Mean ( 4 / 24 )678.91666666666717.548499193482738.6880187975738
Winsorized Mean ( 5 / 24 )679.26388888888917.049362112939.8410148362641
Winsorized Mean ( 6 / 24 )676.51388888888916.560943942382540.8499594734793
Winsorized Mean ( 7 / 24 )676.61111111111116.381952591743641.3022261737052
Winsorized Mean ( 8 / 24 )678.61111111111115.811951903143042.9176053195698
Winsorized Mean ( 9 / 24 )677.98611111111115.425314704935743.952821973491
Winsorized Mean ( 10 / 24 )693.40277777777811.973491517049357.9114936349543
Winsorized Mean ( 11 / 24 )691.87511.662020159555559.3271997933481
Winsorized Mean ( 12 / 24 )701.7083333333339.7586773212084471.9060903682426
Winsorized Mean ( 13 / 24 )702.7916666666679.5331342419048373.720945161708
Winsorized Mean ( 14 / 24 )699.6805555555568.0052757053885287.4024307600781
Winsorized Mean ( 15 / 24 )701.1388888888897.6089968563175692.1460347702405
Winsorized Mean ( 16 / 24 )700.6944444444447.4046267439942794.6292728411682
Winsorized Mean ( 17 / 24 )700.6944444444447.4046267439942794.6292728411682
Winsorized Mean ( 18 / 24 )700.6944444444447.183042729350797.548416575796
Winsorized Mean ( 19 / 24 )699.6388888888896.78478994741171103.118725017536
Winsorized Mean ( 20 / 24 )696.8611111111116.11865287229608113.891264246473
Winsorized Mean ( 21 / 24 )691.3194444444445.0799487073092136.087878889358
Winsorized Mean ( 22 / 24 )689.7916666666674.79427873283095143.878089928942
Winsorized Mean ( 23 / 24 )689.1527777777784.62610895736108148.970286720375
Winsorized Mean ( 24 / 24 )691.1527777777784.34895431652159158.923899281283
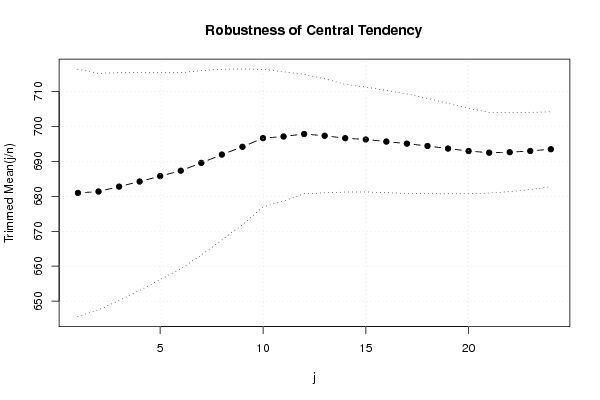
Trimmed Mean ( 1 / 24 )680.95714285714317.689962012094738.4939855942919
Trimmed Mean ( 2 / 24 )681.3529411764716.903625556030640.3080947881852
Trimmed Mean ( 3 / 24 )682.77272727272716.284630239280641.9274320165891
Trimmed Mean ( 4 / 24 )684.2187515.566397544547143.9548551963895
Trimmed Mean ( 5 / 24 )685.75806451612914.787793597909746.3732510178573
Trimmed Mean ( 6 / 24 )687.31666666666714.006727432594649.0704677430386
Trimmed Mean ( 7 / 24 )689.55172413793113.186896381825152.2906758476018
Trimmed Mean ( 8 / 24 )691.92857142857112.207589111325256.6801982863803
Trimmed Mean ( 9 / 24 )694.14814814814811.133344863958262.3485714877391
Trimmed Mean ( 10 / 24 )696.6346153846159.8365997404648470.8206731762062
Trimmed Mean ( 11 / 24 )697.19.2337115274102375.4951026930679
Trimmed Mean ( 12 / 24 )697.81258.538432941767781.7260620021375
Trimmed Mean ( 13 / 24 )697.3043478260878.1503901430116785.5547201533624
Trimmed Mean ( 14 / 24 )696.6136363636367.6994423282506790.4758561289086
Trimmed Mean ( 15 / 24 )696.2380952380957.494388882348792.9012500109147
Trimmed Mean ( 16 / 24 )695.657.30757860910295.1956916527082
Trimmed Mean ( 17 / 24 )695.0526315789477.0994707963397697.9020340413671
Trimmed Mean ( 18 / 24 )694.3888888888896.80782437076188101.998649064911
Trimmed Mean ( 19 / 24 )693.6470588235296.4590969100133107.390718623248
Trimmed Mean ( 20 / 24 )692.93756.08540319588206113.868790233802
Trimmed Mean ( 21 / 24 )692.4666666666675.76767315646845120.059970092110
Trimmed Mean ( 22 / 24 )692.6071428571435.63819628690014122.841970661141
Trimmed Mean ( 23 / 24 )692.9615384615385.512916516755125.697811014455
Trimmed Mean ( 24 / 24 )693.4583333333335.35107302210713129.592388380502
Median695.5
Midrange668.5
Midmean - Weighted Average at Xnp690.947368421053
Midmean - Weighted Average at X(n+1)p694.388888888889
Midmean - Empirical Distribution Function690.947368421053
Midmean - Empirical Distribution Function - Averaging694.388888888889
Midmean - Empirical Distribution Function - Interpolation694.388888888889
Midmean - Closest Observation690.947368421053
Midmean - True Basic - Statistics Graphics Toolkit694.388888888889
Midmean - MS Excel (old versions)695.65
Number of observations72

\begin{tabular}{lllllllll}
\hline
Central Tendency - Ungrouped Data \tabularnewline
Measure & Value & S.E. & Value/S.E. \tabularnewline
Arithmetic Mean & 680.611111111111 & 18.4470921700082 & 36.8953060373205 \tabularnewline
Geometric Mean & 659.728212263828 &  &  \tabularnewline
Harmonic Mean & 635.054753946218 &  &  \tabularnewline
Quadratic Mean & 698.134975806573 &  &  \tabularnewline
Winsorized Mean ( 1 / 24 ) & 680.583333333333 & 18.3489663394890 & 37.0910993426722 \tabularnewline
Winsorized Mean ( 2 / 24 ) & 678.75 & 17.8528342108017 & 38.0191734256585 \tabularnewline
Winsorized Mean ( 3 / 24 ) & 678.916666666667 & 17.7916096303689 & 38.1593729163103 \tabularnewline
Winsorized Mean ( 4 / 24 ) & 678.916666666667 & 17.5484991934827 & 38.6880187975738 \tabularnewline
Winsorized Mean ( 5 / 24 ) & 679.263888888889 & 17.0493621129 & 39.8410148362641 \tabularnewline
Winsorized Mean ( 6 / 24 ) & 676.513888888889 & 16.5609439423825 & 40.8499594734793 \tabularnewline
Winsorized Mean ( 7 / 24 ) & 676.611111111111 & 16.3819525917436 & 41.3022261737052 \tabularnewline
Winsorized Mean ( 8 / 24 ) & 678.611111111111 & 15.8119519031430 & 42.9176053195698 \tabularnewline
Winsorized Mean ( 9 / 24 ) & 677.986111111111 & 15.4253147049357 & 43.952821973491 \tabularnewline
Winsorized Mean ( 10 / 24 ) & 693.402777777778 & 11.9734915170493 & 57.9114936349543 \tabularnewline
Winsorized Mean ( 11 / 24 ) & 691.875 & 11.6620201595555 & 59.3271997933481 \tabularnewline
Winsorized Mean ( 12 / 24 ) & 701.708333333333 & 9.75867732120844 & 71.9060903682426 \tabularnewline
Winsorized Mean ( 13 / 24 ) & 702.791666666667 & 9.53313424190483 & 73.720945161708 \tabularnewline
Winsorized Mean ( 14 / 24 ) & 699.680555555556 & 8.00527570538852 & 87.4024307600781 \tabularnewline
Winsorized Mean ( 15 / 24 ) & 701.138888888889 & 7.60899685631756 & 92.1460347702405 \tabularnewline
Winsorized Mean ( 16 / 24 ) & 700.694444444444 & 7.40462674399427 & 94.6292728411682 \tabularnewline
Winsorized Mean ( 17 / 24 ) & 700.694444444444 & 7.40462674399427 & 94.6292728411682 \tabularnewline
Winsorized Mean ( 18 / 24 ) & 700.694444444444 & 7.1830427293507 & 97.548416575796 \tabularnewline
Winsorized Mean ( 19 / 24 ) & 699.638888888889 & 6.78478994741171 & 103.118725017536 \tabularnewline
Winsorized Mean ( 20 / 24 ) & 696.861111111111 & 6.11865287229608 & 113.891264246473 \tabularnewline
Winsorized Mean ( 21 / 24 ) & 691.319444444444 & 5.0799487073092 & 136.087878889358 \tabularnewline
Winsorized Mean ( 22 / 24 ) & 689.791666666667 & 4.79427873283095 & 143.878089928942 \tabularnewline
Winsorized Mean ( 23 / 24 ) & 689.152777777778 & 4.62610895736108 & 148.970286720375 \tabularnewline
Winsorized Mean ( 24 / 24 ) & 691.152777777778 & 4.34895431652159 & 158.923899281283 \tabularnewline
Trimmed Mean ( 1 / 24 ) & 680.957142857143 & 17.6899620120947 & 38.4939855942919 \tabularnewline
Trimmed Mean ( 2 / 24 ) & 681.35294117647 & 16.9036255560306 & 40.3080947881852 \tabularnewline
Trimmed Mean ( 3 / 24 ) & 682.772727272727 & 16.2846302392806 & 41.9274320165891 \tabularnewline
Trimmed Mean ( 4 / 24 ) & 684.21875 & 15.5663975445471 & 43.9548551963895 \tabularnewline
Trimmed Mean ( 5 / 24 ) & 685.758064516129 & 14.7877935979097 & 46.3732510178573 \tabularnewline
Trimmed Mean ( 6 / 24 ) & 687.316666666667 & 14.0067274325946 & 49.0704677430386 \tabularnewline
Trimmed Mean ( 7 / 24 ) & 689.551724137931 & 13.1868963818251 & 52.2906758476018 \tabularnewline
Trimmed Mean ( 8 / 24 ) & 691.928571428571 & 12.2075891113252 & 56.6801982863803 \tabularnewline
Trimmed Mean ( 9 / 24 ) & 694.148148148148 & 11.1333448639582 & 62.3485714877391 \tabularnewline
Trimmed Mean ( 10 / 24 ) & 696.634615384615 & 9.83659974046484 & 70.8206731762062 \tabularnewline
Trimmed Mean ( 11 / 24 ) & 697.1 & 9.23371152741023 & 75.4951026930679 \tabularnewline
Trimmed Mean ( 12 / 24 ) & 697.8125 & 8.5384329417677 & 81.7260620021375 \tabularnewline
Trimmed Mean ( 13 / 24 ) & 697.304347826087 & 8.15039014301167 & 85.5547201533624 \tabularnewline
Trimmed Mean ( 14 / 24 ) & 696.613636363636 & 7.69944232825067 & 90.4758561289086 \tabularnewline
Trimmed Mean ( 15 / 24 ) & 696.238095238095 & 7.4943888823487 & 92.9012500109147 \tabularnewline
Trimmed Mean ( 16 / 24 ) & 695.65 & 7.307578609102 & 95.1956916527082 \tabularnewline
Trimmed Mean ( 17 / 24 ) & 695.052631578947 & 7.09947079633976 & 97.9020340413671 \tabularnewline
Trimmed Mean ( 18 / 24 ) & 694.388888888889 & 6.80782437076188 & 101.998649064911 \tabularnewline
Trimmed Mean ( 19 / 24 ) & 693.647058823529 & 6.4590969100133 & 107.390718623248 \tabularnewline
Trimmed Mean ( 20 / 24 ) & 692.9375 & 6.08540319588206 & 113.868790233802 \tabularnewline
Trimmed Mean ( 21 / 24 ) & 692.466666666667 & 5.76767315646845 & 120.059970092110 \tabularnewline
Trimmed Mean ( 22 / 24 ) & 692.607142857143 & 5.63819628690014 & 122.841970661141 \tabularnewline
Trimmed Mean ( 23 / 24 ) & 692.961538461538 & 5.512916516755 & 125.697811014455 \tabularnewline
Trimmed Mean ( 24 / 24 ) & 693.458333333333 & 5.35107302210713 & 129.592388380502 \tabularnewline
Median & 695.5 &  &  \tabularnewline
Midrange & 668.5 &  &  \tabularnewline
Midmean - Weighted Average at Xnp & 690.947368421053 &  &  \tabularnewline
Midmean - Weighted Average at X(n+1)p & 694.388888888889 &  &  \tabularnewline
Midmean - Empirical Distribution Function & 690.947368421053 &  &  \tabularnewline
Midmean - Empirical Distribution Function - Averaging & 694.388888888889 &  &  \tabularnewline
Midmean - Empirical Distribution Function - Interpolation & 694.388888888889 &  &  \tabularnewline
Midmean - Closest Observation & 690.947368421053 &  &  \tabularnewline
Midmean - True Basic - Statistics Graphics Toolkit & 694.388888888889 &  &  \tabularnewline
Midmean - MS Excel (old versions) & 695.65 &  &  \tabularnewline
Number of observations & 72 &  &  \tabularnewline
\hline
\end{tabular}
%Source: https://freestatistics.org/blog/index.php?pk=107592&T=1

[TABLE]
[ROW][C]Central Tendency - Ungrouped Data[/C][/ROW]
[ROW][C]Measure[/C][C]Value[/C][C]S.E.[/C][C]Value/S.E.[/C][/ROW]
[ROW][C]Arithmetic Mean[/C][C]680.611111111111[/C][C]18.4470921700082[/C][C]36.8953060373205[/C][/ROW]
[ROW][C]Geometric Mean[/C][C]659.728212263828[/C][C][/C][C][/C][/ROW]
[ROW][C]Harmonic Mean[/C][C]635.054753946218[/C][C][/C][C][/C][/ROW]
[ROW][C]Quadratic Mean[/C][C]698.134975806573[/C][C][/C][C][/C][/ROW]
[ROW][C]Winsorized Mean ( 1 / 24 )[/C][C]680.583333333333[/C][C]18.3489663394890[/C][C]37.0910993426722[/C][/ROW]
[ROW][C]Winsorized Mean ( 2 / 24 )[/C][C]678.75[/C][C]17.8528342108017[/C][C]38.0191734256585[/C][/ROW]
[ROW][C]Winsorized Mean ( 3 / 24 )[/C][C]678.916666666667[/C][C]17.7916096303689[/C][C]38.1593729163103[/C][/ROW]
[ROW][C]Winsorized Mean ( 4 / 24 )[/C][C]678.916666666667[/C][C]17.5484991934827[/C][C]38.6880187975738[/C][/ROW]
[ROW][C]Winsorized Mean ( 5 / 24 )[/C][C]679.263888888889[/C][C]17.0493621129[/C][C]39.8410148362641[/C][/ROW]
[ROW][C]Winsorized Mean ( 6 / 24 )[/C][C]676.513888888889[/C][C]16.5609439423825[/C][C]40.8499594734793[/C][/ROW]
[ROW][C]Winsorized Mean ( 7 / 24 )[/C][C]676.611111111111[/C][C]16.3819525917436[/C][C]41.3022261737052[/C][/ROW]
[ROW][C]Winsorized Mean ( 8 / 24 )[/C][C]678.611111111111[/C][C]15.8119519031430[/C][C]42.9176053195698[/C][/ROW]
[ROW][C]Winsorized Mean ( 9 / 24 )[/C][C]677.986111111111[/C][C]15.4253147049357[/C][C]43.952821973491[/C][/ROW]
[ROW][C]Winsorized Mean ( 10 / 24 )[/C][C]693.402777777778[/C][C]11.9734915170493[/C][C]57.9114936349543[/C][/ROW]
[ROW][C]Winsorized Mean ( 11 / 24 )[/C][C]691.875[/C][C]11.6620201595555[/C][C]59.3271997933481[/C][/ROW]
[ROW][C]Winsorized Mean ( 12 / 24 )[/C][C]701.708333333333[/C][C]9.75867732120844[/C][C]71.9060903682426[/C][/ROW]
[ROW][C]Winsorized Mean ( 13 / 24 )[/C][C]702.791666666667[/C][C]9.53313424190483[/C][C]73.720945161708[/C][/ROW]
[ROW][C]Winsorized Mean ( 14 / 24 )[/C][C]699.680555555556[/C][C]8.00527570538852[/C][C]87.4024307600781[/C][/ROW]
[ROW][C]Winsorized Mean ( 15 / 24 )[/C][C]701.138888888889[/C][C]7.60899685631756[/C][C]92.1460347702405[/C][/ROW]
[ROW][C]Winsorized Mean ( 16 / 24 )[/C][C]700.694444444444[/C][C]7.40462674399427[/C][C]94.6292728411682[/C][/ROW]
[ROW][C]Winsorized Mean ( 17 / 24 )[/C][C]700.694444444444[/C][C]7.40462674399427[/C][C]94.6292728411682[/C][/ROW]
[ROW][C]Winsorized Mean ( 18 / 24 )[/C][C]700.694444444444[/C][C]7.1830427293507[/C][C]97.548416575796[/C][/ROW]
[ROW][C]Winsorized Mean ( 19 / 24 )[/C][C]699.638888888889[/C][C]6.78478994741171[/C][C]103.118725017536[/C][/ROW]
[ROW][C]Winsorized Mean ( 20 / 24 )[/C][C]696.861111111111[/C][C]6.11865287229608[/C][C]113.891264246473[/C][/ROW]
[ROW][C]Winsorized Mean ( 21 / 24 )[/C][C]691.319444444444[/C][C]5.0799487073092[/C][C]136.087878889358[/C][/ROW]
[ROW][C]Winsorized Mean ( 22 / 24 )[/C][C]689.791666666667[/C][C]4.79427873283095[/C][C]143.878089928942[/C][/ROW]
[ROW][C]Winsorized Mean ( 23 / 24 )[/C][C]689.152777777778[/C][C]4.62610895736108[/C][C]148.970286720375[/C][/ROW]
[ROW][C]Winsorized Mean ( 24 / 24 )[/C][C]691.152777777778[/C][C]4.34895431652159[/C][C]158.923899281283[/C][/ROW]
[ROW][C]Trimmed Mean ( 1 / 24 )[/C][C]680.957142857143[/C][C]17.6899620120947[/C][C]38.4939855942919[/C][/ROW]
[ROW][C]Trimmed Mean ( 2 / 24 )[/C][C]681.35294117647[/C][C]16.9036255560306[/C][C]40.3080947881852[/C][/ROW]
[ROW][C]Trimmed Mean ( 3 / 24 )[/C][C]682.772727272727[/C][C]16.2846302392806[/C][C]41.9274320165891[/C][/ROW]
[ROW][C]Trimmed Mean ( 4 / 24 )[/C][C]684.21875[/C][C]15.5663975445471[/C][C]43.9548551963895[/C][/ROW]
[ROW][C]Trimmed Mean ( 5 / 24 )[/C][C]685.758064516129[/C][C]14.7877935979097[/C][C]46.3732510178573[/C][/ROW]
[ROW][C]Trimmed Mean ( 6 / 24 )[/C][C]687.316666666667[/C][C]14.0067274325946[/C][C]49.0704677430386[/C][/ROW]
[ROW][C]Trimmed Mean ( 7 / 24 )[/C][C]689.551724137931[/C][C]13.1868963818251[/C][C]52.2906758476018[/C][/ROW]
[ROW][C]Trimmed Mean ( 8 / 24 )[/C][C]691.928571428571[/C][C]12.2075891113252[/C][C]56.6801982863803[/C][/ROW]
[ROW][C]Trimmed Mean ( 9 / 24 )[/C][C]694.148148148148[/C][C]11.1333448639582[/C][C]62.3485714877391[/C][/ROW]
[ROW][C]Trimmed Mean ( 10 / 24 )[/C][C]696.634615384615[/C][C]9.83659974046484[/C][C]70.8206731762062[/C][/ROW]
[ROW][C]Trimmed Mean ( 11 / 24 )[/C][C]697.1[/C][C]9.23371152741023[/C][C]75.4951026930679[/C][/ROW]
[ROW][C]Trimmed Mean ( 12 / 24 )[/C][C]697.8125[/C][C]8.5384329417677[/C][C]81.7260620021375[/C][/ROW]
[ROW][C]Trimmed Mean ( 13 / 24 )[/C][C]697.304347826087[/C][C]8.15039014301167[/C][C]85.5547201533624[/C][/ROW]
[ROW][C]Trimmed Mean ( 14 / 24 )[/C][C]696.613636363636[/C][C]7.69944232825067[/C][C]90.4758561289086[/C][/ROW]
[ROW][C]Trimmed Mean ( 15 / 24 )[/C][C]696.238095238095[/C][C]7.4943888823487[/C][C]92.9012500109147[/C][/ROW]
[ROW][C]Trimmed Mean ( 16 / 24 )[/C][C]695.65[/C][C]7.307578609102[/C][C]95.1956916527082[/C][/ROW]
[ROW][C]Trimmed Mean ( 17 / 24 )[/C][C]695.052631578947[/C][C]7.09947079633976[/C][C]97.9020340413671[/C][/ROW]
[ROW][C]Trimmed Mean ( 18 / 24 )[/C][C]694.388888888889[/C][C]6.80782437076188[/C][C]101.998649064911[/C][/ROW]
[ROW][C]Trimmed Mean ( 19 / 24 )[/C][C]693.647058823529[/C][C]6.4590969100133[/C][C]107.390718623248[/C][/ROW]
[ROW][C]Trimmed Mean ( 20 / 24 )[/C][C]692.9375[/C][C]6.08540319588206[/C][C]113.868790233802[/C][/ROW]
[ROW][C]Trimmed Mean ( 21 / 24 )[/C][C]692.466666666667[/C][C]5.76767315646845[/C][C]120.059970092110[/C][/ROW]
[ROW][C]Trimmed Mean ( 22 / 24 )[/C][C]692.607142857143[/C][C]5.63819628690014[/C][C]122.841970661141[/C][/ROW]
[ROW][C]Trimmed Mean ( 23 / 24 )[/C][C]692.961538461538[/C][C]5.512916516755[/C][C]125.697811014455[/C][/ROW]
[ROW][C]Trimmed Mean ( 24 / 24 )[/C][C]693.458333333333[/C][C]5.35107302210713[/C][C]129.592388380502[/C][/ROW]
[ROW][C]Median[/C][C]695.5[/C][C][/C][C][/C][/ROW]
[ROW][C]Midrange[/C][C]668.5[/C][C][/C][C][/C][/ROW]
[ROW][C]Midmean - Weighted Average at Xnp[/C][C]690.947368421053[/C][C][/C][C][/C][/ROW]
[ROW][C]Midmean - Weighted Average at X(n+1)p[/C][C]694.388888888889[/C][C][/C][C][/C][/ROW]
[ROW][C]Midmean - Empirical Distribution Function[/C][C]690.947368421053[/C][C][/C][C][/C][/ROW]
[ROW][C]Midmean - Empirical Distribution Function - Averaging[/C][C]694.388888888889[/C][C][/C][C][/C][/ROW]
[ROW][C]Midmean - Empirical Distribution Function - Interpolation[/C][C]694.388888888889[/C][C][/C][C][/C][/ROW]
[ROW][C]Midmean - Closest Observation[/C][C]690.947368421053[/C][C][/C][C][/C][/ROW]
[ROW][C]Midmean - True Basic - Statistics Graphics Toolkit[/C][C]694.388888888889[/C][C][/C][C][/C][/ROW]
[ROW][C]Midmean - MS Excel (old versions)[/C][C]695.65[/C][C][/C][C][/C][/ROW]
[ROW][C]Number of observations[/C][C]72[/C][C][/C][C][/C][/ROW]
[/TABLE]
Source: https://freestatistics.org/blog/index.php?pk=107592&T=1

Globally Unique Identifier (entire table): ba.freestatistics.org/blog/index.php?pk=107592&T=1

As an alternative you can also use a QR Code:  

The GUIDs for individual cells are displayed in the table below:

Central Tendency - Ungrouped Data
MeasureValueS.E.Value/S.E.
Arithmetic Mean680.61111111111118.447092170008236.8953060373205
Geometric Mean659.728212263828
Harmonic Mean635.054753946218
Quadratic Mean698.134975806573
Winsorized Mean ( 1 / 24 )680.58333333333318.348966339489037.0910993426722
Winsorized Mean ( 2 / 24 )678.7517.852834210801738.0191734256585
Winsorized Mean ( 3 / 24 )678.91666666666717.791609630368938.1593729163103
Winsorized Mean ( 4 / 24 )678.91666666666717.548499193482738.6880187975738
Winsorized Mean ( 5 / 24 )679.26388888888917.049362112939.8410148362641
Winsorized Mean ( 6 / 24 )676.51388888888916.560943942382540.8499594734793
Winsorized Mean ( 7 / 24 )676.61111111111116.381952591743641.3022261737052
Winsorized Mean ( 8 / 24 )678.61111111111115.811951903143042.9176053195698
Winsorized Mean ( 9 / 24 )677.98611111111115.425314704935743.952821973491
Winsorized Mean ( 10 / 24 )693.40277777777811.973491517049357.9114936349543
Winsorized Mean ( 11 / 24 )691.87511.662020159555559.3271997933481
Winsorized Mean ( 12 / 24 )701.7083333333339.7586773212084471.9060903682426
Winsorized Mean ( 13 / 24 )702.7916666666679.5331342419048373.720945161708
Winsorized Mean ( 14 / 24 )699.6805555555568.0052757053885287.4024307600781
Winsorized Mean ( 15 / 24 )701.1388888888897.6089968563175692.1460347702405
Winsorized Mean ( 16 / 24 )700.6944444444447.4046267439942794.6292728411682
Winsorized Mean ( 17 / 24 )700.6944444444447.4046267439942794.6292728411682
Winsorized Mean ( 18 / 24 )700.6944444444447.183042729350797.548416575796
Winsorized Mean ( 19 / 24 )699.6388888888896.78478994741171103.118725017536
Winsorized Mean ( 20 / 24 )696.8611111111116.11865287229608113.891264246473
Winsorized Mean ( 21 / 24 )691.3194444444445.0799487073092136.087878889358
Winsorized Mean ( 22 / 24 )689.7916666666674.79427873283095143.878089928942
Winsorized Mean ( 23 / 24 )689.1527777777784.62610895736108148.970286720375
Winsorized Mean ( 24 / 24 )691.1527777777784.34895431652159158.923899281283
Trimmed Mean ( 1 / 24 )680.95714285714317.689962012094738.4939855942919
Trimmed Mean ( 2 / 24 )681.3529411764716.903625556030640.3080947881852
Trimmed Mean ( 3 / 24 )682.77272727272716.284630239280641.9274320165891
Trimmed Mean ( 4 / 24 )684.2187515.566397544547143.9548551963895
Trimmed Mean ( 5 / 24 )685.75806451612914.787793597909746.3732510178573
Trimmed Mean ( 6 / 24 )687.31666666666714.006727432594649.0704677430386
Trimmed Mean ( 7 / 24 )689.55172413793113.186896381825152.2906758476018
Trimmed Mean ( 8 / 24 )691.92857142857112.207589111325256.6801982863803
Trimmed Mean ( 9 / 24 )694.14814814814811.133344863958262.3485714877391
Trimmed Mean ( 10 / 24 )696.6346153846159.8365997404648470.8206731762062
Trimmed Mean ( 11 / 24 )697.19.2337115274102375.4951026930679
Trimmed Mean ( 12 / 24 )697.81258.538432941767781.7260620021375
Trimmed Mean ( 13 / 24 )697.3043478260878.1503901430116785.5547201533624
Trimmed Mean ( 14 / 24 )696.6136363636367.6994423282506790.4758561289086
Trimmed Mean ( 15 / 24 )696.2380952380957.494388882348792.9012500109147
Trimmed Mean ( 16 / 24 )695.657.30757860910295.1956916527082
Trimmed Mean ( 17 / 24 )695.0526315789477.0994707963397697.9020340413671
Trimmed Mean ( 18 / 24 )694.3888888888896.80782437076188101.998649064911
Trimmed Mean ( 19 / 24 )693.6470588235296.4590969100133107.390718623248
Trimmed Mean ( 20 / 24 )692.93756.08540319588206113.868790233802
Trimmed Mean ( 21 / 24 )692.4666666666675.76767315646845120.059970092110
Trimmed Mean ( 22 / 24 )692.6071428571435.63819628690014122.841970661141
Trimmed Mean ( 23 / 24 )692.9615384615385.512916516755125.697811014455
Trimmed Mean ( 24 / 24 )693.4583333333335.35107302210713129.592388380502
Median695.5
Midrange668.5
Midmean - Weighted Average at Xnp690.947368421053
Midmean - Weighted Average at X(n+1)p694.388888888889
Midmean - Empirical Distribution Function690.947368421053
Midmean - Empirical Distribution Function - Averaging694.388888888889
Midmean - Empirical Distribution Function - Interpolation694.388888888889
Midmean - Closest Observation690.947368421053
Midmean - True Basic - Statistics Graphics Toolkit694.388888888889
Midmean - MS Excel (old versions)695.65
Number of observations72


Parameters (Session):
Parameters (R input):
R code (references can be found in the software module):
geomean <- function(x) {
return(exp(mean(log(x))))
}
harmean <- function(x) {
return(1/mean(1/x))
}
quamean <- function(x) {
return(sqrt(mean(x*x)))
}
winmean <- function(x) {
x <-sort(x[!is.na(x)])
n<-length(x)
denom <- 3
nodenom <- n/denom
if (nodenom>40) denom <- n/40
sqrtn = sqrt(n)
roundnodenom = floor(nodenom)
win <- array(NA,dim=c(roundnodenom,2))
for (j in 1:roundnodenom) {
win[j,1] <- (j*x[j+1]+sum(x[(j+1):(n-j)])+j*x[n-j])/n
win[j,2] <- sd(c(rep(x[j+1],j),x[(j+1):(n-j)],rep(x[n-j],j)))/sqrtn
}
return(win)
}
trimean <- function(x) {
x <-sort(x[!is.na(x)])
n<-length(x)
denom <- 3
nodenom <- n/denom
if (nodenom>40) denom <- n/40
sqrtn = sqrt(n)
roundnodenom = floor(nodenom)
tri <- array(NA,dim=c(roundnodenom,2))
for (j in 1:roundnodenom) {
tri[j,1] <- mean(x,trim=j/n)
tri[j,2] <- sd(x[(j+1):(n-j)]) / sqrt(n-j*2)
}
return(tri)
}
midrange <- function(x) {
return((max(x)+min(x))/2)
}
q1 <- function(data,n,p,i,f) {
np <- n*p;
i <<- floor(np)
f <<- np - i
qvalue <- (1-f)*data[i] + f*data[i+1]
}
q2 <- function(data,n,p,i,f) {
np <- (n+1)*p
i <<- floor(np)
f <<- np - i
qvalue <- (1-f)*data[i] + f*data[i+1]
}
q3 <- function(data,n,p,i,f) {
np <- n*p
i <<- floor(np)
f <<- np - i
if (f==0) {
qvalue <- data[i]
} else {
qvalue <- data[i+1]
}
}
q4 <- function(data,n,p,i,f) {
np <- n*p
i <<- floor(np)
f <<- np - i
if (f==0) {
qvalue <- (data[i]+data[i+1])/2
} else {
qvalue <- data[i+1]
}
}
q5 <- function(data,n,p,i,f) {
np <- (n-1)*p
i <<- floor(np)
f <<- np - i
if (f==0) {
qvalue <- data[i+1]
} else {
qvalue <- data[i+1] + f*(data[i+2]-data[i+1])
}
}
q6 <- function(data,n,p,i,f) {
np <- n*p+0.5
i <<- floor(np)
f <<- np - i
qvalue <- data[i]
}
q7 <- function(data,n,p,i,f) {
np <- (n+1)*p
i <<- floor(np)
f <<- np - i
if (f==0) {
qvalue <- data[i]
} else {
qvalue <- f*data[i] + (1-f)*data[i+1]
}
}
q8 <- function(data,n,p,i,f) {
np <- (n+1)*p
i <<- floor(np)
f <<- np - i
if (f==0) {
qvalue <- data[i]
} else {
if (f == 0.5) {
qvalue <- (data[i]+data[i+1])/2
} else {
if (f < 0.5) {
qvalue <- data[i]
} else {
qvalue <- data[i+1]
}
}
}
}
midmean <- function(x,def) {
x <-sort(x[!is.na(x)])
n<-length(x)
if (def==1) {
qvalue1 <- q1(x,n,0.25,i,f)
qvalue3 <- q1(x,n,0.75,i,f)
}
if (def==2) {
qvalue1 <- q2(x,n,0.25,i,f)
qvalue3 <- q2(x,n,0.75,i,f)
}
if (def==3) {
qvalue1 <- q3(x,n,0.25,i,f)
qvalue3 <- q3(x,n,0.75,i,f)
}
if (def==4) {
qvalue1 <- q4(x,n,0.25,i,f)
qvalue3 <- q4(x,n,0.75,i,f)
}
if (def==5) {
qvalue1 <- q5(x,n,0.25,i,f)
qvalue3 <- q5(x,n,0.75,i,f)
}
if (def==6) {
qvalue1 <- q6(x,n,0.25,i,f)
qvalue3 <- q6(x,n,0.75,i,f)
}
if (def==7) {
qvalue1 <- q7(x,n,0.25,i,f)
qvalue3 <- q7(x,n,0.75,i,f)
}
if (def==8) {
qvalue1 <- q8(x,n,0.25,i,f)
qvalue3 <- q8(x,n,0.75,i,f)
}
midm <- 0
myn <- 0
roundno4 <- round(n/4)
round3no4 <- round(3*n/4)
for (i in 1:n) {
if ((x[i]>=qvalue1) & (x[i]<=qvalue3)){
midm = midm + x[i]
myn = myn + 1
}
}
midm = midm / myn
return(midm)
}
(arm <- mean(x))
sqrtn <- sqrt(length(x))
(armse <- sd(x) / sqrtn)
(armose <- arm / armse)
(geo <- geomean(x))
(har <- harmean(x))
(qua <- quamean(x))
(win <- winmean(x))
(tri <- trimean(x))
(midr <- midrange(x))
midm <- array(NA,dim=8)
for (j in 1:8) midm[j] <- midmean(x,j)
midm
bitmap(file='test1.png')
lb <- win[,1] - 2*win[,2]
ub <- win[,1] + 2*win[,2]
if ((ylimmin == '') | (ylimmax == '')) plot(win[,1],type='b',main=main, xlab='j', pch=19, ylab='Winsorized Mean(j/n)', ylim=c(min(lb),max(ub))) else plot(win[,1],type='l',main=main, xlab='j', pch=19, ylab='Winsorized Mean(j/n)', ylim=c(ylimmin,ylimmax))
lines(ub,lty=3)
lines(lb,lty=3)
grid()
dev.off()
bitmap(file='test2.png')
lb <- tri[,1] - 2*tri[,2]
ub <- tri[,1] + 2*tri[,2]
if ((ylimmin == '') | (ylimmax == '')) plot(tri[,1],type='b',main=main, xlab='j', pch=19, ylab='Trimmed Mean(j/n)', ylim=c(min(lb),max(ub))) else plot(tri[,1],type='l',main=main, xlab='j', pch=19, ylab='Trimmed Mean(j/n)', ylim=c(ylimmin,ylimmax))
lines(ub,lty=3)
lines(lb,lty=3)
grid()
dev.off()
load(file='createtable')
a<-table.start()
a<-table.row.start(a)
a<-table.element(a,'Central Tendency - Ungrouped Data',4,TRUE)
a<-table.row.end(a)
a<-table.row.start(a)
a<-table.element(a,'Measure',header=TRUE)
a<-table.element(a,'Value',header=TRUE)
a<-table.element(a,'S.E.',header=TRUE)
a<-table.element(a,'Value/S.E.',header=TRUE)
a<-table.row.end(a)
a<-table.row.start(a)
a<-table.element(a,hyperlink('arithmetic_mean.htm', 'Arithmetic Mean', 'click to view the definition of the Arithmetic Mean'),header=TRUE)
a<-table.element(a,arm)
a<-table.element(a,hyperlink('arithmetic_mean_standard_error.htm', armse, 'click to view the definition of the Standard Error of the Arithmetic Mean'))
a<-table.element(a,armose)
a<-table.row.end(a)
a<-table.row.start(a)
a<-table.element(a,hyperlink('geometric_mean.htm', 'Geometric Mean', 'click to view the definition of the Geometric Mean'),header=TRUE)
a<-table.element(a,geo)
a<-table.element(a,'')
a<-table.row.end(a)
a<-table.row.start(a)
a<-table.element(a,hyperlink('harmonic_mean.htm', 'Harmonic Mean', 'click to view the definition of the Harmonic Mean'),header=TRUE)
a<-table.element(a,har)
a<-table.element(a,'')
a<-table.row.end(a)
a<-table.row.start(a)
a<-table.element(a,hyperlink('quadratic_mean.htm', 'Quadratic Mean', 'click to view the definition of the Quadratic Mean'),header=TRUE)
a<-table.element(a,qua)
a<-table.element(a,'')
a<-table.row.end(a)
for (j in 1:length(win[,1])) {
a<-table.row.start(a)
mylabel <- paste('Winsorized Mean (',j)
mylabel <- paste(mylabel,'/')
mylabel <- paste(mylabel,length(win[,1]))
mylabel <- paste(mylabel,')')
a<-table.element(a,hyperlink('winsorized_mean.htm', mylabel, 'click to view the definition of the Winsorized Mean'),header=TRUE)
a<-table.element(a,win[j,1])
a<-table.element(a,win[j,2])
a<-table.element(a,win[j,1]/win[j,2])
a<-table.row.end(a)
}
for (j in 1:length(tri[,1])) {
a<-table.row.start(a)
mylabel <- paste('Trimmed Mean (',j)
mylabel <- paste(mylabel,'/')
mylabel <- paste(mylabel,length(tri[,1]))
mylabel <- paste(mylabel,')')
a<-table.element(a,hyperlink('arithmetic_mean.htm', mylabel, 'click to view the definition of the Trimmed Mean'),header=TRUE)
a<-table.element(a,tri[j,1])
a<-table.element(a,tri[j,2])
a<-table.element(a,tri[j,1]/tri[j,2])
a<-table.row.end(a)
}
a<-table.row.start(a)
a<-table.element(a,hyperlink('median_1.htm', 'Median', 'click to view the definition of the Median'),header=TRUE)
a<-table.element(a,median(x))
a<-table.element(a,'')
a<-table.row.end(a)
a<-table.row.start(a)
a<-table.element(a,hyperlink('midrange.htm', 'Midrange', 'click to view the definition of the Midrange'),header=TRUE)
a<-table.element(a,midr)
a<-table.element(a,'')
a<-table.row.end(a)
a<-table.row.start(a)
mymid <- hyperlink('midmean.htm', 'Midmean', 'click to view the definition of the Midmean')
mylabel <- paste(mymid,hyperlink('method_1.htm','Weighted Average at Xnp',''),sep=' - ')
a<-table.element(a,mylabel,header=TRUE)
a<-table.element(a,midm[1])
a<-table.element(a,'')
a<-table.row.end(a)
a<-table.row.start(a)
mymid <- hyperlink('midmean.htm', 'Midmean', 'click to view the definition of the Midmean')
mylabel <- paste(mymid,hyperlink('method_2.htm','Weighted Average at X(n+1)p',''),sep=' - ')
a<-table.element(a,mylabel,header=TRUE)
a<-table.element(a,midm[2])
a<-table.element(a,'')
a<-table.row.end(a)
a<-table.row.start(a)
mymid <- hyperlink('midmean.htm', 'Midmean', 'click to view the definition of the Midmean')
mylabel <- paste(mymid,hyperlink('method_3.htm','Empirical Distribution Function',''),sep=' - ')
a<-table.element(a,mylabel,header=TRUE)
a<-table.element(a,midm[3])
a<-table.element(a,'')
a<-table.row.end(a)
a<-table.row.start(a)
mymid <- hyperlink('midmean.htm', 'Midmean', 'click to view the definition of the Midmean')
mylabel <- paste(mymid,hyperlink('method_4.htm','Empirical Distribution Function - Averaging',''),sep=' - ')
a<-table.element(a,mylabel,header=TRUE)
a<-table.element(a,midm[4])
a<-table.element(a,'')
a<-table.row.end(a)
a<-table.row.start(a)
mymid <- hyperlink('midmean.htm', 'Midmean', 'click to view the definition of the Midmean')
mylabel <- paste(mymid,hyperlink('method_5.htm','Empirical Distribution Function - Interpolation',''),sep=' - ')
a<-table.element(a,mylabel,header=TRUE)
a<-table.element(a,midm[5])
a<-table.element(a,'')
a<-table.row.end(a)
a<-table.row.start(a)
mymid <- hyperlink('midmean.htm', 'Midmean', 'click to view the definition of the Midmean')
mylabel <- paste(mymid,hyperlink('method_6.htm','Closest Observation',''),sep=' - ')
a<-table.element(a,mylabel,header=TRUE)
a<-table.element(a,midm[6])
a<-table.element(a,'')
a<-table.row.end(a)
a<-table.row.start(a)
mymid <- hyperlink('midmean.htm', 'Midmean', 'click to view the definition of the Midmean')
mylabel <- paste(mymid,hyperlink('method_7.htm','True Basic - Statistics Graphics Toolkit',''),sep=' - ')
a<-table.element(a,mylabel,header=TRUE)
a<-table.element(a,midm[7])
a<-table.element(a,'')
a<-table.row.end(a)
a<-table.row.start(a)
mymid <- hyperlink('midmean.htm', 'Midmean', 'click to view the definition of the Midmean')
mylabel <- paste(mymid,hyperlink('method_8.htm','MS Excel (old versions)',''),sep=' - ')
a<-table.element(a,mylabel,header=TRUE)
a<-table.element(a,midm[8])
a<-table.element(a,'')
a<-table.row.end(a)
a<-table.row.start(a)
a<-table.element(a,'Number of observations',header=TRUE)
a<-table.element(a,length(x))
a<-table.element(a,'')
a<-table.row.end(a)
a<-table.end(a)
table.save(a,file='mytable.tab')