| Multiple Linear Regression - Estimated Regression Equation |
| Birth[t] = + 4305.74116897413 + 111.797019312520x[t] + 0.114363609997994`(t-1)(t-2)`[t] + 0.149789773200904`(t-3)`[t] + 0.231900872212371`(t-4)`[t] + 0.0557474763800532V6[t] -796.750672653784M1[t] + 162.958810260578M2[t] -278.392163261884M3[t] -15.4247378444073M4[t] -203.396827883287M5[t] + 379.290332668419M6[t] + 174.162983151376M7[t] -124.869742601276M8[t] -138.797056360805M9[t] -872.609202075023M10[t] -325.272262586112M11[t] + 3.6537386110181t + e[t] |
| Multiple Linear Regression - Ordinary Least Squares | |||||
| Variable | Parameter | S.D. | T-STAT H0: parameter = 0 | 2-tail p-value | 1-tail p-value |
| (Intercept) | 4305.74116897413 | 1689.958097 | 2.5478 | 0.013775 | 0.006888 |
| x | 111.797019312520 | 141.183035 | 0.7919 | 0.431973 | 0.215986 |
| `(t-1)(t-2)` | 0.114363609997994 | 0.144642 | 0.7907 | 0.432663 | 0.216331 |
| `(t-3)` | 0.149789773200904 | 0.138151 | 1.0842 | 0.283164 | 0.141582 |
| `(t-4)` | 0.231900872212371 | 0.138267 | 1.6772 | 0.099392 | 0.049696 |
| V6 | 0.0557474763800532 | 0.146133 | 0.3815 | 0.704369 | 0.352184 |
| M1 | -796.750672653784 | 211.414945 | -3.7687 | 0.000414 | 0.000207 |
| M2 | 162.958810260578 | 238.077963 | 0.6845 | 0.496657 | 0.248328 |
| M3 | -278.392163261884 | 175.876762 | -1.5829 | 0.119398 | 0.059699 |
| M4 | -15.4247378444073 | 241.109457 | -0.064 | 0.949232 | 0.474616 |
| M5 | -203.396827883287 | 220.110027 | -0.9241 | 0.359639 | 0.179819 |
| M6 | 379.290332668419 | 191.053241 | 1.9853 | 0.052301 | 0.02615 |
| M7 | 174.162983151376 | 208.618374 | 0.8348 | 0.407555 | 0.203778 |
| M8 | -124.869742601276 | 236.09641 | -0.5289 | 0.599088 | 0.299544 |
| M9 | -138.797056360805 | 216.343578 | -0.6416 | 0.523925 | 0.261962 |
| M10 | -872.609202075023 | 192.812809 | -4.5257 | 3.4e-05 | 1.7e-05 |
| M11 | -325.272262586112 | 220.447326 | -1.4755 | 0.145992 | 0.072996 |
| t | 3.6537386110181 | 3.515962 | 1.0392 | 0.303436 | 0.151718 |
| Multiple Linear Regression - Regression Statistics | |
| Multiple R | 0.885237692500969 |
| R-squared | 0.78364577222444 |
| Adjusted R-squared | 0.714249133126619 |
| F-TEST (value) | 11.2922726865752 |
| F-TEST (DF numerator) | 17 |
| F-TEST (DF denominator) | 53 |
| p-value | 4.21707113673619e-12 |
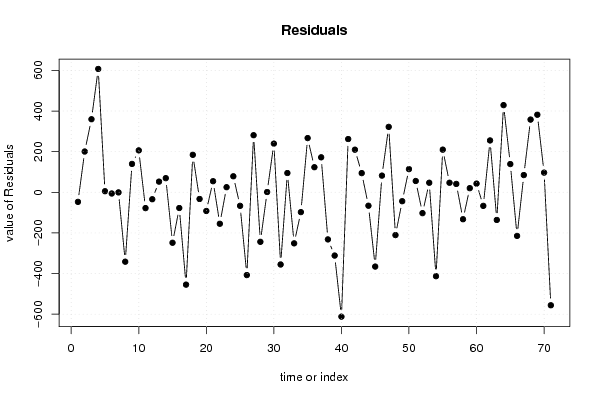
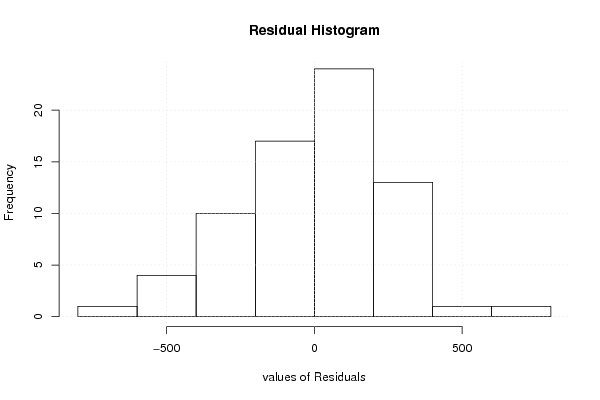
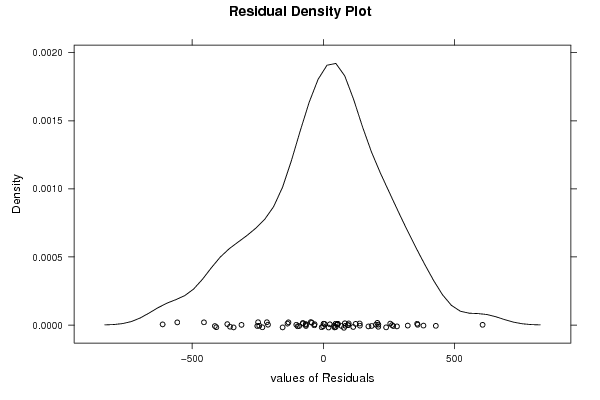
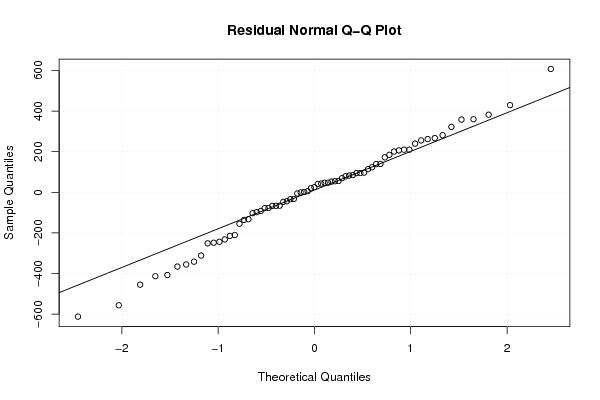
| Multiple Linear Regression - Residual Statistics | |
| Residual Standard Deviation | 272.147760915185 |
| Sum Squared Residuals | 3925413.39987088 |
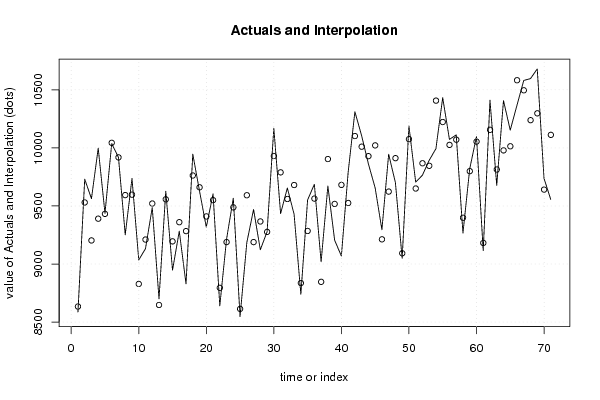
| Multiple Linear Regression - Actuals, Interpolation, and Residuals | |||
| Time or Index | Actuals | Interpolation Forecast | Residuals Prediction Error |
| 1 | 8587 | 8634.22152834587 | -47.2215283458666 |
| 2 | 9731 | 9530.27989199037 | 200.720108009635 |
| 3 | 9563 | 9203.24756631348 | 359.752433686525 |
| 4 | 9998 | 9390.6753230611 | 607.324676938906 |
| 5 | 9437 | 9431.79097520022 | 5.20902479978107 |
| 6 | 10038 | 10043.9482069436 | -5.94820694356449 |
| 7 | 9918 | 9918.68636626116 | -0.686366261159808 |
| 8 | 9252 | 9593.7611625277 | -341.761162527693 |
| 9 | 9737 | 9597.44474028683 | 139.555259713166 |
| 10 | 9035 | 8828.66882371979 | 206.331176280213 |
| 11 | 9133 | 9210.88860954452 | -77.8886095445173 |
| 12 | 9487 | 9521.2139274883 | -34.2139274883007 |
| 13 | 8700 | 8647.52422290975 | 52.4757770902457 |
| 14 | 9627 | 9557.50042013785 | 69.4995798621518 |
| 15 | 8947 | 9195.48986163386 | -248.489861633859 |
| 16 | 9283 | 9360.42751082836 | -77.4275108283573 |
| 17 | 8829 | 9283.77713121297 | -454.777131212974 |
| 18 | 9947 | 9762.51163273201 | 184.488367267991 |
| 19 | 9628 | 9660.90238989545 | -32.9023898954528 |
| 20 | 9318 | 9409.95453368235 | -91.95453368235 |
| 21 | 9605 | 9550.40112264026 | 54.5988773597412 |
| 22 | 8640 | 8794.97954227136 | -154.979542271357 |
| 23 | 9214 | 9188.92628628081 | 25.0737137191913 |
| 24 | 9567 | 9488.22370112505 | 78.7762988749507 |
| 25 | 8547 | 8613.69163526503 | -66.6916352650307 |
| 26 | 9185 | 9592.59455047553 | -407.594550475526 |
| 27 | 9470 | 9188.935789411 | 281.064210589001 |
| 28 | 9123 | 9366.85642709664 | -243.856427096638 |
| 29 | 9278 | 9276.63431892557 | 1.36568107443183 |
| 30 | 10170 | 9930.38316484827 | 239.616835151732 |
| 31 | 9434 | 9789.55773701722 | -355.557737017217 |
| 32 | 9655 | 9560.2198715013 | 94.7801284986962 |
| 33 | 9429 | 9680.47181793883 | -251.471817938827 |
| 34 | 8739 | 8836.61848183618 | -97.6184818361834 |
| 35 | 9552 | 9285.06573043731 | 266.934269562693 |
| 36 | 9687 | 9563.52499821418 | 123.475001785821 |
| 37 | 9019 | 8846.83272495757 | 172.167275042432 |
| 38 | 9672 | 9904.09232479283 | -232.092324792831 |
| 39 | 9206 | 9517.64427475753 | -311.644274757528 |
| 40 | 9069 | 9681.4008451006 | -612.400845100591 |
| 41 | 9788 | 9525.80460012419 | 262.195399875815 |
| 42 | 10312 | 10102.1890315722 | 209.810968427847 |
| 43 | 10105 | 10010.5920557503 | 94.4079442496724 |
| 44 | 9863 | 9929.128965353 | -66.1289653530095 |
| 45 | 9656 | 10021.7714060889 | -365.771406088937 |
| 46 | 9295 | 9212.89880367672 | 82.1011963232786 |
| 47 | 9946 | 9623.93799682872 | 322.062003171277 |
| 48 | 9701 | 9911.74623017709 | -210.746230177087 |
| 49 | 9049 | 9092.88741155926 | -43.8874115592631 |
| 50 | 10190 | 10075.8296937688 | 114.170306231216 |
| 51 | 9706 | 9650.43429916945 | 55.565700830553 |
| 52 | 9765 | 9867.75610678556 | -102.756106785564 |
| 53 | 9893 | 9845.93849871287 | 47.0615012871326 |
| 54 | 9994 | 10407.1233849730 | -413.123384973042 |
| 55 | 10433 | 10223.0739625391 | 209.926037460885 |
| 56 | 10073 | 10026.0017800295 | 46.9982199705025 |
| 57 | 10112 | 10070.872680787 | 41.1273192129988 |
| 58 | 9266 | 9398.68511413702 | -132.685114137015 |
| 59 | 9820 | 9799.75480746787 | 20.2451925321346 |
| 60 | 10097 | 10054.2911429954 | 42.708857004617 |
| 61 | 9115 | 9181.84247696252 | -66.8424769625176 |
| 62 | 10411 | 10155.7031188346 | 255.296881165353 |
| 63 | 9678 | 9814.2482087147 | -136.248208714693 |
| 64 | 10408 | 9978.88378712776 | 429.116212872245 |
| 65 | 10153 | 10014.0544758242 | 138.945524175813 |
| 66 | 10368 | 10582.8445789310 | -214.844578930964 |
| 67 | 10581 | 10496.1874885367 | 84.812511463271 |
| 68 | 10597 | 10238.9336869061 | 358.066313093854 |
| 69 | 10680 | 10298.0382322581 | 381.961767741859 |
| 70 | 9738 | 9641.14923435894 | 96.8507656410638 |
| 71 | 9556 | 10112.4265694408 | -556.426569440779 |
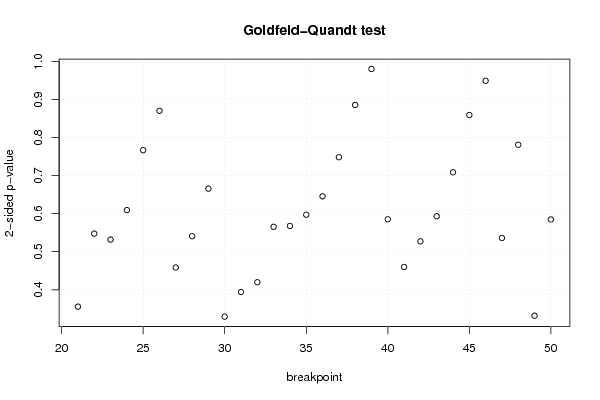
| Goldfeld-Quandt test for Heteroskedasticity | |||
| p-values | Alternative Hypothesis | ||
| breakpoint index | greater | 2-sided | less |
| 21 | 0.822170479400922 | 0.355659041198156 | 0.177829520599078 |
| 22 | 0.726284324877526 | 0.547431350244949 | 0.273715675122474 |
| 23 | 0.734119060199927 | 0.531761879600146 | 0.265880939800073 |
| 24 | 0.695321580669837 | 0.609356838660326 | 0.304678419330163 |
| 25 | 0.616612185510457 | 0.766775628979085 | 0.383387814489543 |
| 26 | 0.564900672616462 | 0.870198654767076 | 0.435099327383538 |
| 27 | 0.770796157934591 | 0.458407684130818 | 0.229203842065409 |
| 28 | 0.729656332695517 | 0.540687334608966 | 0.270343667304483 |
| 29 | 0.667193483222985 | 0.665613033554029 | 0.332806516777015 |
| 30 | 0.835345797250065 | 0.329308405499870 | 0.164654202749935 |
| 31 | 0.802955190485801 | 0.394089619028397 | 0.197044809514199 |
| 32 | 0.790149238737184 | 0.419701522525633 | 0.209850761262816 |
| 33 | 0.717302877979736 | 0.565394244040528 | 0.282697122020264 |
| 34 | 0.716175228965786 | 0.567649542068428 | 0.283824771034214 |
| 35 | 0.701417381982728 | 0.597165236034545 | 0.298582618017272 |
| 36 | 0.677272261782925 | 0.64545547643415 | 0.322727738217075 |
| 37 | 0.625859979038627 | 0.748280041922745 | 0.374140020961373 |
| 38 | 0.557127243813863 | 0.885745512372273 | 0.442872756186136 |
| 39 | 0.490098592858451 | 0.980197185716903 | 0.509901407141549 |
| 40 | 0.70738397190228 | 0.585232056195442 | 0.292616028097721 |
| 41 | 0.770074873307943 | 0.459850253384113 | 0.229925126692057 |
| 42 | 0.736410679988357 | 0.527178640023286 | 0.263589320011643 |
| 43 | 0.703411309279631 | 0.593177381440737 | 0.296588690720369 |
| 44 | 0.64568282354887 | 0.708634352902261 | 0.354317176451130 |
| 45 | 0.570421962329166 | 0.859156075341667 | 0.429578037670834 |
| 46 | 0.474535533795958 | 0.949071067591917 | 0.525464466204042 |
| 47 | 0.732009170832274 | 0.535981658335451 | 0.267990829167726 |
| 48 | 0.609532596311674 | 0.780934807376653 | 0.390467403688326 |
| 49 | 0.834080592115458 | 0.331838815769083 | 0.165919407884542 |
| 50 | 0.707734470138124 | 0.584531059723752 | 0.292265529861876 |
| Meta Analysis of Goldfeld-Quandt test for Heteroskedasticity | |||
| Description | # significant tests | % significant tests | OK/NOK |
| 1% type I error level | 0 | 0 | OK |
| 5% type I error level | 0 | 0 | OK |
| 10% type I error level | 0 | 0 | OK |