Free Statistics

of Irreproducible Research!

Author's title

Author*The author of this computation has been verified*
R Software Modulerwasp_multipleregression.wasp
Title produced by softwareMultiple Regression
Date of computationFri, 10 Dec 2010 10:18:38 +0000
Cite this page as followsStatistical Computations at FreeStatistics.org, Office for Research Development and Education, URL https://freestatistics.org/blog/index.php?v=date/2010/Dec/10/t1291976248ck9s9c9evqfsf60.htm/, Retrieved Mon, 29 Apr 2024 15:24:28 +0000
Statistical Computations at FreeStatistics.org, Office for Research Development and Education, URL https://freestatistics.org/blog/index.php?pk=107496, Retrieved Mon, 29 Apr 2024 15:24:28 +0000
QR Codes:

Original text written by user:
IsPrivate?No (this computation is public)
User-defined keywords
Estimated Impact172
Family? (F = Feedback message, R = changed R code, M = changed R Module, P = changed Parameters, D = changed Data)
-     [Multiple Regression] [] [2010-12-05 18:56:24] [b98453cac15ba1066b407e146608df68]
-   PD    [Multiple Regression] [Faillissementen B...] [2010-12-10 10:18:38] [dcc54e7e6e8c80b7c45e040080afe6ab] [Current]
Feedback Forum

Post a new message
Dataseries X:
2148	77.405	82.145	315.4
2118	85.056	78.213	329.3
1603	90.088	88.099	308.2
2066	99.285	106.25	335.8
2095	80.428	80.487	343.7
2210	88.017	80.336	349.2
1609	93.489	90.065	312.4
1964	103.961	108.888	337.6
2114	82.591	82.747	360.2
2054	90.913	82.213	372.1
1424	96.787	93.41	341.8
2025	106.045	109.465	377.4
2003	84.752	84.373	337.2
2017	94.173	98.715	384.6
1528	97.733	99.646	358.6
2130	108.499	115.239	383.4
2017	87.972	89.082	384.4
2260	96.091	89.934	402.7
1805	101.846	99.957	372.1
2394	115.652	122.717	364.9
2586	91.269	95.895	314.9
2429	100.911	97.085	320.7
1910	105.248	109.414	308.6
2515	118.681	126.945	328.7


Summary of computational transaction
Raw Inputview raw input (R code)
Raw Outputview raw output of R engine
Computing time7 seconds
R Server'Sir Ronald Aylmer Fisher' @ 193.190.124.24
R Framework error message
The field 'Names of X columns' contains a hard return which cannot be interpreted.
Please, resubmit your request without hard returns in the 'Names of X columns'.

\begin{tabular}{lllllllll}
\hline
Summary of computational transaction \tabularnewline
Raw Input & view raw input (R code)  \tabularnewline
Raw Output & view raw output of R engine  \tabularnewline
Computing time & 7 seconds \tabularnewline
R Server & 'Sir Ronald Aylmer Fisher' @ 193.190.124.24 \tabularnewline
R Framework error message & 
The field 'Names of X columns' contains a hard return which cannot be interpreted.
Please, resubmit your request without hard returns in the 'Names of X columns'.
\tabularnewline \hline \end{tabular} %Source: https://freestatistics.org/blog/index.php?pk=107496&T=0

[TABLE]
[ROW][C]Summary of computational transaction[/C][/ROW]
[ROW][C]Raw Input[/C][C]view raw input (R code) [/C][/ROW]
[ROW][C]Raw Output[/C][C]view raw output of R engine [/C][/ROW]
[ROW][C]Computing time[/C][C]7 seconds[/C][/ROW]
[ROW][C]R Server[/C][C]'Sir Ronald Aylmer Fisher' @ 193.190.124.24[/C][/ROW]
[ROW][C]R Framework error message[/C][C]
The field 'Names of X columns' contains a hard return which cannot be interpreted.
Please, resubmit your request without hard returns in the 'Names of X columns'.
[/C][/ROW] [/TABLE] Source: https://freestatistics.org/blog/index.php?pk=107496&T=0

Globally Unique Identifier (entire table): ba.freestatistics.org/blog/index.php?pk=107496&T=0

As an alternative you can also use a QR Code:  

The GUIDs for individual cells are displayed in the table below:

Summary of computational transaction
Raw Inputview raw input (R code)
Raw Outputview raw output of R engine
Computing time7 seconds
R Server'Sir Ronald Aylmer Fisher' @ 193.190.124.24
R Framework error message
The field 'Names of X columns' contains a hard return which cannot be interpreted.
Please, resubmit your request without hard returns in the 'Names of X columns'.


Multiple Linear Regression - Estimated Regression Equation
Brutoloonindex[t] = + 19.7756091235265 -0.00154280892764273FallBelg[t] + 0.732769695289517wgbijdrage[t] + 0.0244785764196066`brutoomzetindex `[t] + e[t]

\begin{tabular}{lllllllll}
\hline
Multiple Linear Regression - Estimated Regression Equation \tabularnewline
Brutoloonindex[t] =  +  19.7756091235265 -0.00154280892764273FallBelg[t] +  0.732769695289517wgbijdrage[t] +  0.0244785764196066`brutoomzetindex
`[t]  + e[t] \tabularnewline
\hline
\end{tabular}
%Source: https://freestatistics.org/blog/index.php?pk=107496&T=1

[TABLE]
[ROW][C]Multiple Linear Regression - Estimated Regression Equation[/C][/ROW]
[ROW][C]Brutoloonindex[t] =  +  19.7756091235265 -0.00154280892764273FallBelg[t] +  0.732769695289517wgbijdrage[t] +  0.0244785764196066`brutoomzetindex
`[t]  + e[t][/C][/ROW]
[/TABLE]
Source: https://freestatistics.org/blog/index.php?pk=107496&T=1

Globally Unique Identifier (entire table): ba.freestatistics.org/blog/index.php?pk=107496&T=1

As an alternative you can also use a QR Code:  

The GUIDs for individual cells are displayed in the table below:

Multiple Linear Regression - Estimated Regression Equation
Brutoloonindex[t] = + 19.7756091235265 -0.00154280892764273FallBelg[t] + 0.732769695289517wgbijdrage[t] + 0.0244785764196066`brutoomzetindex `[t] + e[t]


Multiple Linear Regression - Ordinary Least Squares
VariableParameterS.D.T-STATH0: parameter = 02-tail p-value1-tail p-value
(Intercept)19.775609123526511.0136381.79560.0876910.043846
FallBelg-0.001542808927642730.002583-0.59720.5570580.278529
wgbijdrage0.7327696952895170.05542713.220400
`brutoomzetindex `0.02447857641960660.026830.91240.3724450.186223

\begin{tabular}{lllllllll}
\hline
Multiple Linear Regression - Ordinary Least Squares \tabularnewline
Variable & Parameter & S.D. & T-STATH0: parameter = 0 & 2-tail p-value & 1-tail p-value \tabularnewline
(Intercept) & 19.7756091235265 & 11.013638 & 1.7956 & 0.087691 & 0.043846 \tabularnewline
FallBelg & -0.00154280892764273 & 0.002583 & -0.5972 & 0.557058 & 0.278529 \tabularnewline
wgbijdrage & 0.732769695289517 & 0.055427 & 13.2204 & 0 & 0 \tabularnewline
`brutoomzetindex
` & 0.0244785764196066 & 0.02683 & 0.9124 & 0.372445 & 0.186223 \tabularnewline
\hline
\end{tabular}
%Source: https://freestatistics.org/blog/index.php?pk=107496&T=2

[TABLE]
[ROW][C]Multiple Linear Regression - Ordinary Least Squares[/C][/ROW]
[ROW][C]Variable[/C][C]Parameter[/C][C]S.D.[/C][C]T-STATH0: parameter = 0[/C][C]2-tail p-value[/C][C]1-tail p-value[/C][/ROW]
[ROW][C](Intercept)[/C][C]19.7756091235265[/C][C]11.013638[/C][C]1.7956[/C][C]0.087691[/C][C]0.043846[/C][/ROW]
[ROW][C]FallBelg[/C][C]-0.00154280892764273[/C][C]0.002583[/C][C]-0.5972[/C][C]0.557058[/C][C]0.278529[/C][/ROW]
[ROW][C]wgbijdrage[/C][C]0.732769695289517[/C][C]0.055427[/C][C]13.2204[/C][C]0[/C][C]0[/C][/ROW]
[ROW][C]`brutoomzetindex
`[/C][C]0.0244785764196066[/C][C]0.02683[/C][C]0.9124[/C][C]0.372445[/C][C]0.186223[/C][/ROW]
[/TABLE]
Source: https://freestatistics.org/blog/index.php?pk=107496&T=2

Globally Unique Identifier (entire table): ba.freestatistics.org/blog/index.php?pk=107496&T=2

As an alternative you can also use a QR Code:  

The GUIDs for individual cells are displayed in the table below:

Multiple Linear Regression - Ordinary Least Squares
VariableParameterS.D.T-STATH0: parameter = 02-tail p-value1-tail p-value
(Intercept)19.775609123526511.0136381.79560.0876910.043846
FallBelg-0.001542808927642730.002583-0.59720.5570580.278529
wgbijdrage0.7327696952895170.05542713.220400
`brutoomzetindex `0.02447857641960660.026830.91240.3724450.186223


Multiple Linear Regression - Regression Statistics
Multiple R0.949722302829804
R-squared0.901972452492345
Adjusted R-squared0.887268320366197
F-TEST (value)61.3414273453363
F-TEST (DF numerator)3
F-TEST (DF denominator)20
p-value2.89352097837536e-10
Multiple Linear Regression - Residual Statistics
Residual Standard Deviation3.57849071687472
Sum Squared Residuals256.111916215171

\begin{tabular}{lllllllll}
\hline
Multiple Linear Regression - Regression Statistics \tabularnewline
Multiple R & 0.949722302829804 \tabularnewline
R-squared & 0.901972452492345 \tabularnewline
Adjusted R-squared & 0.887268320366197 \tabularnewline
F-TEST (value) & 61.3414273453363 \tabularnewline
F-TEST (DF numerator) & 3 \tabularnewline
F-TEST (DF denominator) & 20 \tabularnewline
p-value & 2.89352097837536e-10 \tabularnewline
Multiple Linear Regression - Residual Statistics \tabularnewline
Residual Standard Deviation & 3.57849071687472 \tabularnewline
Sum Squared Residuals & 256.111916215171 \tabularnewline
\hline
\end{tabular}
%Source: https://freestatistics.org/blog/index.php?pk=107496&T=3

[TABLE]
[ROW][C]Multiple Linear Regression - Regression Statistics[/C][/ROW]
[ROW][C]Multiple R[/C][C]0.949722302829804[/C][/ROW]
[ROW][C]R-squared[/C][C]0.901972452492345[/C][/ROW]
[ROW][C]Adjusted R-squared[/C][C]0.887268320366197[/C][/ROW]
[ROW][C]F-TEST (value)[/C][C]61.3414273453363[/C][/ROW]
[ROW][C]F-TEST (DF numerator)[/C][C]3[/C][/ROW]
[ROW][C]F-TEST (DF denominator)[/C][C]20[/C][/ROW]
[ROW][C]p-value[/C][C]2.89352097837536e-10[/C][/ROW]
[ROW][C]Multiple Linear Regression - Residual Statistics[/C][/ROW]
[ROW][C]Residual Standard Deviation[/C][C]3.57849071687472[/C][/ROW]
[ROW][C]Sum Squared Residuals[/C][C]256.111916215171[/C][/ROW]
[/TABLE]
Source: https://freestatistics.org/blog/index.php?pk=107496&T=3

Globally Unique Identifier (entire table): ba.freestatistics.org/blog/index.php?pk=107496&T=3

As an alternative you can also use a QR Code:  

The GUIDs for individual cells are displayed in the table below:

Multiple Linear Regression - Regression Statistics
Multiple R0.949722302829804
R-squared0.901972452492345
Adjusted R-squared0.887268320366197
F-TEST (value)61.3414273453363
F-TEST (DF numerator)3
F-TEST (DF denominator)20
p-value2.89352097837536e-10
Multiple Linear Regression - Residual Statistics
Residual Standard Deviation3.57849071687472
Sum Squared Residuals256.111916215171


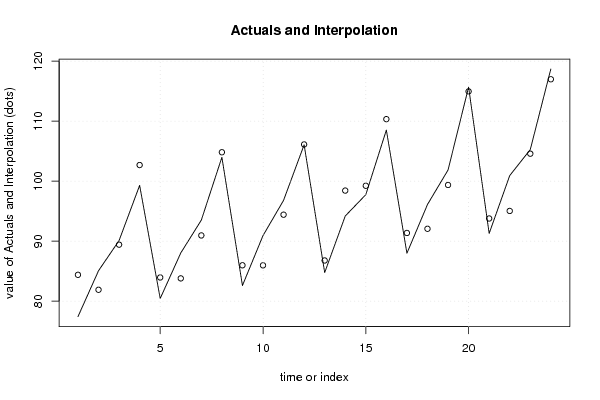
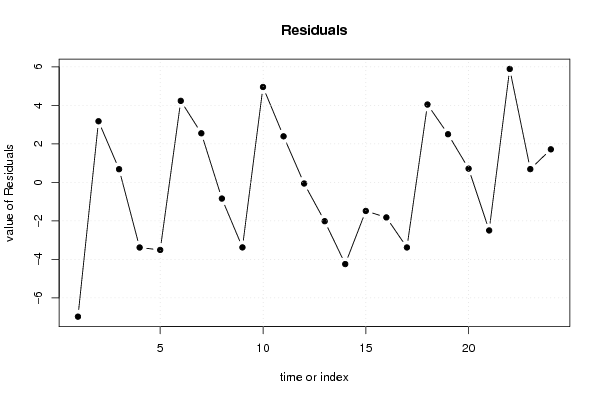
Multiple Linear Regression - Actuals, Interpolation, and Residuals
Time or IndexActualsInterpolationForecastResidualsPrediction Error
177.40584.3755651692512-6.97056516925118
285.05681.88085120743463.17514879256539
390.08889.4030610503490.684938949650912
499.285102.664851965232-3.37985196523167
580.42883.9351456003011-3.5071456003011
688.01783.78170651994134.23529348005869
793.48990.93723943868482.55176056131524
8103.961104.799326369580-0.838326369580266
982.59185.9657882529537-3.37478825295371
1090.91385.9583528307214.95464716927902
1196.78794.39344386777852.39355613222147
12106.045106.102270480676-0.0572704806764468
1384.75286.7655163108118-2.01351631081186
1494.17398.4135844779564-4.24058447795645
1597.73399.2137836429785-1.48078364297851
16108.499110.318159222393-1.81915922239328
1787.97291.3499182879486-3.37791828794862
1896.09192.04729344739694.04370655260309
19101.84699.34477772692122.5012222730788
20115.652114.9376557831080.714344216892131
2191.26993.7631588809647-2.49415888096471
22100.91195.01935156323295.89164843676713
23105.248104.5581961952270.689803804773342
24118.681116.9630017081571.71799829184259

\begin{tabular}{lllllllll}
\hline
Multiple Linear Regression - Actuals, Interpolation, and Residuals \tabularnewline
Time or Index & Actuals & InterpolationForecast & ResidualsPrediction Error \tabularnewline
1 & 77.405 & 84.3755651692512 & -6.97056516925118 \tabularnewline
2 & 85.056 & 81.8808512074346 & 3.17514879256539 \tabularnewline
3 & 90.088 & 89.403061050349 & 0.684938949650912 \tabularnewline
4 & 99.285 & 102.664851965232 & -3.37985196523167 \tabularnewline
5 & 80.428 & 83.9351456003011 & -3.5071456003011 \tabularnewline
6 & 88.017 & 83.7817065199413 & 4.23529348005869 \tabularnewline
7 & 93.489 & 90.9372394386848 & 2.55176056131524 \tabularnewline
8 & 103.961 & 104.799326369580 & -0.838326369580266 \tabularnewline
9 & 82.591 & 85.9657882529537 & -3.37478825295371 \tabularnewline
10 & 90.913 & 85.958352830721 & 4.95464716927902 \tabularnewline
11 & 96.787 & 94.3934438677785 & 2.39355613222147 \tabularnewline
12 & 106.045 & 106.102270480676 & -0.0572704806764468 \tabularnewline
13 & 84.752 & 86.7655163108118 & -2.01351631081186 \tabularnewline
14 & 94.173 & 98.4135844779564 & -4.24058447795645 \tabularnewline
15 & 97.733 & 99.2137836429785 & -1.48078364297851 \tabularnewline
16 & 108.499 & 110.318159222393 & -1.81915922239328 \tabularnewline
17 & 87.972 & 91.3499182879486 & -3.37791828794862 \tabularnewline
18 & 96.091 & 92.0472934473969 & 4.04370655260309 \tabularnewline
19 & 101.846 & 99.3447777269212 & 2.5012222730788 \tabularnewline
20 & 115.652 & 114.937655783108 & 0.714344216892131 \tabularnewline
21 & 91.269 & 93.7631588809647 & -2.49415888096471 \tabularnewline
22 & 100.911 & 95.0193515632329 & 5.89164843676713 \tabularnewline
23 & 105.248 & 104.558196195227 & 0.689803804773342 \tabularnewline
24 & 118.681 & 116.963001708157 & 1.71799829184259 \tabularnewline
\hline
\end{tabular}
%Source: https://freestatistics.org/blog/index.php?pk=107496&T=4

[TABLE]
[ROW][C]Multiple Linear Regression - Actuals, Interpolation, and Residuals[/C][/ROW]
[ROW][C]Time or Index[/C][C]Actuals[/C][C]InterpolationForecast[/C][C]ResidualsPrediction Error[/C][/ROW]
[ROW][C]1[/C][C]77.405[/C][C]84.3755651692512[/C][C]-6.97056516925118[/C][/ROW]
[ROW][C]2[/C][C]85.056[/C][C]81.8808512074346[/C][C]3.17514879256539[/C][/ROW]
[ROW][C]3[/C][C]90.088[/C][C]89.403061050349[/C][C]0.684938949650912[/C][/ROW]
[ROW][C]4[/C][C]99.285[/C][C]102.664851965232[/C][C]-3.37985196523167[/C][/ROW]
[ROW][C]5[/C][C]80.428[/C][C]83.9351456003011[/C][C]-3.5071456003011[/C][/ROW]
[ROW][C]6[/C][C]88.017[/C][C]83.7817065199413[/C][C]4.23529348005869[/C][/ROW]
[ROW][C]7[/C][C]93.489[/C][C]90.9372394386848[/C][C]2.55176056131524[/C][/ROW]
[ROW][C]8[/C][C]103.961[/C][C]104.799326369580[/C][C]-0.838326369580266[/C][/ROW]
[ROW][C]9[/C][C]82.591[/C][C]85.9657882529537[/C][C]-3.37478825295371[/C][/ROW]
[ROW][C]10[/C][C]90.913[/C][C]85.958352830721[/C][C]4.95464716927902[/C][/ROW]
[ROW][C]11[/C][C]96.787[/C][C]94.3934438677785[/C][C]2.39355613222147[/C][/ROW]
[ROW][C]12[/C][C]106.045[/C][C]106.102270480676[/C][C]-0.0572704806764468[/C][/ROW]
[ROW][C]13[/C][C]84.752[/C][C]86.7655163108118[/C][C]-2.01351631081186[/C][/ROW]
[ROW][C]14[/C][C]94.173[/C][C]98.4135844779564[/C][C]-4.24058447795645[/C][/ROW]
[ROW][C]15[/C][C]97.733[/C][C]99.2137836429785[/C][C]-1.48078364297851[/C][/ROW]
[ROW][C]16[/C][C]108.499[/C][C]110.318159222393[/C][C]-1.81915922239328[/C][/ROW]
[ROW][C]17[/C][C]87.972[/C][C]91.3499182879486[/C][C]-3.37791828794862[/C][/ROW]
[ROW][C]18[/C][C]96.091[/C][C]92.0472934473969[/C][C]4.04370655260309[/C][/ROW]
[ROW][C]19[/C][C]101.846[/C][C]99.3447777269212[/C][C]2.5012222730788[/C][/ROW]
[ROW][C]20[/C][C]115.652[/C][C]114.937655783108[/C][C]0.714344216892131[/C][/ROW]
[ROW][C]21[/C][C]91.269[/C][C]93.7631588809647[/C][C]-2.49415888096471[/C][/ROW]
[ROW][C]22[/C][C]100.911[/C][C]95.0193515632329[/C][C]5.89164843676713[/C][/ROW]
[ROW][C]23[/C][C]105.248[/C][C]104.558196195227[/C][C]0.689803804773342[/C][/ROW]
[ROW][C]24[/C][C]118.681[/C][C]116.963001708157[/C][C]1.71799829184259[/C][/ROW]
[/TABLE]
Source: https://freestatistics.org/blog/index.php?pk=107496&T=4

Globally Unique Identifier (entire table): ba.freestatistics.org/blog/index.php?pk=107496&T=4

As an alternative you can also use a QR Code:  

The GUIDs for individual cells are displayed in the table below:

Multiple Linear Regression - Actuals, Interpolation, and Residuals
Time or IndexActualsInterpolationForecastResidualsPrediction Error
177.40584.3755651692512-6.97056516925118
285.05681.88085120743463.17514879256539
390.08889.4030610503490.684938949650912
499.285102.664851965232-3.37985196523167
580.42883.9351456003011-3.5071456003011
688.01783.78170651994134.23529348005869
793.48990.93723943868482.55176056131524
8103.961104.799326369580-0.838326369580266
982.59185.9657882529537-3.37478825295371
1090.91385.9583528307214.95464716927902
1196.78794.39344386777852.39355613222147
12106.045106.102270480676-0.0572704806764468
1384.75286.7655163108118-2.01351631081186
1494.17398.4135844779564-4.24058447795645
1597.73399.2137836429785-1.48078364297851
16108.499110.318159222393-1.81915922239328
1787.97291.3499182879486-3.37791828794862
1896.09192.04729344739694.04370655260309
19101.84699.34477772692122.5012222730788
20115.652114.9376557831080.714344216892131
2191.26993.7631588809647-2.49415888096471
22100.91195.01935156323295.89164843676713
23105.248104.5581961952270.689803804773342
24118.681116.9630017081571.71799829184259


Parameters (Session):
par1 = 2 ; par2 = Do not include Seasonal Dummies ; par3 = No Linear Trend ;
Parameters (R input):
par1 = 2 ; par2 = Do not include Seasonal Dummies ; par3 = No Linear Trend ;
R code (references can be found in the software module):
library(lattice)
library(lmtest)
n25 <- 25 #minimum number of obs. for Goldfeld-Quandt test
par1 <- as.numeric(par1)
x <- t(y)
k <- length(x[1,])
n <- length(x[,1])
x1 <- cbind(x[,par1], x[,1:k!=par1])
mycolnames <- c(colnames(x)[par1], colnames(x)[1:k!=par1])
colnames(x1) <- mycolnames #colnames(x)[par1]
x <- x1
if (par3 == 'First Differences'){
x2 <- array(0, dim=c(n-1,k), dimnames=list(1:(n-1), paste('(1-B)',colnames(x),sep='')))
for (i in 1:n-1) {
for (j in 1:k) {
x2[i,j] <- x[i+1,j] - x[i,j]
}
}
x <- x2
}
if (par2 == 'Include Monthly Dummies'){
x2 <- array(0, dim=c(n,11), dimnames=list(1:n, paste('M', seq(1:11), sep ='')))
for (i in 1:11){
x2[seq(i,n,12),i] <- 1
}
x <- cbind(x, x2)
}
if (par2 == 'Include Quarterly Dummies'){
x2 <- array(0, dim=c(n,3), dimnames=list(1:n, paste('Q', seq(1:3), sep ='')))
for (i in 1:3){
x2[seq(i,n,4),i] <- 1
}
x <- cbind(x, x2)
}
k <- length(x[1,])
if (par3 == 'Linear Trend'){
x <- cbind(x, c(1:n))
colnames(x)[k+1] <- 't'
}
x
k <- length(x[1,])
df <- as.data.frame(x)
(mylm <- lm(df))
(mysum <- summary(mylm))
if (n > n25) {
kp3 <- k + 3
nmkm3 <- n - k - 3
gqarr <- array(NA, dim=c(nmkm3-kp3+1,3))
numgqtests <- 0
numsignificant1 <- 0
numsignificant5 <- 0
numsignificant10 <- 0
for (mypoint in kp3:nmkm3) {
j <- 0
numgqtests <- numgqtests + 1
for (myalt in c('greater', 'two.sided', 'less')) {
j <- j + 1
gqarr[mypoint-kp3+1,j] <- gqtest(mylm, point=mypoint, alternative=myalt)$p.value
}
if (gqarr[mypoint-kp3+1,2] < 0.01) numsignificant1 <- numsignificant1 + 1
if (gqarr[mypoint-kp3+1,2] < 0.05) numsignificant5 <- numsignificant5 + 1
if (gqarr[mypoint-kp3+1,2] < 0.10) numsignificant10 <- numsignificant10 + 1
}
gqarr
}
bitmap(file='test0.png')
plot(x[,1], type='l', main='Actuals and Interpolation', ylab='value of Actuals and Interpolation (dots)', xlab='time or index')
points(x[,1]-mysum$resid)
grid()
dev.off()
bitmap(file='test1.png')
plot(mysum$resid, type='b', pch=19, main='Residuals', ylab='value of Residuals', xlab='time or index')
grid()
dev.off()
bitmap(file='test2.png')
hist(mysum$resid, main='Residual Histogram', xlab='values of Residuals')
grid()
dev.off()
bitmap(file='test3.png')
densityplot(~mysum$resid,col='black',main='Residual Density Plot', xlab='values of Residuals')
dev.off()
bitmap(file='test4.png')
qqnorm(mysum$resid, main='Residual Normal Q-Q Plot')
qqline(mysum$resid)
grid()
dev.off()
(myerror <- as.ts(mysum$resid))
bitmap(file='test5.png')
dum <- cbind(lag(myerror,k=1),myerror)
dum
dum1 <- dum[2:length(myerror),]
dum1
z <- as.data.frame(dum1)
z
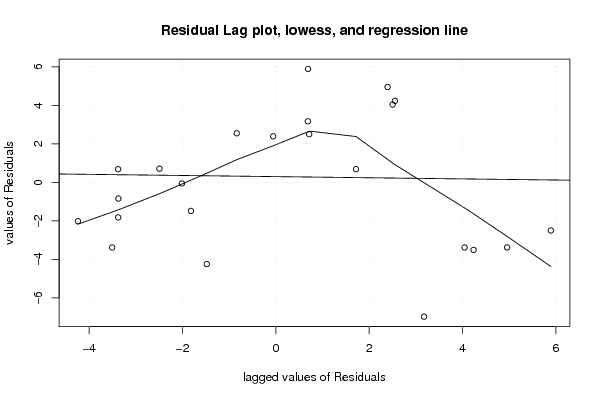
plot(z,main=paste('Residual Lag plot, lowess, and regression line'), ylab='values of Residuals', xlab='lagged values of Residuals')
lines(lowess(z))
abline(lm(z))
grid()
dev.off()
bitmap(file='test6.png')
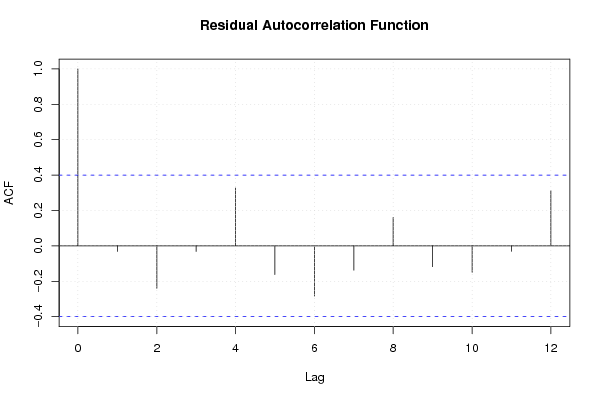
acf(mysum$resid, lag.max=length(mysum$resid)/2, main='Residual Autocorrelation Function')
grid()
dev.off()
bitmap(file='test7.png')
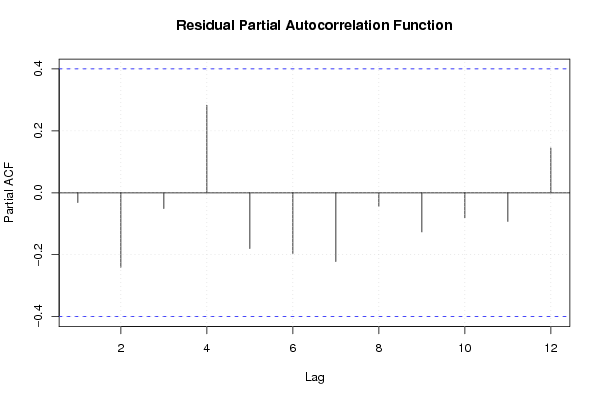
pacf(mysum$resid, lag.max=length(mysum$resid)/2, main='Residual Partial Autocorrelation Function')
grid()
dev.off()
bitmap(file='test8.png')
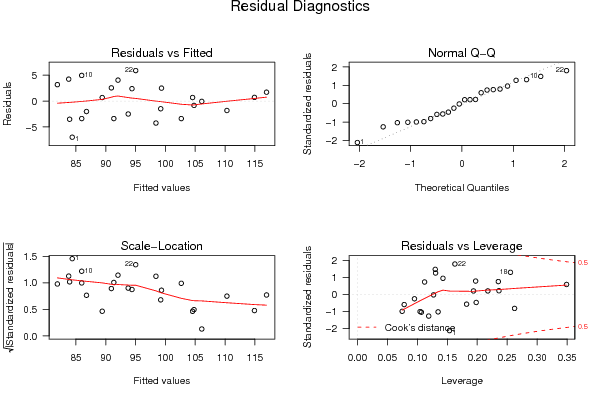
opar <- par(mfrow = c(2,2), oma = c(0, 0, 1.1, 0))
plot(mylm, las = 1, sub='Residual Diagnostics')
par(opar)
dev.off()
if (n > n25) {
bitmap(file='test9.png')
plot(kp3:nmkm3,gqarr[,2], main='Goldfeld-Quandt test',ylab='2-sided p-value',xlab='breakpoint')
grid()
dev.off()
}
load(file='createtable')
a<-table.start()
a<-table.row.start(a)
a<-table.element(a, 'Multiple Linear Regression - Estimated Regression Equation', 1, TRUE)
a<-table.row.end(a)
myeq <- colnames(x)[1]
myeq <- paste(myeq, '[t] = ', sep='')
for (i in 1:k){
if (mysum$coefficients[i,1] > 0) myeq <- paste(myeq, '+', '')
myeq <- paste(myeq, mysum$coefficients[i,1], sep=' ')
if (rownames(mysum$coefficients)[i] != '(Intercept)') {
myeq <- paste(myeq, rownames(mysum$coefficients)[i], sep='')
if (rownames(mysum$coefficients)[i] != 't') myeq <- paste(myeq, '[t]', sep='')
}
}
myeq <- paste(myeq, ' + e[t]')
a<-table.row.start(a)
a<-table.element(a, myeq)
a<-table.row.end(a)
a<-table.end(a)
table.save(a,file='mytable1.tab')
a<-table.start()
a<-table.row.start(a)
a<-table.element(a,hyperlink('ols1.htm','Multiple Linear Regression - Ordinary Least Squares',''), 6, TRUE)
a<-table.row.end(a)
a<-table.row.start(a)
a<-table.element(a,'Variable',header=TRUE)
a<-table.element(a,'Parameter',header=TRUE)
a<-table.element(a,'S.D.',header=TRUE)
a<-table.element(a,'T-STAT
H0: parameter = 0',header=TRUE)
a<-table.element(a,'2-tail p-value',header=TRUE)
a<-table.element(a,'1-tail p-value',header=TRUE)
a<-table.row.end(a)
for (i in 1:k){
a<-table.row.start(a)
a<-table.element(a,rownames(mysum$coefficients)[i],header=TRUE)
a<-table.element(a,mysum$coefficients[i,1])
a<-table.element(a, round(mysum$coefficients[i,2],6))
a<-table.element(a, round(mysum$coefficients[i,3],4))
a<-table.element(a, round(mysum$coefficients[i,4],6))
a<-table.element(a, round(mysum$coefficients[i,4]/2,6))
a<-table.row.end(a)
}
a<-table.end(a)
table.save(a,file='mytable2.tab')
a<-table.start()
a<-table.row.start(a)
a<-table.element(a, 'Multiple Linear Regression - Regression Statistics', 2, TRUE)
a<-table.row.end(a)
a<-table.row.start(a)
a<-table.element(a, 'Multiple R',1,TRUE)
a<-table.element(a, sqrt(mysum$r.squared))
a<-table.row.end(a)
a<-table.row.start(a)
a<-table.element(a, 'R-squared',1,TRUE)
a<-table.element(a, mysum$r.squared)
a<-table.row.end(a)
a<-table.row.start(a)
a<-table.element(a, 'Adjusted R-squared',1,TRUE)
a<-table.element(a, mysum$adj.r.squared)
a<-table.row.end(a)
a<-table.row.start(a)
a<-table.element(a, 'F-TEST (value)',1,TRUE)
a<-table.element(a, mysum$fstatistic[1])
a<-table.row.end(a)
a<-table.row.start(a)
a<-table.element(a, 'F-TEST (DF numerator)',1,TRUE)
a<-table.element(a, mysum$fstatistic[2])
a<-table.row.end(a)
a<-table.row.start(a)
a<-table.element(a, 'F-TEST (DF denominator)',1,TRUE)
a<-table.element(a, mysum$fstatistic[3])
a<-table.row.end(a)
a<-table.row.start(a)
a<-table.element(a, 'p-value',1,TRUE)
a<-table.element(a, 1-pf(mysum$fstatistic[1],mysum$fstatistic[2],mysum$fstatistic[3]))
a<-table.row.end(a)
a<-table.row.start(a)
a<-table.element(a, 'Multiple Linear Regression - Residual Statistics', 2, TRUE)
a<-table.row.end(a)
a<-table.row.start(a)
a<-table.element(a, 'Residual Standard Deviation',1,TRUE)
a<-table.element(a, mysum$sigma)
a<-table.row.end(a)
a<-table.row.start(a)
a<-table.element(a, 'Sum Squared Residuals',1,TRUE)
a<-table.element(a, sum(myerror*myerror))
a<-table.row.end(a)
a<-table.end(a)
table.save(a,file='mytable3.tab')
a<-table.start()
a<-table.row.start(a)
a<-table.element(a, 'Multiple Linear Regression - Actuals, Interpolation, and Residuals', 4, TRUE)
a<-table.row.end(a)
a<-table.row.start(a)
a<-table.element(a, 'Time or Index', 1, TRUE)
a<-table.element(a, 'Actuals', 1, TRUE)
a<-table.element(a, 'Interpolation
Forecast', 1, TRUE)
a<-table.element(a, 'Residuals
Prediction Error', 1, TRUE)
a<-table.row.end(a)
for (i in 1:n) {
a<-table.row.start(a)
a<-table.element(a,i, 1, TRUE)
a<-table.element(a,x[i])
a<-table.element(a,x[i]-mysum$resid[i])
a<-table.element(a,mysum$resid[i])
a<-table.row.end(a)
}
a<-table.end(a)
table.save(a,file='mytable4.tab')
if (n > n25) {
a<-table.start()
a<-table.row.start(a)
a<-table.element(a,'Goldfeld-Quandt test for Heteroskedasticity',4,TRUE)
a<-table.row.end(a)
a<-table.row.start(a)
a<-table.element(a,'p-values',header=TRUE)
a<-table.element(a,'Alternative Hypothesis',3,header=TRUE)
a<-table.row.end(a)
a<-table.row.start(a)
a<-table.element(a,'breakpoint index',header=TRUE)
a<-table.element(a,'greater',header=TRUE)
a<-table.element(a,'2-sided',header=TRUE)
a<-table.element(a,'less',header=TRUE)
a<-table.row.end(a)
for (mypoint in kp3:nmkm3) {
a<-table.row.start(a)
a<-table.element(a,mypoint,header=TRUE)
a<-table.element(a,gqarr[mypoint-kp3+1,1])
a<-table.element(a,gqarr[mypoint-kp3+1,2])
a<-table.element(a,gqarr[mypoint-kp3+1,3])
a<-table.row.end(a)
}
a<-table.end(a)
table.save(a,file='mytable5.tab')
a<-table.start()
a<-table.row.start(a)
a<-table.element(a,'Meta Analysis of Goldfeld-Quandt test for Heteroskedasticity',4,TRUE)
a<-table.row.end(a)
a<-table.row.start(a)
a<-table.element(a,'Description',header=TRUE)
a<-table.element(a,'# significant tests',header=TRUE)
a<-table.element(a,'% significant tests',header=TRUE)
a<-table.element(a,'OK/NOK',header=TRUE)
a<-table.row.end(a)
a<-table.row.start(a)
a<-table.element(a,'1% type I error level',header=TRUE)
a<-table.element(a,numsignificant1)
a<-table.element(a,numsignificant1/numgqtests)
if (numsignificant1/numgqtests < 0.01) dum <- 'OK' else dum <- 'NOK'
a<-table.element(a,dum)
a<-table.row.end(a)
a<-table.row.start(a)
a<-table.element(a,'5% type I error level',header=TRUE)
a<-table.element(a,numsignificant5)
a<-table.element(a,numsignificant5/numgqtests)
if (numsignificant5/numgqtests < 0.05) dum <- 'OK' else dum <- 'NOK'
a<-table.element(a,dum)
a<-table.row.end(a)
a<-table.row.start(a)
a<-table.element(a,'10% type I error level',header=TRUE)
a<-table.element(a,numsignificant10)
a<-table.element(a,numsignificant10/numgqtests)
if (numsignificant10/numgqtests < 0.1) dum <- 'OK' else dum <- 'NOK'
a<-table.element(a,dum)
a<-table.row.end(a)
a<-table.end(a)
table.save(a,file='mytable6.tab')
}