Free Statistics

of Irreproducible Research!

Author's title

Author*The author of this computation has been verified*
R Software Modulerwasp_histogram.wasp
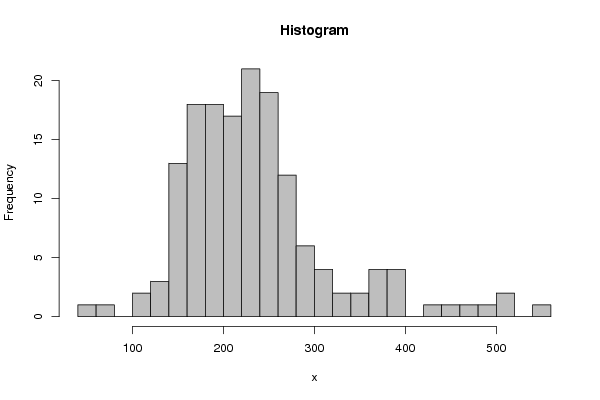
Title produced by softwareHistogram
Date of computationFri, 10 Dec 2010 10:17:29 +0000
Cite this page as followsStatistical Computations at FreeStatistics.org, Office for Research Development and Education, URL https://freestatistics.org/blog/index.php?v=date/2010/Dec/10/t1291976214vje84so509emnme.htm/, Retrieved Mon, 29 Apr 2024 13:00:53 +0000
Statistical Computations at FreeStatistics.org, Office for Research Development and Education, URL https://freestatistics.org/blog/index.php?pk=107494, Retrieved Mon, 29 Apr 2024 13:00:53 +0000
QR Codes:

Original text written by user:
IsPrivate?No (this computation is public)
User-defined keywords
Estimated Impact104
Family? (F = Feedback message, R = changed R code, M = changed R Module, P = changed Parameters, D = changed Data)
-     [Histogram] [Bad example of Hi...] [2010-09-25 09:28:23] [b98453cac15ba1066b407e146608df68]
- R PD  [Histogram] [Histogram - Tijd] [2010-11-12 15:36:51] [97ad38b1c3b35a5feca8b85f7bc7b3ff]
- R  D      [Histogram] [histogram] [2010-12-10 10:17:29] [7b4029fa8534fd52dfa7d68267386cff] [Current]
Feedback Forum

Post a new message
Dataseries X:
237.588
164.083
278.261
220.36
253.967
422.31
136.921
143.495
189.785
219.529
217.761
221.754
159.854
209.464
174.283
154.55
153.024
162.49
154.462
249.671
259.473
155.337
151.289
276.614
188.214
181.098
240.898
244.551
250.238
183.129
310.331
281.942
230.343
161.563
392.527
1077.414
248.275
557.386
731.874
301.429
226.36
215.018
157.672
219.118
213.019
390.642
157.124
227.652
239.266
506.343
149.219
213.351
174.517
172.531
320.656
305.011
266.495
361.511
361.019
382.187
196.763
273.212
186.397
294.205
364.685
230.501
217.51
262.297
169.246
260.428
348.187
512.937
164.496
111.187
169.999
240.187
187.158
194.096
265.846
283.319
356.938
240.802
326.662
249.266
277.368
394.618
235.686
227.641
159.593
268.866
206.466
233.064
133.824
486.783
228.859
155.238
2042.451
205.218
373.648
229.151
199.156
234.41
56.519
289.239
199.227
274.513
174.499
217.714
239.717
241.529
155.561
204.107
745.97
241.772
110.267
186.58
227.906
197.518
254.094
173.942
294.42
211.924
262.479
193.495
165.972
237.352
205.814
227.526
250.439
470.849
176.469
298.691
193.922
212.422
203.284
240.56
445.327
248.984
174.44
165.024
249.681
238.312
250.437
174.75
4941.633
138.936
203.181
187.747
270.95
307.688
184.477
230.916
187.286
169.376
182.838
176.081
248.056
235.24
76.347


Summary of computational transaction
Raw Inputview raw input (R code)
Raw Outputview raw output of R engine
Computing time2 seconds
R Server'RServer@AstonUniversity' @ vre.aston.ac.uk

\begin{tabular}{lllllllll}
\hline
Summary of computational transaction \tabularnewline
Raw Input & view raw input (R code)  \tabularnewline
Raw Output & view raw output of R engine  \tabularnewline
Computing time & 2 seconds \tabularnewline
R Server & 'RServer@AstonUniversity' @ vre.aston.ac.uk \tabularnewline
\hline
\end{tabular}
%Source: https://freestatistics.org/blog/index.php?pk=107494&T=0

[TABLE]
[ROW][C]Summary of computational transaction[/C][/ROW]
[ROW][C]Raw Input[/C][C]view raw input (R code) [/C][/ROW]
[ROW][C]Raw Output[/C][C]view raw output of R engine [/C][/ROW]
[ROW][C]Computing time[/C][C]2 seconds[/C][/ROW]
[ROW][C]R Server[/C][C]'RServer@AstonUniversity' @ vre.aston.ac.uk[/C][/ROW]
[/TABLE]
Source: https://freestatistics.org/blog/index.php?pk=107494&T=0

Globally Unique Identifier (entire table): ba.freestatistics.org/blog/index.php?pk=107494&T=0

As an alternative you can also use a QR Code:  

The GUIDs for individual cells are displayed in the table below:

Summary of computational transaction
Raw Inputview raw input (R code)
Raw Outputview raw output of R engine
Computing time2 seconds
R Server'RServer@AstonUniversity' @ vre.aston.ac.uk


Frequency Table (Histogram)
BinsMidpointAbs. FrequencyRel. FrequencyCumul. Rel. Freq.Density
[40,60[5010.0064940.0064940.000325
[60,80[7010.0064940.0129870.000325
[80,100[90000.0129870
[100,120[11020.0129870.0259740.000649
[120,140[13030.0194810.0454550.000974
[140,160[150130.0844160.129870.004221
[160,180[170180.1168830.2467530.005844
[180,200[190180.1168830.3636360.005844
[200,220[210170.110390.4740260.005519
[220,240[230210.1363640.610390.006818
[240,260[250190.1233770.7337660.006169
[260,280[270120.0779220.8116880.003896
[280,300[29060.0389610.8506490.001948
[300,320[31040.0259740.8766230.001299
[320,340[33020.0129870.889610.000649
[340,360[35020.0129870.9025970.000649
[360,380[37040.0259740.9285710.001299
[380,400[39040.0259740.9545450.001299
[400,420[410000.9545450
[420,440[43010.0064940.9610390.000325
[440,460[45010.0064940.9675320.000325
[460,480[47010.0064940.9740260.000325
[480,500[49010.0064940.9805190.000325
[500,520[51020.0129870.9935060.000649
[520,540[530000.9935060
[540,560]55010.00649410.000325

\begin{tabular}{lllllllll}
\hline
Frequency Table (Histogram) \tabularnewline
Bins & Midpoint & Abs. Frequency & Rel. Frequency & Cumul. Rel. Freq. & Density \tabularnewline
[40,60[ & 50 & 1 & 0.006494 & 0.006494 & 0.000325 \tabularnewline
[60,80[ & 70 & 1 & 0.006494 & 0.012987 & 0.000325 \tabularnewline
[80,100[ & 90 & 0 & 0 & 0.012987 & 0 \tabularnewline
[100,120[ & 110 & 2 & 0.012987 & 0.025974 & 0.000649 \tabularnewline
[120,140[ & 130 & 3 & 0.019481 & 0.045455 & 0.000974 \tabularnewline
[140,160[ & 150 & 13 & 0.084416 & 0.12987 & 0.004221 \tabularnewline
[160,180[ & 170 & 18 & 0.116883 & 0.246753 & 0.005844 \tabularnewline
[180,200[ & 190 & 18 & 0.116883 & 0.363636 & 0.005844 \tabularnewline
[200,220[ & 210 & 17 & 0.11039 & 0.474026 & 0.005519 \tabularnewline
[220,240[ & 230 & 21 & 0.136364 & 0.61039 & 0.006818 \tabularnewline
[240,260[ & 250 & 19 & 0.123377 & 0.733766 & 0.006169 \tabularnewline
[260,280[ & 270 & 12 & 0.077922 & 0.811688 & 0.003896 \tabularnewline
[280,300[ & 290 & 6 & 0.038961 & 0.850649 & 0.001948 \tabularnewline
[300,320[ & 310 & 4 & 0.025974 & 0.876623 & 0.001299 \tabularnewline
[320,340[ & 330 & 2 & 0.012987 & 0.88961 & 0.000649 \tabularnewline
[340,360[ & 350 & 2 & 0.012987 & 0.902597 & 0.000649 \tabularnewline
[360,380[ & 370 & 4 & 0.025974 & 0.928571 & 0.001299 \tabularnewline
[380,400[ & 390 & 4 & 0.025974 & 0.954545 & 0.001299 \tabularnewline
[400,420[ & 410 & 0 & 0 & 0.954545 & 0 \tabularnewline
[420,440[ & 430 & 1 & 0.006494 & 0.961039 & 0.000325 \tabularnewline
[440,460[ & 450 & 1 & 0.006494 & 0.967532 & 0.000325 \tabularnewline
[460,480[ & 470 & 1 & 0.006494 & 0.974026 & 0.000325 \tabularnewline
[480,500[ & 490 & 1 & 0.006494 & 0.980519 & 0.000325 \tabularnewline
[500,520[ & 510 & 2 & 0.012987 & 0.993506 & 0.000649 \tabularnewline
[520,540[ & 530 & 0 & 0 & 0.993506 & 0 \tabularnewline
[540,560] & 550 & 1 & 0.006494 & 1 & 0.000325 \tabularnewline
\hline
\end{tabular}
%Source: https://freestatistics.org/blog/index.php?pk=107494&T=1

[TABLE]
[ROW][C]Frequency Table (Histogram)[/C][/ROW]
[ROW][C]Bins[/C][C]Midpoint[/C][C]Abs. Frequency[/C][C]Rel. Frequency[/C][C]Cumul. Rel. Freq.[/C][C]Density[/C][/ROW]
[ROW][C][40,60[[/C][C]50[/C][C]1[/C][C]0.006494[/C][C]0.006494[/C][C]0.000325[/C][/ROW]
[ROW][C][60,80[[/C][C]70[/C][C]1[/C][C]0.006494[/C][C]0.012987[/C][C]0.000325[/C][/ROW]
[ROW][C][80,100[[/C][C]90[/C][C]0[/C][C]0[/C][C]0.012987[/C][C]0[/C][/ROW]
[ROW][C][100,120[[/C][C]110[/C][C]2[/C][C]0.012987[/C][C]0.025974[/C][C]0.000649[/C][/ROW]
[ROW][C][120,140[[/C][C]130[/C][C]3[/C][C]0.019481[/C][C]0.045455[/C][C]0.000974[/C][/ROW]
[ROW][C][140,160[[/C][C]150[/C][C]13[/C][C]0.084416[/C][C]0.12987[/C][C]0.004221[/C][/ROW]
[ROW][C][160,180[[/C][C]170[/C][C]18[/C][C]0.116883[/C][C]0.246753[/C][C]0.005844[/C][/ROW]
[ROW][C][180,200[[/C][C]190[/C][C]18[/C][C]0.116883[/C][C]0.363636[/C][C]0.005844[/C][/ROW]
[ROW][C][200,220[[/C][C]210[/C][C]17[/C][C]0.11039[/C][C]0.474026[/C][C]0.005519[/C][/ROW]
[ROW][C][220,240[[/C][C]230[/C][C]21[/C][C]0.136364[/C][C]0.61039[/C][C]0.006818[/C][/ROW]
[ROW][C][240,260[[/C][C]250[/C][C]19[/C][C]0.123377[/C][C]0.733766[/C][C]0.006169[/C][/ROW]
[ROW][C][260,280[[/C][C]270[/C][C]12[/C][C]0.077922[/C][C]0.811688[/C][C]0.003896[/C][/ROW]
[ROW][C][280,300[[/C][C]290[/C][C]6[/C][C]0.038961[/C][C]0.850649[/C][C]0.001948[/C][/ROW]
[ROW][C][300,320[[/C][C]310[/C][C]4[/C][C]0.025974[/C][C]0.876623[/C][C]0.001299[/C][/ROW]
[ROW][C][320,340[[/C][C]330[/C][C]2[/C][C]0.012987[/C][C]0.88961[/C][C]0.000649[/C][/ROW]
[ROW][C][340,360[[/C][C]350[/C][C]2[/C][C]0.012987[/C][C]0.902597[/C][C]0.000649[/C][/ROW]
[ROW][C][360,380[[/C][C]370[/C][C]4[/C][C]0.025974[/C][C]0.928571[/C][C]0.001299[/C][/ROW]
[ROW][C][380,400[[/C][C]390[/C][C]4[/C][C]0.025974[/C][C]0.954545[/C][C]0.001299[/C][/ROW]
[ROW][C][400,420[[/C][C]410[/C][C]0[/C][C]0[/C][C]0.954545[/C][C]0[/C][/ROW]
[ROW][C][420,440[[/C][C]430[/C][C]1[/C][C]0.006494[/C][C]0.961039[/C][C]0.000325[/C][/ROW]
[ROW][C][440,460[[/C][C]450[/C][C]1[/C][C]0.006494[/C][C]0.967532[/C][C]0.000325[/C][/ROW]
[ROW][C][460,480[[/C][C]470[/C][C]1[/C][C]0.006494[/C][C]0.974026[/C][C]0.000325[/C][/ROW]
[ROW][C][480,500[[/C][C]490[/C][C]1[/C][C]0.006494[/C][C]0.980519[/C][C]0.000325[/C][/ROW]
[ROW][C][500,520[[/C][C]510[/C][C]2[/C][C]0.012987[/C][C]0.993506[/C][C]0.000649[/C][/ROW]
[ROW][C][520,540[[/C][C]530[/C][C]0[/C][C]0[/C][C]0.993506[/C][C]0[/C][/ROW]
[ROW][C][540,560][/C][C]550[/C][C]1[/C][C]0.006494[/C][C]1[/C][C]0.000325[/C][/ROW]
[/TABLE]
Source: https://freestatistics.org/blog/index.php?pk=107494&T=1

Globally Unique Identifier (entire table): ba.freestatistics.org/blog/index.php?pk=107494&T=1

As an alternative you can also use a QR Code:  

The GUIDs for individual cells are displayed in the table below:

Frequency Table (Histogram)
BinsMidpointAbs. FrequencyRel. FrequencyCumul. Rel. Freq.Density
[40,60[5010.0064940.0064940.000325
[60,80[7010.0064940.0129870.000325
[80,100[90000.0129870
[100,120[11020.0129870.0259740.000649
[120,140[13030.0194810.0454550.000974
[140,160[150130.0844160.129870.004221
[160,180[170180.1168830.2467530.005844
[180,200[190180.1168830.3636360.005844
[200,220[210170.110390.4740260.005519
[220,240[230210.1363640.610390.006818
[240,260[250190.1233770.7337660.006169
[260,280[270120.0779220.8116880.003896
[280,300[29060.0389610.8506490.001948
[300,320[31040.0259740.8766230.001299
[320,340[33020.0129870.889610.000649
[340,360[35020.0129870.9025970.000649
[360,380[37040.0259740.9285710.001299
[380,400[39040.0259740.9545450.001299
[400,420[410000.9545450
[420,440[43010.0064940.9610390.000325
[440,460[45010.0064940.9675320.000325
[460,480[47010.0064940.9740260.000325
[480,500[49010.0064940.9805190.000325
[500,520[51020.0129870.9935060.000649
[520,540[530000.9935060
[540,560]55010.00649410.000325


Parameters (Session):
par1 = 30 ; par2 = grey ; par3 = FALSE ; par4 = Unknown ;
Parameters (R input):
par1 = 30 ; par2 = grey ; par3 = FALSE ; par4 = Unknown ;
R code (references can be found in the software module):
x<-x[x<700]
par1 <- as.numeric(par1)
if (par3 == 'TRUE') par3 <- TRUE
if (par3 == 'FALSE') par3 <- FALSE
if (par4 == 'Unknown') par1 <- as.numeric(par1)
if (par4 == 'Interval/Ratio') par1 <- as.numeric(par1)
if (par4 == '3-point Likert') par1 <- c(1:3 - 0.5, 3.5)
if (par4 == '4-point Likert') par1 <- c(1:4 - 0.5, 4.5)
if (par4 == '5-point Likert') par1 <- c(1:5 - 0.5, 5.5)
if (par4 == '6-point Likert') par1 <- c(1:6 - 0.5, 6.5)
if (par4 == '7-point Likert') par1 <- c(1:7 - 0.5, 7.5)
if (par4 == '8-point Likert') par1 <- c(1:8 - 0.5, 8.5)
if (par4 == '9-point Likert') par1 <- c(1:9 - 0.5, 9.5)
if (par4 == '10-point Likert') par1 <- c(1:10 - 0.5, 10.5)
bitmap(file='test1.png')
if(is.numeric(x[1])) {
if (is.na(par1)) {
myhist<-hist(x,col=par2,main=main,xlab=xlab,right=par3)
} else {
if (par1 < 0) par1 <- 3
if (par1 > 50) par1 <- 50
myhist<-hist(x,breaks=par1,col=par2,main=main,xlab=xlab,right=par3)
}
} else {
plot(mytab <- table(x),col=par2,main='Frequency Plot',xlab=xlab,ylab='Absolute Frequency')
}
dev.off()
if(is.numeric(x[1])) {
myhist
n <- length(x)
load(file='createtable')
a<-table.start()
a<-table.row.start(a)
a<-table.element(a,hyperlink('histogram.htm','Frequency Table (Histogram)',''),6,TRUE)
a<-table.row.end(a)
a<-table.row.start(a)
a<-table.element(a,'Bins',header=TRUE)
a<-table.element(a,'Midpoint',header=TRUE)
a<-table.element(a,'Abs. Frequency',header=TRUE)
a<-table.element(a,'Rel. Frequency',header=TRUE)
a<-table.element(a,'Cumul. Rel. Freq.',header=TRUE)
a<-table.element(a,'Density',header=TRUE)
a<-table.row.end(a)
crf <- 0
if (par3 == FALSE) mybracket <- '[' else mybracket <- ']'
mynumrows <- (length(myhist$breaks)-1)
for (i in 1:mynumrows) {
a<-table.row.start(a)
if (i == 1)
dum <- paste('[',myhist$breaks[i],sep='')
else
dum <- paste(mybracket,myhist$breaks[i],sep='')
dum <- paste(dum,myhist$breaks[i+1],sep=',')
if (i==mynumrows)
dum <- paste(dum,']',sep='')
else
dum <- paste(dum,mybracket,sep='')
a<-table.element(a,dum,header=TRUE)
a<-table.element(a,myhist$mids[i])
a<-table.element(a,myhist$counts[i])
rf <- myhist$counts[i]/n
crf <- crf + rf
a<-table.element(a,round(rf,6))
a<-table.element(a,round(crf,6))
a<-table.element(a,round(myhist$density[i],6))
a<-table.row.end(a)
}
a<-table.end(a)
table.save(a,file='mytable.tab')
} else {
mytab
reltab <- mytab / sum(mytab)
n <- length(mytab)
load(file='createtable')
a<-table.start()
a<-table.row.start(a)
a<-table.element(a,'Frequency Table (Categorical Data)',3,TRUE)
a<-table.row.end(a)
a<-table.row.start(a)
a<-table.element(a,'Category',header=TRUE)
a<-table.element(a,'Abs. Frequency',header=TRUE)
a<-table.element(a,'Rel. Frequency',header=TRUE)
a<-table.row.end(a)
for (i in 1:n) {
a<-table.row.start(a)
a<-table.element(a,labels(mytab)$x[i],header=TRUE)
a<-table.element(a,mytab[i])
a<-table.element(a,round(reltab[i],4))
a<-table.row.end(a)
}
a<-table.end(a)
table.save(a,file='mytable1.tab')
}