Free Statistics

of Irreproducible Research!

Author's title

Author*The author of this computation has been verified*
R Software ModulePatrick.Wessarwasp_pairs.wasp
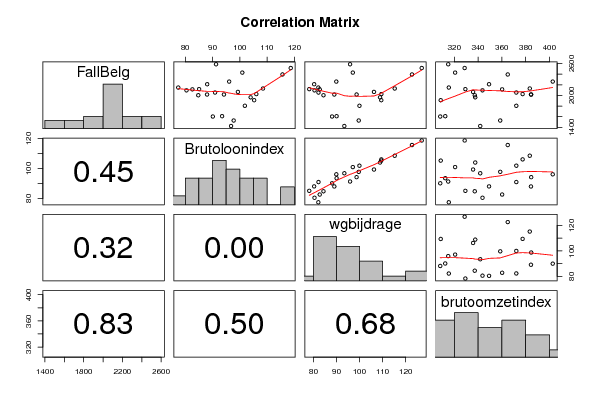
Title produced by softwareKendall tau Correlation Matrix
Date of computationFri, 10 Dec 2010 09:48:05 +0000
Cite this page as followsStatistical Computations at FreeStatistics.org, Office for Research Development and Education, URL https://freestatistics.org/blog/index.php?v=date/2010/Dec/10/t1291974592zcz0pr1rlynky5u.htm/, Retrieved Mon, 29 Apr 2024 14:08:10 +0000
Statistical Computations at FreeStatistics.org, Office for Research Development and Education, URL https://freestatistics.org/blog/index.php?pk=107474, Retrieved Mon, 29 Apr 2024 14:08:10 +0000
QR Codes:

Original text written by user:
IsPrivate?No (this computation is public)
User-defined keywords
Estimated Impact148
Family? (F = Feedback message, R = changed R code, M = changed R Module, P = changed Parameters, D = changed Data)
-     [Kendall tau Correlation Matrix] [] [2010-12-05 17:44:33] [b98453cac15ba1066b407e146608df68]
-   PD    [Kendall tau Correlation Matrix] [Faillissementen B...] [2010-12-10 09:48:05] [9003764b6a75599accb6eea9154ba195] [Current]
Feedback Forum

Post a new message
Dataseries X:
2148	77.405	82.145	315.4
2118	85.056	78.213	329.3
1603	90.088	88.099	308.2
2066	99.285	106.25	335.8
2095	80.428	80.487	343.7
2210	88.017	80.336	349.2
1609	93.489	90.065	312.4
1964	103.961	108.888	337.6
2114	82.591	82.747	360.2
2054	90.913	82.213	372.1
1424	96.787	93.41	341.8
2025	106.045	109.465	377.4
2003	84.752	84.373	337.2
2017	94.173	98.715	384.6
1528	97.733	99.646	358.6
2130	108.499	115.239	383.4
2017	87.972	89.082	384.4
2260	96.091	89.934	402.7
1805	101.846	99.957	372.1
2394	115.652	122.717	364.9
2586	91.269	95.895	314.9
2429	100.911	97.085	320.7
1910	105.248	109.414	308.6
2515	118.681	126.945	328.7


Summary of computational transaction
Raw Inputview raw input (R code)
Raw Outputview raw output of R engine
Computing time19 seconds
R Server'George Udny Yule' @ 72.249.76.132

\begin{tabular}{lllllllll}
\hline
Summary of computational transaction \tabularnewline
Raw Input & view raw input (R code)  \tabularnewline
Raw Output & view raw output of R engine  \tabularnewline
Computing time & 19 seconds \tabularnewline
R Server & 'George Udny Yule' @ 72.249.76.132 \tabularnewline
\hline
\end{tabular}
%Source: https://freestatistics.org/blog/index.php?pk=107474&T=0

[TABLE]
[ROW][C]Summary of computational transaction[/C][/ROW]
[ROW][C]Raw Input[/C][C]view raw input (R code) [/C][/ROW]
[ROW][C]Raw Output[/C][C]view raw output of R engine [/C][/ROW]
[ROW][C]Computing time[/C][C]19 seconds[/C][/ROW]
[ROW][C]R Server[/C][C]'George Udny Yule' @ 72.249.76.132[/C][/ROW]
[/TABLE]
Source: https://freestatistics.org/blog/index.php?pk=107474&T=0

Globally Unique Identifier (entire table): ba.freestatistics.org/blog/index.php?pk=107474&T=0

As an alternative you can also use a QR Code:  

The GUIDs for individual cells are displayed in the table below:

Summary of computational transaction
Raw Inputview raw input (R code)
Raw Outputview raw output of R engine
Computing time19 seconds
R Server'George Udny Yule' @ 72.249.76.132


Correlations for all pairs of data series (method=pearson)
FallBelgBrutoloonindexwgbijdragebrutoomzetindex
FallBelg10.1620.2130.047
Brutoloonindex0.16210.9470.145
wgbijdrage0.2130.94710.087
brutoomzetindex0.0470.1450.0871

\begin{tabular}{lllllllll}
\hline
Correlations for all pairs of data series (method=pearson) \tabularnewline
  & FallBelg & Brutoloonindex & wgbijdrage & brutoomzetindex \tabularnewline
FallBelg & 1 & 0.162 & 0.213 & 0.047 \tabularnewline
Brutoloonindex & 0.162 & 1 & 0.947 & 0.145 \tabularnewline
wgbijdrage & 0.213 & 0.947 & 1 & 0.087 \tabularnewline
brutoomzetindex & 0.047 & 0.145 & 0.087 & 1 \tabularnewline
\hline
\end{tabular}
%Source: https://freestatistics.org/blog/index.php?pk=107474&T=1

[TABLE]
[ROW][C]Correlations for all pairs of data series (method=pearson)[/C][/ROW]
[ROW][C] [/C][C]FallBelg[/C][C]Brutoloonindex[/C][C]wgbijdrage[/C][C]brutoomzetindex[/C][/ROW]
[ROW][C]FallBelg[/C][C]1[/C][C]0.162[/C][C]0.213[/C][C]0.047[/C][/ROW]
[ROW][C]Brutoloonindex[/C][C]0.162[/C][C]1[/C][C]0.947[/C][C]0.145[/C][/ROW]
[ROW][C]wgbijdrage[/C][C]0.213[/C][C]0.947[/C][C]1[/C][C]0.087[/C][/ROW]
[ROW][C]brutoomzetindex[/C][C]0.047[/C][C]0.145[/C][C]0.087[/C][C]1[/C][/ROW]
[/TABLE]
Source: https://freestatistics.org/blog/index.php?pk=107474&T=1

Globally Unique Identifier (entire table): ba.freestatistics.org/blog/index.php?pk=107474&T=1

As an alternative you can also use a QR Code:  

The GUIDs for individual cells are displayed in the table below:

Correlations for all pairs of data series (method=pearson)
FallBelgBrutoloonindexwgbijdragebrutoomzetindex
FallBelg10.1620.2130.047
Brutoloonindex0.16210.9470.145
wgbijdrage0.2130.94710.087
brutoomzetindex0.0470.1450.0871


Correlations for all pairs of data series with p-values
pairPearson rSpearman rhoKendall tau
FallBelg;Brutoloonindex0.16240.03650.0472
p-value(0.4484)(0.8654)(0.747)
FallBelg;wgbijdrage0.2128-0.0035-0.0036
p-value(0.3182)(0.9871)(0.9802)
FallBelg;brutoomzetindex0.0470.03830
p-value(0.8273)(0.8591)(1)
Brutoloonindex;wgbijdrage0.94670.93910.8188
p-value(0)(0)(0)
Brutoloonindex;brutoomzetindex0.14510.11870.0762
p-value(0.4987)(0.5806)(0.6023)
wgbijdrage;brutoomzetindex0.08730.09920.069
p-value(0.6849)(0.6448)(0.6373)

\begin{tabular}{lllllllll}
\hline
Correlations for all pairs of data series with p-values \tabularnewline
pair & Pearson r & Spearman rho & Kendall tau \tabularnewline
FallBelg;Brutoloonindex & 0.1624 & 0.0365 & 0.0472 \tabularnewline
p-value & (0.4484) & (0.8654) & (0.747) \tabularnewline
FallBelg;wgbijdrage & 0.2128 & -0.0035 & -0.0036 \tabularnewline
p-value & (0.3182) & (0.9871) & (0.9802) \tabularnewline
FallBelg;brutoomzetindex & 0.047 & 0.0383 & 0 \tabularnewline
p-value & (0.8273) & (0.8591) & (1) \tabularnewline
Brutoloonindex;wgbijdrage & 0.9467 & 0.9391 & 0.8188 \tabularnewline
p-value & (0) & (0) & (0) \tabularnewline
Brutoloonindex;brutoomzetindex & 0.1451 & 0.1187 & 0.0762 \tabularnewline
p-value & (0.4987) & (0.5806) & (0.6023) \tabularnewline
wgbijdrage;brutoomzetindex & 0.0873 & 0.0992 & 0.069 \tabularnewline
p-value & (0.6849) & (0.6448) & (0.6373) \tabularnewline
\hline
\end{tabular}
%Source: https://freestatistics.org/blog/index.php?pk=107474&T=2

[TABLE]
[ROW][C]Correlations for all pairs of data series with p-values[/C][/ROW]
[ROW][C]pair[/C][C]Pearson r[/C][C]Spearman rho[/C][C]Kendall tau[/C][/ROW]
[ROW][C]FallBelg;Brutoloonindex[/C][C]0.1624[/C][C]0.0365[/C][C]0.0472[/C][/ROW]
[ROW][C]p-value[/C][C](0.4484)[/C][C](0.8654)[/C][C](0.747)[/C][/ROW]
[ROW][C]FallBelg;wgbijdrage[/C][C]0.2128[/C][C]-0.0035[/C][C]-0.0036[/C][/ROW]
[ROW][C]p-value[/C][C](0.3182)[/C][C](0.9871)[/C][C](0.9802)[/C][/ROW]
[ROW][C]FallBelg;brutoomzetindex[/C][C]0.047[/C][C]0.0383[/C][C]0[/C][/ROW]
[ROW][C]p-value[/C][C](0.8273)[/C][C](0.8591)[/C][C](1)[/C][/ROW]
[ROW][C]Brutoloonindex;wgbijdrage[/C][C]0.9467[/C][C]0.9391[/C][C]0.8188[/C][/ROW]
[ROW][C]p-value[/C][C](0)[/C][C](0)[/C][C](0)[/C][/ROW]
[ROW][C]Brutoloonindex;brutoomzetindex[/C][C]0.1451[/C][C]0.1187[/C][C]0.0762[/C][/ROW]
[ROW][C]p-value[/C][C](0.4987)[/C][C](0.5806)[/C][C](0.6023)[/C][/ROW]
[ROW][C]wgbijdrage;brutoomzetindex[/C][C]0.0873[/C][C]0.0992[/C][C]0.069[/C][/ROW]
[ROW][C]p-value[/C][C](0.6849)[/C][C](0.6448)[/C][C](0.6373)[/C][/ROW]
[/TABLE]
Source: https://freestatistics.org/blog/index.php?pk=107474&T=2

Globally Unique Identifier (entire table): ba.freestatistics.org/blog/index.php?pk=107474&T=2

As an alternative you can also use a QR Code:  

The GUIDs for individual cells are displayed in the table below:

Correlations for all pairs of data series with p-values
pairPearson rSpearman rhoKendall tau
FallBelg;Brutoloonindex0.16240.03650.0472
p-value(0.4484)(0.8654)(0.747)
FallBelg;wgbijdrage0.2128-0.0035-0.0036
p-value(0.3182)(0.9871)(0.9802)
FallBelg;brutoomzetindex0.0470.03830
p-value(0.8273)(0.8591)(1)
Brutoloonindex;wgbijdrage0.94670.93910.8188
p-value(0)(0)(0)
Brutoloonindex;brutoomzetindex0.14510.11870.0762
p-value(0.4987)(0.5806)(0.6023)
wgbijdrage;brutoomzetindex0.08730.09920.069
p-value(0.6849)(0.6448)(0.6373)


Parameters (Session):
par1 = pearson ;
Parameters (R input):
par1 = pearson ;
R code (references can be found in the software module):
panel.tau <- function(x, y, digits=2, prefix='', cex.cor)
{
usr <- par('usr'); on.exit(par(usr))
par(usr = c(0, 1, 0, 1))
rr <- cor.test(x, y, method=par1)
r <- round(rr$p.value,2)
txt <- format(c(r, 0.123456789), digits=digits)[1]
txt <- paste(prefix, txt, sep='')
if(missing(cex.cor)) cex <- 0.5/strwidth(txt)
text(0.5, 0.5, txt, cex = cex)
}
panel.hist <- function(x, ...)
{
usr <- par('usr'); on.exit(par(usr))
par(usr = c(usr[1:2], 0, 1.5) )
h <- hist(x, plot = FALSE)
breaks <- h$breaks; nB <- length(breaks)
y <- h$counts; y <- y/max(y)
rect(breaks[-nB], 0, breaks[-1], y, col='grey', ...)
}
bitmap(file='test1.png')
pairs(t(y),diag.panel=panel.hist, upper.panel=panel.smooth, lower.panel=panel.tau, main=main)
dev.off()
load(file='createtable')
n <- length(y[,1])
n
a<-table.start()
a<-table.row.start(a)
a<-table.element(a,paste('Correlations for all pairs of data series (method=',par1,')',sep=''),n+1,TRUE)
a<-table.row.end(a)
a<-table.row.start(a)
a<-table.element(a,' ',header=TRUE)
for (i in 1:n) {
a<-table.element(a,dimnames(t(x))[[2]][i],header=TRUE)
}
a<-table.row.end(a)
for (i in 1:n) {
a<-table.row.start(a)
a<-table.element(a,dimnames(t(x))[[2]][i],header=TRUE)
for (j in 1:n) {
r <- cor.test(y[i,],y[j,],method=par1)
a<-table.element(a,round(r$estimate,3))
}
a<-table.row.end(a)
}
a<-table.end(a)
table.save(a,file='mytable.tab')
a<-table.start()
a<-table.row.start(a)
a<-table.element(a,'Correlations for all pairs of data series with p-values',4,TRUE)
a<-table.row.end(a)
a<-table.row.start(a)
a<-table.element(a,'pair',1,TRUE)
a<-table.element(a,'Pearson r',1,TRUE)
a<-table.element(a,'Spearman rho',1,TRUE)
a<-table.element(a,'Kendall tau',1,TRUE)
a<-table.row.end(a)
cor.test(y[1,],y[2,],method=par1)
for (i in 1:(n-1))
{
for (j in (i+1):n)
{
a<-table.row.start(a)
dum <- paste(dimnames(t(x))[[2]][i],';',dimnames(t(x))[[2]][j],sep='')
a<-table.element(a,dum,header=TRUE)
rp <- cor.test(y[i,],y[j,],method='pearson')
a<-table.element(a,round(rp$estimate,4))
rs <- cor.test(y[i,],y[j,],method='spearman')
a<-table.element(a,round(rs$estimate,4))
rk <- cor.test(y[i,],y[j,],method='kendall')
a<-table.element(a,round(rk$estimate,4))
a<-table.row.end(a)
a<-table.row.start(a)
a<-table.element(a,'p-value',header=T)
a<-table.element(a,paste('(',round(rp$p.value,4),')',sep=''))
a<-table.element(a,paste('(',round(rs$p.value,4),')',sep=''))
a<-table.element(a,paste('(',round(rk$p.value,4),')',sep=''))
a<-table.row.end(a)
}
}
a<-table.end(a)
table.save(a,file='mytable1.tab')