| Multiple Linear Regression - Estimated Regression Equation |
| HuurDVD[t] = + 83.1351258298301 -0.0934365930966516Cultuur[t] + 0.109135245038658Bioscoop[t] + 0.0869617581299381Schouwburg[t] + 0.0646540079085407EendagsA[t] + e[t] |
| Multiple Linear Regression - Ordinary Least Squares | |||||
| Variable | Parameter | S.D. | T-STAT H0: parameter = 0 | 2-tail p-value | 1-tail p-value |
| (Intercept) | 83.1351258298301 | 1.838159 | 45.2274 | 0 | 0 |
| Cultuur | -0.0934365930966516 | 0.09627 | -0.9706 | 0.336171 | 0.168085 |
| Bioscoop | 0.109135245038658 | 0.028887 | 3.7781 | 0.000402 | 0.000201 |
| Schouwburg | 0.0869617581299381 | 0.039463 | 2.2036 | 0.031919 | 0.015959 |
| EendagsA | 0.0646540079085407 | 0.05414 | 1.1942 | 0.237718 | 0.118859 |
| Multiple Linear Regression - Regression Statistics | |
| Multiple R | 0.937045913686147 |
| R-squared | 0.878055044355907 |
| Adjusted R-squared | 0.868851651477107 |
| F-TEST (value) | 95.4055809546664 |
| F-TEST (DF numerator) | 4 |
| F-TEST (DF denominator) | 53 |
| p-value | 0 |
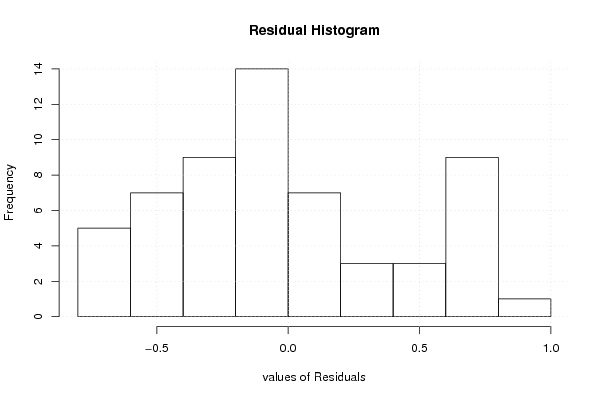
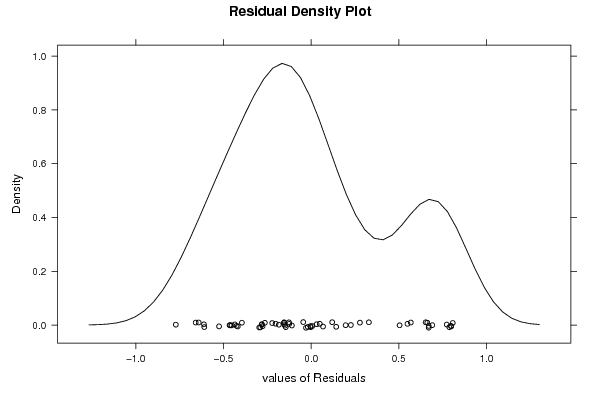
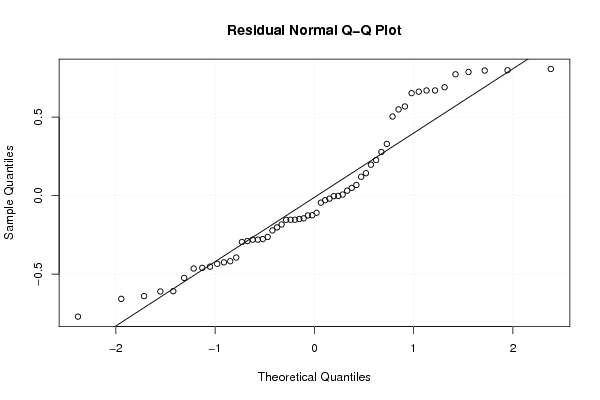
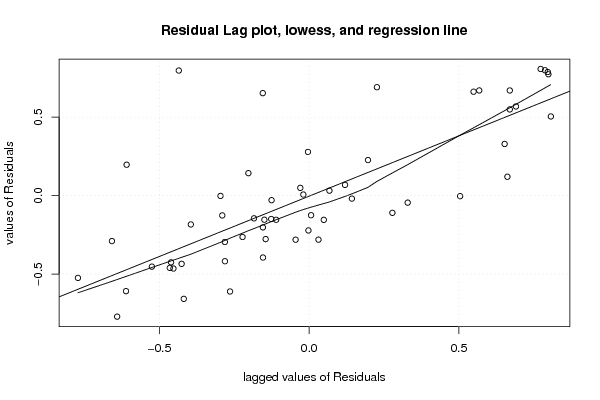
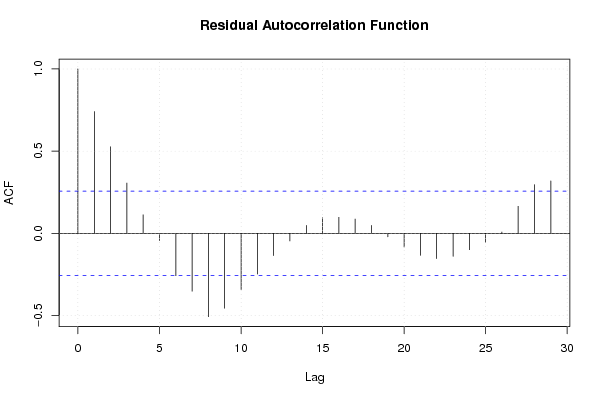
| Multiple Linear Regression - Residual Statistics | |
| Residual Standard Deviation | 0.458486156322067 |
| Sum Squared Residuals | 11.1411064435661 |
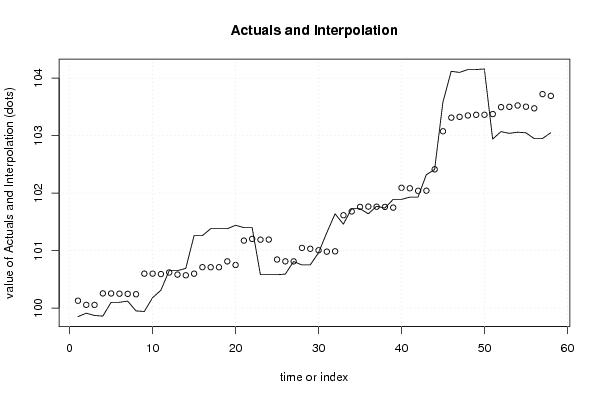
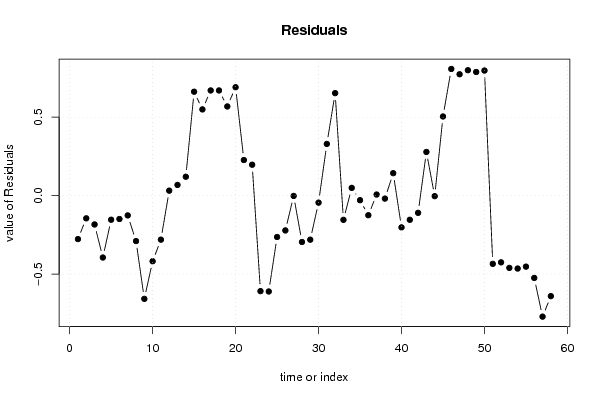
| Multiple Linear Regression - Actuals, Interpolation, and Residuals | |||
| Time or Index | Actuals | Interpolation Forecast | Residuals Prediction Error |
| 1 | 99.85 | 100.127198644296 | -0.277198644295529 |
| 2 | 99.91 | 100.054923388201 | -0.144923388200880 |
| 3 | 99.87 | 100.05398902227 | -0.183989022269906 |
| 4 | 99.86 | 100.254808616035 | -0.394808616034638 |
| 5 | 100.1 | 100.253874250104 | -0.153874250103675 |
| 6 | 100.1 | 100.249202420449 | -0.149202420448842 |
| 7 | 100.12 | 100.246399322656 | -0.126399322655933 |
| 8 | 99.95 | 100.239858761139 | -0.289858761139169 |
| 9 | 99.94 | 100.598234820220 | -0.658234820220197 |
| 10 | 100.18 | 100.598399359925 | -0.418399359925161 |
| 11 | 100.31 | 100.590924432477 | -0.280924432477434 |
| 12 | 100.65 | 100.618529769961 | 0.0314702300385115 |
| 13 | 100.65 | 100.582024750304 | 0.0679752496958729 |
| 14 | 100.69 | 100.569877993202 | 0.120122006798429 |
| 15 | 101.26 | 100.597647870391 | 0.662352129609404 |
| 16 | 101.26 | 100.710620701026 | 0.549379298974222 |
| 17 | 101.38 | 100.709686335095 | 0.670313664905178 |
| 18 | 101.38 | 100.709686335095 | 0.670313664905178 |
| 19 | 101.38 | 100.811683285281 | 0.568316714718751 |
| 20 | 101.44 | 100.749080767906 | 0.69091923209351 |
| 21 | 101.4 | 101.173418266467 | 0.226581733533075 |
| 22 | 101.4 | 101.203206308852 | 0.196793691148244 |
| 23 | 100.58 | 101.189190819887 | -0.609190819887265 |
| 24 | 100.58 | 101.191276963753 | -0.61127696375305 |
| 25 | 100.58 | 100.843892139959 | -0.263892139959382 |
| 26 | 100.59 | 100.812123698307 | -0.222123698306515 |
| 27 | 100.81 | 100.812123698307 | -0.00212369830651655 |
| 28 | 100.75 | 101.045748912167 | -0.295748912166995 |
| 29 | 100.75 | 101.031097923939 | -0.281097923939262 |
| 30 | 100.96 | 101.004935677872 | -0.0449356778722066 |
| 31 | 101.31 | 100.980642163667 | 0.329357836332932 |
| 32 | 101.64 | 100.986914071258 | 0.653085928741681 |
| 33 | 101.46 | 101.614542789084 | -0.154542789084159 |
| 34 | 101.73 | 101.68081642189 | 0.0491835781100019 |
| 35 | 101.73 | 101.759267024541 | -0.0292670245406264 |
| 36 | 101.64 | 101.765194746351 | -0.125194746350822 |
| 37 | 101.77 | 101.763326014489 | 0.0066739855111056 |
| 38 | 101.74 | 101.759170463506 | -0.0191704635056463 |
| 39 | 101.89 | 101.747023706403 | 0.142976293596923 |
| 40 | 101.89 | 102.092604916408 | -0.202604916407770 |
| 41 | 101.93 | 102.084195623029 | -0.154195623029064 |
| 42 | 101.93 | 102.039869890200 | -0.109869890199809 |
| 43 | 102.32 | 102.041738622062 | 0.278261377938245 |
| 44 | 102.41 | 102.413636260089 | -0.00363626008916682 |
| 45 | 103.58 | 103.075534563676 | 0.50446543632427 |
| 46 | 104.12 | 103.312619470698 | 0.807380529302485 |
| 47 | 104.1 | 103.326634959662 | 0.773365040337978 |
| 48 | 104.15 | 103.350809253276 | 0.79919074672451 |
| 49 | 104.15 | 103.362036750818 | 0.787963249181803 |
| 50 | 104.16 | 103.362851896158 | 0.79714810384248 |
| 51 | 102.94 | 103.375013759631 | -0.435013759631192 |
| 52 | 103.07 | 103.495529909975 | -0.425529909974759 |
| 53 | 103.04 | 103.500837238893 | -0.460837238892813 |
| 54 | 103.06 | 103.525041745249 | -0.465041745248511 |
| 55 | 103.05 | 103.502930935944 | -0.452930935944159 |
| 56 | 102.95 | 103.474899958015 | -0.524899958015158 |
| 57 | 102.95 | 103.721742832605 | -0.771742832605233 |
| 58 | 103.05 | 103.690908756883 | -0.640908756883344 |
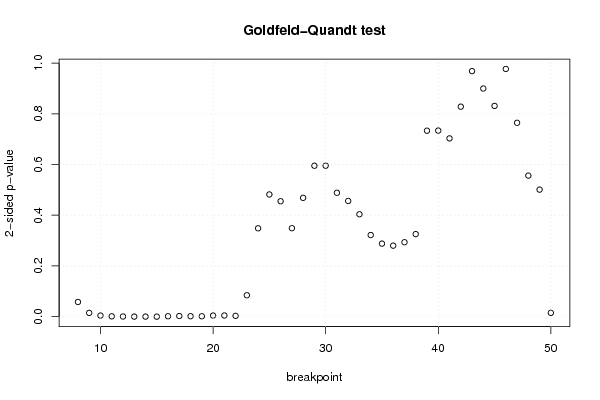
| Goldfeld-Quandt test for Heteroskedasticity | |||
| p-values | Alternative Hypothesis | ||
| breakpoint index | greater | 2-sided | less |
| 8 | 0.0289658713591797 | 0.0579317427183593 | 0.97103412864082 |
| 9 | 0.00746213064323157 | 0.0149242612864631 | 0.992537869356768 |
| 10 | 0.00216179362829080 | 0.00432358725658161 | 0.99783820637171 |
| 11 | 0.00063376116478035 | 0.0012675223295607 | 0.99936623883522 |
| 12 | 0.000282983811411905 | 0.000565967622823811 | 0.999717016188588 |
| 13 | 0.000106513456637936 | 0.000213026913275872 | 0.999893486543362 |
| 14 | 2.59918901128813e-05 | 5.19837802257625e-05 | 0.999974008109887 |
| 15 | 5.47678210960592e-06 | 1.09535642192118e-05 | 0.99999452321789 |
| 16 | 0.000770064060613216 | 0.00154012812122643 | 0.999229935939387 |
| 17 | 0.00119871914466579 | 0.00239743828933158 | 0.998801280855334 |
| 18 | 0.00087729561782457 | 0.00175459123564914 | 0.999122704382175 |
| 19 | 0.000778754016190083 | 0.00155750803238017 | 0.99922124598381 |
| 20 | 0.0021863964359172 | 0.0043727928718344 | 0.997813603564083 |
| 21 | 0.00230804787171213 | 0.00461609574342425 | 0.997691952128288 |
| 22 | 0.00159498883196763 | 0.00318997766393526 | 0.998405011168032 |
| 23 | 0.0422248428992797 | 0.0844496857985594 | 0.95777515710072 |
| 24 | 0.174225941550468 | 0.348451883100937 | 0.825774058449532 |
| 25 | 0.24101990674562 | 0.48203981349124 | 0.75898009325438 |
| 26 | 0.227601318898627 | 0.455202637797254 | 0.772398681101373 |
| 27 | 0.174439467581799 | 0.348878935163598 | 0.8255605324182 |
| 28 | 0.234329145405208 | 0.468658290810416 | 0.765670854594792 |
| 29 | 0.297638940656466 | 0.595277881312933 | 0.702361059343534 |
| 30 | 0.297691480171988 | 0.595382960343977 | 0.702308519828012 |
| 31 | 0.244284925505156 | 0.488569851010312 | 0.755715074494844 |
| 32 | 0.228159175735471 | 0.456318351470941 | 0.77184082426453 |
| 33 | 0.201929374191878 | 0.403858748383756 | 0.798070625808122 |
| 34 | 0.160903059470874 | 0.321806118941748 | 0.839096940529126 |
| 35 | 0.144052211664309 | 0.288104423328618 | 0.855947788335691 |
| 36 | 0.140024790897970 | 0.280049581795940 | 0.85997520910203 |
| 37 | 0.146776591626137 | 0.293553183252274 | 0.853223408373863 |
| 38 | 0.162806012368132 | 0.325612024736265 | 0.837193987631868 |
| 39 | 0.633276099769395 | 0.733447800461209 | 0.366723900230605 |
| 40 | 0.633062812935343 | 0.733874374129313 | 0.366937187064656 |
| 41 | 0.648388781821508 | 0.703222436356984 | 0.351611218178492 |
| 42 | 0.585919113484092 | 0.828161773031816 | 0.414080886515908 |
| 43 | 0.515764917684114 | 0.968470164631771 | 0.484235082315886 |
| 44 | 0.449894036454031 | 0.899788072908061 | 0.55010596354597 |
| 45 | 0.584384989232597 | 0.831230021534806 | 0.415615010767403 |
| 46 | 0.488499046882027 | 0.976998093764055 | 0.511500953117973 |
| 47 | 0.382325755874989 | 0.764651511749978 | 0.617674244125011 |
| 48 | 0.27816375170928 | 0.55632750341856 | 0.72183624829072 |
| 49 | 0.250508298317221 | 0.501016596634442 | 0.749491701682779 |
| 50 | 0.992493813993596 | 0.0150123720128081 | 0.00750618600640404 |
| Meta Analysis of Goldfeld-Quandt test for Heteroskedasticity | |||
| Description | # significant tests | % significant tests | OK/NOK |
| 1% type I error level | 13 | 0.302325581395349 | NOK |
| 5% type I error level | 15 | 0.348837209302326 | NOK |
| 10% type I error level | 17 | 0.395348837209302 | NOK |