| Multiple Linear Regression - Estimated Regression Equation |
| geboortes[t] = + 7081.79410330141 + 199.675838880545x[t] + 0.256058903274212lag[t] -734.10162351551M1[t] -192.21603292373M2[t] -31.7260810906937M3[t] -978.949523039809M4[t] + 207.941772420757M5[t] -418.172883089657M6[t] -147.288559126565M7[t] -242.175514609628M8[t] + 340.128057574066M9[t] + 66.8844528782936M10[t] -129.762106052565M11[t] + 4.30039216255459t + e[t] |
| Multiple Linear Regression - Ordinary Least Squares | |||||
| Variable | Parameter | S.D. | T-STAT H0: parameter = 0 | 2-tail p-value | 1-tail p-value |
| (Intercept) | 7081.79410330141 | 1203.095097 | 5.8863 | 0 | 0 |
| x | 199.675838880545 | 138.369988 | 1.4431 | 0.154293 | 0.077146 |
| lag | 0.256058903274212 | 0.126882 | 2.0181 | 0.048137 | 0.024069 |
| M1 | -734.10162351551 | 155.946063 | -4.7074 | 1.6e-05 | 8e-06 |
| M2 | -192.21603292373 | 175.080661 | -1.0979 | 0.276721 | 0.138361 |
| M3 | -31.7260810906937 | 167.455871 | -0.1895 | 0.850383 | 0.425192 |
| M4 | -978.949523039809 | 163.047635 | -6.0041 | 0 | 0 |
| M5 | 207.941772420757 | 199.972477 | 1.0399 | 0.302651 | 0.151326 |
| M6 | -418.172883089657 | 162.226857 | -2.5777 | 0.012464 | 0.006232 |
| M7 | -147.288559126565 | 167.357157 | -0.8801 | 0.382384 | 0.191192 |
| M8 | -242.175514609628 | 162.848266 | -1.4871 | 0.142307 | 0.071154 |
| M9 | 340.128057574066 | 163.568861 | 2.0794 | 0.041934 | 0.020967 |
| M10 | 66.8844528782936 | 167.376058 | 0.3996 | 0.69089 | 0.345445 |
| M11 | -129.762106052565 | 163.666672 | -0.7928 | 0.431046 | 0.215523 |
| t | 4.30039216255459 | 3.219944 | 1.3355 | 0.186826 | 0.093413 |
| Multiple Linear Regression - Regression Statistics | |
| Multiple R | 0.868784961568442 |
| R-squared | 0.754787309447479 |
| Adjusted R-squared | 0.696601247282474 |
| F-TEST (value) | 12.9719606614216 |
| F-TEST (DF numerator) | 14 |
| F-TEST (DF denominator) | 59 |
| p-value | 3.44391182238724e-13 |
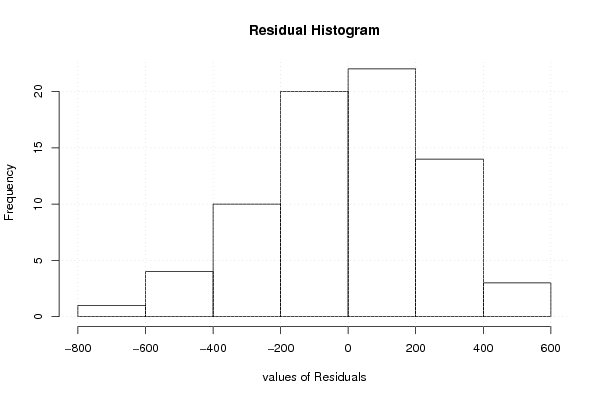
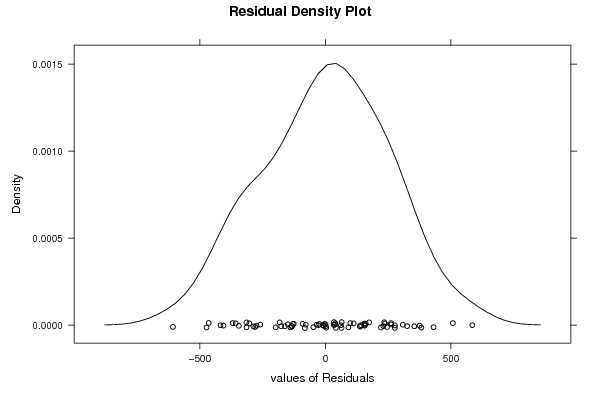
| Multiple Linear Regression - Residual Statistics | |
| Residual Standard Deviation | 278.921965516086 |
| Sum Squared Residuals | 4590050.30799405 |
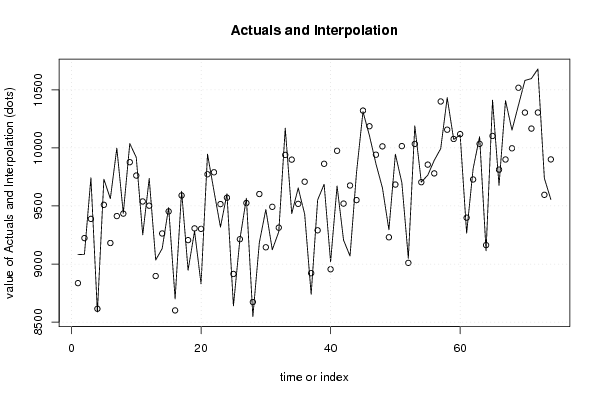
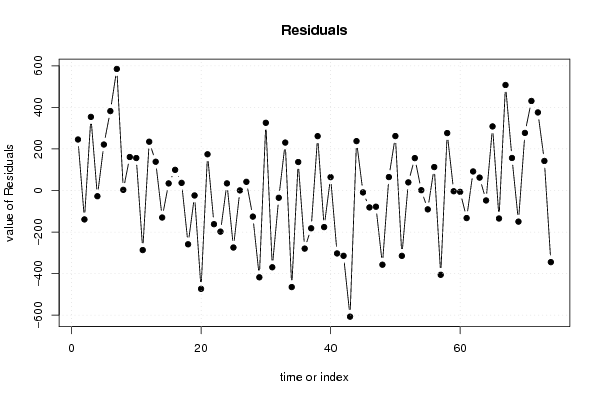
| Multiple Linear Regression - Actuals, Interpolation, and Residuals | |||
| Time or Index | Actuals | Interpolation Forecast | Residuals Prediction Error |
| 1 | 9081 | 8835.76423370832 | 245.235766291681 |
| 2 | 9084 | 9223.4497553359 | -139.449755335909 |
| 3 | 9743 | 9389.00827604132 | 353.991723958677 |
| 4 | 8587 | 8614.82804351247 | -27.8280435124665 |
| 5 | 9731 | 9510.0156389506 | 220.984361049401 |
| 6 | 9563 | 9181.13276094844 | 381.867239051562 |
| 7 | 9998 | 9413.29958132402 | 584.700418675982 |
| 8 | 9437 | 9434.09864092779 | 2.90135907220952 |
| 9 | 10038 | 9877.0535605372 | 160.946439462794 |
| 10 | 9918 | 9762.00174887179 | 155.998251128210 |
| 11 | 9252 | 9538.92851371058 | -286.92851371058 |
| 12 | 9737 | 9502.45578234507 | 234.544217654925 |
| 13 | 9035 | 8896.84311908011 | 138.156880919888 |
| 14 | 9133 | 9263.27575173595 | -130.275751735950 |
| 15 | 9487 | 9453.15986825241 | 33.8401317475862 |
| 16 | 8700 | 8600.88167022492 | 99.1183297750763 |
| 17 | 9627 | 9590.55500097124 | 36.4449990287601 |
| 18 | 8947 | 9206.10734095858 | -259.107340958575 |
| 19 | 9283 | 9307.17200285776 | -24.1720028577578 |
| 20 | 8829 | 9302.62123103738 | -473.621231037384 |
| 21 | 9947 | 9772.97445329714 | 174.025546702860 |
| 22 | 9628 | 9790.3050946245 | -162.305094624492 |
| 23 | 9318 | 9516.27613771171 | -198.276137711714 |
| 24 | 9605 | 9570.96037591183 | 34.039624088172 |
| 25 | 8640 | 8914.64804979857 | -274.648049798572 |
| 26 | 9214 | 9213.7371908933 | 0.262809106708132 |
| 27 | 9567 | 9525.50534536828 | 41.4946546317199 |
| 28 | 8547 | 8672.97108843752 | -125.971088437516 |
| 29 | 9185 | 9602.98269472094 | -417.982694720941 |
| 30 | 9470 | 9144.53401166203 | 325.465988337971 |
| 31 | 9123 | 9492.69551522082 | -369.695515220825 |
| 32 | 9278 | 9313.25651246417 | -35.2565124641656 |
| 33 | 10170 | 9939.54960681792 | 230.450393182083 |
| 34 | 9434 | 9899.0109360053 | -465.010936005296 |
| 35 | 9655 | 9518.20541642717 | 136.794583572828 |
| 36 | 9429 | 9708.8569322659 | -279.856932265892 |
| 37 | 8739 | 8921.18638877297 | -182.186388772965 |
| 38 | 9552 | 9290.6917282681 | 261.308271731906 |
| 39 | 9687 | 9863.33379950616 | -176.333799506163 |
| 40 | 9019 | 8954.97870166162 | 64.0212983383791 |
| 41 | 9672 | 9975.12304189757 | -303.123041897568 |
| 42 | 9206 | 9520.51524238777 | -314.515242387769 |
| 43 | 9069 | 9676.37650958763 | -607.376509587633 |
| 44 | 9788 | 9550.70987651856 | 237.290123481442 |
| 45 | 10312 | 10321.4201923190 | -9.42019231896413 |
| 46 | 10105 | 10186.6518451014 | -81.6518451014336 |
| 47 | 9863 | 9941.30148535537 | -78.3014853553676 |
| 48 | 9656 | 10013.3977289781 | -357.397728978128 |
| 49 | 9295 | 9230.59230464741 | 64.4076953525887 |
| 50 | 9946 | 9684.34102331976 | 261.658976680245 |
| 51 | 9701 | 10015.8257133469 | -314.825713346858 |
| 52 | 9049 | 9010.16823225811 | 38.8317677418850 |
| 53 | 10190 | 10034.4095149465 | 155.590485053550 |
| 54 | 9706 | 9704.75846023447 | 1.24153976553372 |
| 55 | 9765 | 9856.0106671754 | -91.0106671753942 |
| 56 | 9893 | 9780.53157914806 | 112.468420851936 |
| 57 | 9994 | 10399.9110831134 | -405.911083113411 |
| 58 | 10433 | 10156.8298198109 | 276.170180189110 |
| 59 | 10073 | 10076.8935115800 | -3.89351157996405 |
| 60 | 10112 | 10118.7748046164 | -6.77480461636765 |
| 61 | 9266 | 9398.9598704911 | -132.959870491107 |
| 62 | 9820 | 9728.52002107546 | 91.4799789245418 |
| 63 | 10097 | 10035.1669974850 | 61.833002515038 |
| 64 | 9115 | 9163.17226390536 | -48.172263905358 |
| 65 | 10411 | 10102.9141085132 | 308.085891486797 |
| 66 | 9678 | 9812.95218380872 | -134.952183808722 |
| 67 | 10408 | 9900.44572383437 | 507.554276165628 |
| 68 | 10153 | 9996.78215990404 | 156.217840095963 |
| 69 | 10368 | 10518.0911039154 | -150.091103915362 |
| 70 | 10581 | 10304.2005555861 | 276.799444413900 |
| 71 | 10597 | 10166.3949352152 | 430.605064784798 |
| 72 | 10680 | 10304.5543758827 | 375.44562411729 |
| 73 | 9738 | 9596.00603350151 | 141.993966498486 |
| 74 | 9556 | 9900.98452937154 | -344.984529371541 |
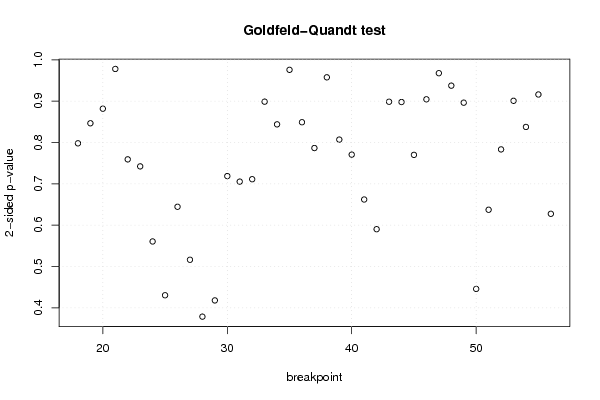
| Goldfeld-Quandt test for Heteroskedasticity | |||
| p-values | Alternative Hypothesis | ||
| breakpoint index | greater | 2-sided | less |
| 18 | 0.601048456298773 | 0.797903087402455 | 0.398951543701227 |
| 19 | 0.576799787266885 | 0.84640042546623 | 0.423200212733115 |
| 20 | 0.440821481427015 | 0.88164296285403 | 0.559178518572985 |
| 21 | 0.488904204779561 | 0.977808409559122 | 0.511095795220439 |
| 22 | 0.379550908392861 | 0.759101816785722 | 0.620449091607139 |
| 23 | 0.371049105313409 | 0.742098210626818 | 0.628950894686591 |
| 24 | 0.280236123846838 | 0.560472247693676 | 0.719763876153162 |
| 25 | 0.215175296162838 | 0.430350592325676 | 0.784824703837162 |
| 26 | 0.322214217779427 | 0.644428435558854 | 0.677785782220573 |
| 27 | 0.258085476252279 | 0.516170952504558 | 0.741914523747721 |
| 28 | 0.189285808382598 | 0.378571616765195 | 0.810714191617402 |
| 29 | 0.208923913388092 | 0.417847826776184 | 0.791076086611908 |
| 30 | 0.359307735700466 | 0.718615471400932 | 0.640692264299534 |
| 31 | 0.352608652816981 | 0.705217305633963 | 0.647391347183018 |
| 32 | 0.355519889703707 | 0.711039779407415 | 0.644480110296293 |
| 33 | 0.449329612416085 | 0.89865922483217 | 0.550670387583915 |
| 34 | 0.421891024381515 | 0.843782048763031 | 0.578108975618485 |
| 35 | 0.487844342441344 | 0.975688684882688 | 0.512155657558656 |
| 36 | 0.424459654612999 | 0.848919309225998 | 0.575540345387001 |
| 37 | 0.393236649574048 | 0.786473299148096 | 0.606763350425952 |
| 38 | 0.478779446656558 | 0.957558893313116 | 0.521220553343442 |
| 39 | 0.403439277915176 | 0.806878555830351 | 0.596560722084824 |
| 40 | 0.385267352580371 | 0.770534705160741 | 0.614732647419629 |
| 41 | 0.330987628244698 | 0.661975256489396 | 0.669012371755302 |
| 42 | 0.295076101604143 | 0.590152203208286 | 0.704923898395857 |
| 43 | 0.550774737717971 | 0.898450524564057 | 0.449225262282029 |
| 44 | 0.551112054652815 | 0.89777589069437 | 0.448887945347185 |
| 45 | 0.615021760661629 | 0.769956478676742 | 0.384978239338371 |
| 46 | 0.547805499680024 | 0.904389000639952 | 0.452194500319976 |
| 47 | 0.483776583639428 | 0.967553167278855 | 0.516223416360572 |
| 48 | 0.531308002244405 | 0.93738399551119 | 0.468691997755595 |
| 49 | 0.448105516358914 | 0.896211032717827 | 0.551894483641086 |
| 50 | 0.77718150729254 | 0.445636985414921 | 0.222818492707460 |
| 51 | 0.681409519135841 | 0.637180961728317 | 0.318590480864159 |
| 52 | 0.608411672510152 | 0.783176654979697 | 0.391588327489848 |
| 53 | 0.54962177601692 | 0.900756447966161 | 0.450378223983080 |
| 54 | 0.581268573085863 | 0.837462853828274 | 0.418731426914137 |
| 55 | 0.458015905572301 | 0.916031811144603 | 0.541984094427699 |
| 56 | 0.313709318150287 | 0.627418636300574 | 0.686290681849713 |
| Meta Analysis of Goldfeld-Quandt test for Heteroskedasticity | |||
| Description | # significant tests | % significant tests | OK/NOK |
| 1% type I error level | 0 | 0 | OK |
| 5% type I error level | 0 | 0 | OK |
| 10% type I error level | 0 | 0 | OK |