Free Statistics

of Irreproducible Research!

Author's title

Author*The author of this computation has been verified*
R Software Modulerwasp_autocorrelation.wasp
Title produced by software(Partial) Autocorrelation Function
Date of computationFri, 10 Dec 2010 02:37:36 +0000
Cite this page as followsStatistical Computations at FreeStatistics.org, Office for Research Development and Education, URL https://freestatistics.org/blog/index.php?v=date/2010/Dec/10/t1291948564ammrmoxw679q4he.htm/, Retrieved Mon, 29 Apr 2024 16:31:36 +0000
Statistical Computations at FreeStatistics.org, Office for Research Development and Education, URL https://freestatistics.org/blog/index.php?pk=107436, Retrieved Mon, 29 Apr 2024 16:31:36 +0000
QR Codes:

Original text written by user:
IsPrivate?No (this computation is public)
User-defined keywords
Estimated Impact165
Family? (F = Feedback message, R = changed R code, M = changed R Module, P = changed Parameters, D = changed Data)
-     [Univariate Data Series] [web traffic] [2010-10-19 15:13:07] [b98453cac15ba1066b407e146608df68]
- RMP   [(Partial) Autocorrelation Function] [Traffic] [2010-11-29 09:54:26] [b98453cac15ba1066b407e146608df68]
-   PD    [(Partial) Autocorrelation Function] [ACF] [2010-12-04 08:39:47] [c1605865773cc027e55b238d879a644c]
-   P         [(Partial) Autocorrelation Function] [PR - WS 9 - verbe...] [2010-12-10 02:37:36] [fca744d17b21beb005bf086e7071b2bb] [Current]
Feedback Forum

Post a new message
Dataseries X:
16198.9
16554.2
19554.2
15903.8
18003.8
18329.6
16260.7
14851.9
18174.1
18406.6
18466.5
16016.5
17428.5
17167.2
19630
17183.6
18344.7
19301.4
18147.5
16192.9
18374.4
20515.2
18957.2
16471.5
18746.8
19009.5
19211.2
20547.7
19325.8
20605.5
20056.9
16141.4
20359.8
19711.6
15638.6
14384.5
13855.6
14308.3
15290.6
14423.8
13779.7
15686.3
14733.8
12522.5
16189.4
16059.1
16007.1
15806.8
15160
15692.1
18908.9
16969.9
16997.5
19858.9
17681.2


Summary of computational transaction
Raw Inputview raw input (R code)
Raw Outputview raw output of R engine
Computing time1 seconds
R Server'RServer@AstonUniversity' @ vre.aston.ac.uk

\begin{tabular}{lllllllll}
\hline
Summary of computational transaction \tabularnewline
Raw Input & view raw input (R code)  \tabularnewline
Raw Output & view raw output of R engine  \tabularnewline
Computing time & 1 seconds \tabularnewline
R Server & 'RServer@AstonUniversity' @ vre.aston.ac.uk \tabularnewline
\hline
\end{tabular}
%Source: https://freestatistics.org/blog/index.php?pk=107436&T=0

[TABLE]
[ROW][C]Summary of computational transaction[/C][/ROW]
[ROW][C]Raw Input[/C][C]view raw input (R code) [/C][/ROW]
[ROW][C]Raw Output[/C][C]view raw output of R engine [/C][/ROW]
[ROW][C]Computing time[/C][C]1 seconds[/C][/ROW]
[ROW][C]R Server[/C][C]'RServer@AstonUniversity' @ vre.aston.ac.uk[/C][/ROW]
[/TABLE]
Source: https://freestatistics.org/blog/index.php?pk=107436&T=0

Globally Unique Identifier (entire table): ba.freestatistics.org/blog/index.php?pk=107436&T=0

As an alternative you can also use a QR Code:  

The GUIDs for individual cells are displayed in the table below:

Summary of computational transaction
Raw Inputview raw input (R code)
Raw Outputview raw output of R engine
Computing time1 seconds
R Server'RServer@AstonUniversity' @ vre.aston.ac.uk


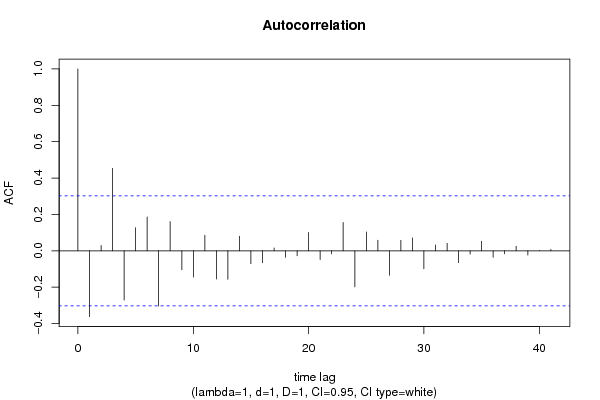
Autocorrelation Function
Time lag kACF(k)T-STATP-value
1-0.36191-2.34540.011901
20.0292110.18930.425382
30.4535772.93950.002662
4-0.270871-1.75540.043238
50.1274770.82610.206694
60.185691.20340.117779
7-0.303044-1.96390.028089
80.1606791.04130.151842
9-0.104298-0.67590.251396
10-0.143724-0.93140.178475
110.085840.55630.290476
12-0.15516-1.00550.160195
13-0.156656-1.01520.157901
140.0798850.51770.303686
15-0.070628-0.45770.324755
16-0.065909-0.42710.33573
170.0162140.10510.458407
18-0.036065-0.23370.408165
19-0.027517-0.17830.429661
200.1013910.65710.257355
21-0.04808-0.31160.378446
22-0.015713-0.10180.459688
230.1559121.01040.159039
24-0.198392-1.28570.102791
250.1039170.67350.252173
260.0585150.37920.353218
27-0.134416-0.87110.194322
280.0577220.37410.355114
290.0704840.45680.325087
30-0.098695-0.63960.262948
310.0327260.21210.416531
320.0411590.26670.395487
33-0.065099-0.42190.337628
34-0.017166-0.11120.455974
350.0530550.34380.366343
36-0.035511-0.23010.409552
37-0.016069-0.10410.458778
380.0251320.16290.4357
39-0.022732-0.14730.441792
400.0012330.0080.496831
410.0078340.05080.479876
42NANANA
43NANANA
44NANANA
45NANANA
46NANANA
47NANANA
48NANANA

\begin{tabular}{lllllllll}
\hline
Autocorrelation Function \tabularnewline
Time lag k & ACF(k) & T-STAT & P-value \tabularnewline
1 & -0.36191 & -2.3454 & 0.011901 \tabularnewline
2 & 0.029211 & 0.1893 & 0.425382 \tabularnewline
3 & 0.453577 & 2.9395 & 0.002662 \tabularnewline
4 & -0.270871 & -1.7554 & 0.043238 \tabularnewline
5 & 0.127477 & 0.8261 & 0.206694 \tabularnewline
6 & 0.18569 & 1.2034 & 0.117779 \tabularnewline
7 & -0.303044 & -1.9639 & 0.028089 \tabularnewline
8 & 0.160679 & 1.0413 & 0.151842 \tabularnewline
9 & -0.104298 & -0.6759 & 0.251396 \tabularnewline
10 & -0.143724 & -0.9314 & 0.178475 \tabularnewline
11 & 0.08584 & 0.5563 & 0.290476 \tabularnewline
12 & -0.15516 & -1.0055 & 0.160195 \tabularnewline
13 & -0.156656 & -1.0152 & 0.157901 \tabularnewline
14 & 0.079885 & 0.5177 & 0.303686 \tabularnewline
15 & -0.070628 & -0.4577 & 0.324755 \tabularnewline
16 & -0.065909 & -0.4271 & 0.33573 \tabularnewline
17 & 0.016214 & 0.1051 & 0.458407 \tabularnewline
18 & -0.036065 & -0.2337 & 0.408165 \tabularnewline
19 & -0.027517 & -0.1783 & 0.429661 \tabularnewline
20 & 0.101391 & 0.6571 & 0.257355 \tabularnewline
21 & -0.04808 & -0.3116 & 0.378446 \tabularnewline
22 & -0.015713 & -0.1018 & 0.459688 \tabularnewline
23 & 0.155912 & 1.0104 & 0.159039 \tabularnewline
24 & -0.198392 & -1.2857 & 0.102791 \tabularnewline
25 & 0.103917 & 0.6735 & 0.252173 \tabularnewline
26 & 0.058515 & 0.3792 & 0.353218 \tabularnewline
27 & -0.134416 & -0.8711 & 0.194322 \tabularnewline
28 & 0.057722 & 0.3741 & 0.355114 \tabularnewline
29 & 0.070484 & 0.4568 & 0.325087 \tabularnewline
30 & -0.098695 & -0.6396 & 0.262948 \tabularnewline
31 & 0.032726 & 0.2121 & 0.416531 \tabularnewline
32 & 0.041159 & 0.2667 & 0.395487 \tabularnewline
33 & -0.065099 & -0.4219 & 0.337628 \tabularnewline
34 & -0.017166 & -0.1112 & 0.455974 \tabularnewline
35 & 0.053055 & 0.3438 & 0.366343 \tabularnewline
36 & -0.035511 & -0.2301 & 0.409552 \tabularnewline
37 & -0.016069 & -0.1041 & 0.458778 \tabularnewline
38 & 0.025132 & 0.1629 & 0.4357 \tabularnewline
39 & -0.022732 & -0.1473 & 0.441792 \tabularnewline
40 & 0.001233 & 0.008 & 0.496831 \tabularnewline
41 & 0.007834 & 0.0508 & 0.479876 \tabularnewline
42 & NA & NA & NA \tabularnewline
43 & NA & NA & NA \tabularnewline
44 & NA & NA & NA \tabularnewline
45 & NA & NA & NA \tabularnewline
46 & NA & NA & NA \tabularnewline
47 & NA & NA & NA \tabularnewline
48 & NA & NA & NA \tabularnewline
\hline
\end{tabular}
%Source: https://freestatistics.org/blog/index.php?pk=107436&T=1

[TABLE]
[ROW][C]Autocorrelation Function[/C][/ROW]
[ROW][C]Time lag k[/C][C]ACF(k)[/C][C]T-STAT[/C][C]P-value[/C][/ROW]
[ROW][C]1[/C][C]-0.36191[/C][C]-2.3454[/C][C]0.011901[/C][/ROW]
[ROW][C]2[/C][C]0.029211[/C][C]0.1893[/C][C]0.425382[/C][/ROW]
[ROW][C]3[/C][C]0.453577[/C][C]2.9395[/C][C]0.002662[/C][/ROW]
[ROW][C]4[/C][C]-0.270871[/C][C]-1.7554[/C][C]0.043238[/C][/ROW]
[ROW][C]5[/C][C]0.127477[/C][C]0.8261[/C][C]0.206694[/C][/ROW]
[ROW][C]6[/C][C]0.18569[/C][C]1.2034[/C][C]0.117779[/C][/ROW]
[ROW][C]7[/C][C]-0.303044[/C][C]-1.9639[/C][C]0.028089[/C][/ROW]
[ROW][C]8[/C][C]0.160679[/C][C]1.0413[/C][C]0.151842[/C][/ROW]
[ROW][C]9[/C][C]-0.104298[/C][C]-0.6759[/C][C]0.251396[/C][/ROW]
[ROW][C]10[/C][C]-0.143724[/C][C]-0.9314[/C][C]0.178475[/C][/ROW]
[ROW][C]11[/C][C]0.08584[/C][C]0.5563[/C][C]0.290476[/C][/ROW]
[ROW][C]12[/C][C]-0.15516[/C][C]-1.0055[/C][C]0.160195[/C][/ROW]
[ROW][C]13[/C][C]-0.156656[/C][C]-1.0152[/C][C]0.157901[/C][/ROW]
[ROW][C]14[/C][C]0.079885[/C][C]0.5177[/C][C]0.303686[/C][/ROW]
[ROW][C]15[/C][C]-0.070628[/C][C]-0.4577[/C][C]0.324755[/C][/ROW]
[ROW][C]16[/C][C]-0.065909[/C][C]-0.4271[/C][C]0.33573[/C][/ROW]
[ROW][C]17[/C][C]0.016214[/C][C]0.1051[/C][C]0.458407[/C][/ROW]
[ROW][C]18[/C][C]-0.036065[/C][C]-0.2337[/C][C]0.408165[/C][/ROW]
[ROW][C]19[/C][C]-0.027517[/C][C]-0.1783[/C][C]0.429661[/C][/ROW]
[ROW][C]20[/C][C]0.101391[/C][C]0.6571[/C][C]0.257355[/C][/ROW]
[ROW][C]21[/C][C]-0.04808[/C][C]-0.3116[/C][C]0.378446[/C][/ROW]
[ROW][C]22[/C][C]-0.015713[/C][C]-0.1018[/C][C]0.459688[/C][/ROW]
[ROW][C]23[/C][C]0.155912[/C][C]1.0104[/C][C]0.159039[/C][/ROW]
[ROW][C]24[/C][C]-0.198392[/C][C]-1.2857[/C][C]0.102791[/C][/ROW]
[ROW][C]25[/C][C]0.103917[/C][C]0.6735[/C][C]0.252173[/C][/ROW]
[ROW][C]26[/C][C]0.058515[/C][C]0.3792[/C][C]0.353218[/C][/ROW]
[ROW][C]27[/C][C]-0.134416[/C][C]-0.8711[/C][C]0.194322[/C][/ROW]
[ROW][C]28[/C][C]0.057722[/C][C]0.3741[/C][C]0.355114[/C][/ROW]
[ROW][C]29[/C][C]0.070484[/C][C]0.4568[/C][C]0.325087[/C][/ROW]
[ROW][C]30[/C][C]-0.098695[/C][C]-0.6396[/C][C]0.262948[/C][/ROW]
[ROW][C]31[/C][C]0.032726[/C][C]0.2121[/C][C]0.416531[/C][/ROW]
[ROW][C]32[/C][C]0.041159[/C][C]0.2667[/C][C]0.395487[/C][/ROW]
[ROW][C]33[/C][C]-0.065099[/C][C]-0.4219[/C][C]0.337628[/C][/ROW]
[ROW][C]34[/C][C]-0.017166[/C][C]-0.1112[/C][C]0.455974[/C][/ROW]
[ROW][C]35[/C][C]0.053055[/C][C]0.3438[/C][C]0.366343[/C][/ROW]
[ROW][C]36[/C][C]-0.035511[/C][C]-0.2301[/C][C]0.409552[/C][/ROW]
[ROW][C]37[/C][C]-0.016069[/C][C]-0.1041[/C][C]0.458778[/C][/ROW]
[ROW][C]38[/C][C]0.025132[/C][C]0.1629[/C][C]0.4357[/C][/ROW]
[ROW][C]39[/C][C]-0.022732[/C][C]-0.1473[/C][C]0.441792[/C][/ROW]
[ROW][C]40[/C][C]0.001233[/C][C]0.008[/C][C]0.496831[/C][/ROW]
[ROW][C]41[/C][C]0.007834[/C][C]0.0508[/C][C]0.479876[/C][/ROW]
[ROW][C]42[/C][C]NA[/C][C]NA[/C][C]NA[/C][/ROW]
[ROW][C]43[/C][C]NA[/C][C]NA[/C][C]NA[/C][/ROW]
[ROW][C]44[/C][C]NA[/C][C]NA[/C][C]NA[/C][/ROW]
[ROW][C]45[/C][C]NA[/C][C]NA[/C][C]NA[/C][/ROW]
[ROW][C]46[/C][C]NA[/C][C]NA[/C][C]NA[/C][/ROW]
[ROW][C]47[/C][C]NA[/C][C]NA[/C][C]NA[/C][/ROW]
[ROW][C]48[/C][C]NA[/C][C]NA[/C][C]NA[/C][/ROW]
[/TABLE]
Source: https://freestatistics.org/blog/index.php?pk=107436&T=1

Globally Unique Identifier (entire table): ba.freestatistics.org/blog/index.php?pk=107436&T=1

As an alternative you can also use a QR Code:  

The GUIDs for individual cells are displayed in the table below:

Autocorrelation Function
Time lag kACF(k)T-STATP-value
1-0.36191-2.34540.011901
20.0292110.18930.425382
30.4535772.93950.002662
4-0.270871-1.75540.043238
50.1274770.82610.206694
60.185691.20340.117779
7-0.303044-1.96390.028089
80.1606791.04130.151842
9-0.104298-0.67590.251396
10-0.143724-0.93140.178475
110.085840.55630.290476
12-0.15516-1.00550.160195
13-0.156656-1.01520.157901
140.0798850.51770.303686
15-0.070628-0.45770.324755
16-0.065909-0.42710.33573
170.0162140.10510.458407
18-0.036065-0.23370.408165
19-0.027517-0.17830.429661
200.1013910.65710.257355
21-0.04808-0.31160.378446
22-0.015713-0.10180.459688
230.1559121.01040.159039
24-0.198392-1.28570.102791
250.1039170.67350.252173
260.0585150.37920.353218
27-0.134416-0.87110.194322
280.0577220.37410.355114
290.0704840.45680.325087
30-0.098695-0.63960.262948
310.0327260.21210.416531
320.0411590.26670.395487
33-0.065099-0.42190.337628
34-0.017166-0.11120.455974
350.0530550.34380.366343
36-0.035511-0.23010.409552
37-0.016069-0.10410.458778
380.0251320.16290.4357
39-0.022732-0.14730.441792
400.0012330.0080.496831
410.0078340.05080.479876
42NANANA
43NANANA
44NANANA
45NANANA
46NANANA
47NANANA
48NANANA


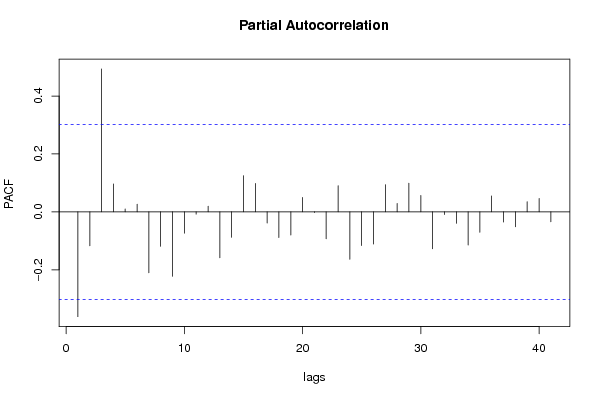
Partial Autocorrelation Function
Time lag kPACF(k)T-STATP-value
1-0.36191-2.34540.011901
2-0.117107-0.75890.226064
30.4935283.19840.001314
40.0963960.62470.267768
50.010040.06510.474216
60.0262020.16980.432988
7-0.210561-1.36460.089824
8-0.118676-0.76910.223066
9-0.222193-1.440.078644
10-0.073585-0.47690.317957
11-0.007837-0.05080.479868
120.0192520.12480.45065
13-0.158448-1.02690.155182
14-0.088122-0.57110.285488
150.124740.80840.211706
160.0978380.63410.26474
17-0.03857-0.250.401918
18-0.088625-0.57440.284395
19-0.080073-0.51890.303265
200.0496450.32170.374625
21-0.002396-0.01550.493843
22-0.092746-0.60110.275514
230.0902940.58520.280781
24-0.163696-1.06090.147406
25-0.116514-0.75510.227202
26-0.111109-0.72010.237736
270.0934280.60550.274057
280.029140.18880.42556
290.0986590.63940.263023
300.0568720.36860.35715
31-0.127507-0.82630.20664
32-0.009054-0.05870.476744
33-0.039677-0.25710.399164
34-0.114737-0.74360.230635
35-0.07051-0.4570.325028
360.0545520.35350.362727
37-0.035122-0.22760.410524
38-0.051305-0.33250.370586
390.0350410.22710.410727
400.0462660.29980.38289
41-0.034143-0.22130.412976
42NANANA
43NANANA
44NANANA
45NANANA
46NANANA
47NANANA
48NANANA

\begin{tabular}{lllllllll}
\hline
Partial Autocorrelation Function \tabularnewline
Time lag k & PACF(k) & T-STAT & P-value \tabularnewline
1 & -0.36191 & -2.3454 & 0.011901 \tabularnewline
2 & -0.117107 & -0.7589 & 0.226064 \tabularnewline
3 & 0.493528 & 3.1984 & 0.001314 \tabularnewline
4 & 0.096396 & 0.6247 & 0.267768 \tabularnewline
5 & 0.01004 & 0.0651 & 0.474216 \tabularnewline
6 & 0.026202 & 0.1698 & 0.432988 \tabularnewline
7 & -0.210561 & -1.3646 & 0.089824 \tabularnewline
8 & -0.118676 & -0.7691 & 0.223066 \tabularnewline
9 & -0.222193 & -1.44 & 0.078644 \tabularnewline
10 & -0.073585 & -0.4769 & 0.317957 \tabularnewline
11 & -0.007837 & -0.0508 & 0.479868 \tabularnewline
12 & 0.019252 & 0.1248 & 0.45065 \tabularnewline
13 & -0.158448 & -1.0269 & 0.155182 \tabularnewline
14 & -0.088122 & -0.5711 & 0.285488 \tabularnewline
15 & 0.12474 & 0.8084 & 0.211706 \tabularnewline
16 & 0.097838 & 0.6341 & 0.26474 \tabularnewline
17 & -0.03857 & -0.25 & 0.401918 \tabularnewline
18 & -0.088625 & -0.5744 & 0.284395 \tabularnewline
19 & -0.080073 & -0.5189 & 0.303265 \tabularnewline
20 & 0.049645 & 0.3217 & 0.374625 \tabularnewline
21 & -0.002396 & -0.0155 & 0.493843 \tabularnewline
22 & -0.092746 & -0.6011 & 0.275514 \tabularnewline
23 & 0.090294 & 0.5852 & 0.280781 \tabularnewline
24 & -0.163696 & -1.0609 & 0.147406 \tabularnewline
25 & -0.116514 & -0.7551 & 0.227202 \tabularnewline
26 & -0.111109 & -0.7201 & 0.237736 \tabularnewline
27 & 0.093428 & 0.6055 & 0.274057 \tabularnewline
28 & 0.02914 & 0.1888 & 0.42556 \tabularnewline
29 & 0.098659 & 0.6394 & 0.263023 \tabularnewline
30 & 0.056872 & 0.3686 & 0.35715 \tabularnewline
31 & -0.127507 & -0.8263 & 0.20664 \tabularnewline
32 & -0.009054 & -0.0587 & 0.476744 \tabularnewline
33 & -0.039677 & -0.2571 & 0.399164 \tabularnewline
34 & -0.114737 & -0.7436 & 0.230635 \tabularnewline
35 & -0.07051 & -0.457 & 0.325028 \tabularnewline
36 & 0.054552 & 0.3535 & 0.362727 \tabularnewline
37 & -0.035122 & -0.2276 & 0.410524 \tabularnewline
38 & -0.051305 & -0.3325 & 0.370586 \tabularnewline
39 & 0.035041 & 0.2271 & 0.410727 \tabularnewline
40 & 0.046266 & 0.2998 & 0.38289 \tabularnewline
41 & -0.034143 & -0.2213 & 0.412976 \tabularnewline
42 & NA & NA & NA \tabularnewline
43 & NA & NA & NA \tabularnewline
44 & NA & NA & NA \tabularnewline
45 & NA & NA & NA \tabularnewline
46 & NA & NA & NA \tabularnewline
47 & NA & NA & NA \tabularnewline
48 & NA & NA & NA \tabularnewline
\hline
\end{tabular}
%Source: https://freestatistics.org/blog/index.php?pk=107436&T=2

[TABLE]
[ROW][C]Partial Autocorrelation Function[/C][/ROW]
[ROW][C]Time lag k[/C][C]PACF(k)[/C][C]T-STAT[/C][C]P-value[/C][/ROW]
[ROW][C]1[/C][C]-0.36191[/C][C]-2.3454[/C][C]0.011901[/C][/ROW]
[ROW][C]2[/C][C]-0.117107[/C][C]-0.7589[/C][C]0.226064[/C][/ROW]
[ROW][C]3[/C][C]0.493528[/C][C]3.1984[/C][C]0.001314[/C][/ROW]
[ROW][C]4[/C][C]0.096396[/C][C]0.6247[/C][C]0.267768[/C][/ROW]
[ROW][C]5[/C][C]0.01004[/C][C]0.0651[/C][C]0.474216[/C][/ROW]
[ROW][C]6[/C][C]0.026202[/C][C]0.1698[/C][C]0.432988[/C][/ROW]
[ROW][C]7[/C][C]-0.210561[/C][C]-1.3646[/C][C]0.089824[/C][/ROW]
[ROW][C]8[/C][C]-0.118676[/C][C]-0.7691[/C][C]0.223066[/C][/ROW]
[ROW][C]9[/C][C]-0.222193[/C][C]-1.44[/C][C]0.078644[/C][/ROW]
[ROW][C]10[/C][C]-0.073585[/C][C]-0.4769[/C][C]0.317957[/C][/ROW]
[ROW][C]11[/C][C]-0.007837[/C][C]-0.0508[/C][C]0.479868[/C][/ROW]
[ROW][C]12[/C][C]0.019252[/C][C]0.1248[/C][C]0.45065[/C][/ROW]
[ROW][C]13[/C][C]-0.158448[/C][C]-1.0269[/C][C]0.155182[/C][/ROW]
[ROW][C]14[/C][C]-0.088122[/C][C]-0.5711[/C][C]0.285488[/C][/ROW]
[ROW][C]15[/C][C]0.12474[/C][C]0.8084[/C][C]0.211706[/C][/ROW]
[ROW][C]16[/C][C]0.097838[/C][C]0.6341[/C][C]0.26474[/C][/ROW]
[ROW][C]17[/C][C]-0.03857[/C][C]-0.25[/C][C]0.401918[/C][/ROW]
[ROW][C]18[/C][C]-0.088625[/C][C]-0.5744[/C][C]0.284395[/C][/ROW]
[ROW][C]19[/C][C]-0.080073[/C][C]-0.5189[/C][C]0.303265[/C][/ROW]
[ROW][C]20[/C][C]0.049645[/C][C]0.3217[/C][C]0.374625[/C][/ROW]
[ROW][C]21[/C][C]-0.002396[/C][C]-0.0155[/C][C]0.493843[/C][/ROW]
[ROW][C]22[/C][C]-0.092746[/C][C]-0.6011[/C][C]0.275514[/C][/ROW]
[ROW][C]23[/C][C]0.090294[/C][C]0.5852[/C][C]0.280781[/C][/ROW]
[ROW][C]24[/C][C]-0.163696[/C][C]-1.0609[/C][C]0.147406[/C][/ROW]
[ROW][C]25[/C][C]-0.116514[/C][C]-0.7551[/C][C]0.227202[/C][/ROW]
[ROW][C]26[/C][C]-0.111109[/C][C]-0.7201[/C][C]0.237736[/C][/ROW]
[ROW][C]27[/C][C]0.093428[/C][C]0.6055[/C][C]0.274057[/C][/ROW]
[ROW][C]28[/C][C]0.02914[/C][C]0.1888[/C][C]0.42556[/C][/ROW]
[ROW][C]29[/C][C]0.098659[/C][C]0.6394[/C][C]0.263023[/C][/ROW]
[ROW][C]30[/C][C]0.056872[/C][C]0.3686[/C][C]0.35715[/C][/ROW]
[ROW][C]31[/C][C]-0.127507[/C][C]-0.8263[/C][C]0.20664[/C][/ROW]
[ROW][C]32[/C][C]-0.009054[/C][C]-0.0587[/C][C]0.476744[/C][/ROW]
[ROW][C]33[/C][C]-0.039677[/C][C]-0.2571[/C][C]0.399164[/C][/ROW]
[ROW][C]34[/C][C]-0.114737[/C][C]-0.7436[/C][C]0.230635[/C][/ROW]
[ROW][C]35[/C][C]-0.07051[/C][C]-0.457[/C][C]0.325028[/C][/ROW]
[ROW][C]36[/C][C]0.054552[/C][C]0.3535[/C][C]0.362727[/C][/ROW]
[ROW][C]37[/C][C]-0.035122[/C][C]-0.2276[/C][C]0.410524[/C][/ROW]
[ROW][C]38[/C][C]-0.051305[/C][C]-0.3325[/C][C]0.370586[/C][/ROW]
[ROW][C]39[/C][C]0.035041[/C][C]0.2271[/C][C]0.410727[/C][/ROW]
[ROW][C]40[/C][C]0.046266[/C][C]0.2998[/C][C]0.38289[/C][/ROW]
[ROW][C]41[/C][C]-0.034143[/C][C]-0.2213[/C][C]0.412976[/C][/ROW]
[ROW][C]42[/C][C]NA[/C][C]NA[/C][C]NA[/C][/ROW]
[ROW][C]43[/C][C]NA[/C][C]NA[/C][C]NA[/C][/ROW]
[ROW][C]44[/C][C]NA[/C][C]NA[/C][C]NA[/C][/ROW]
[ROW][C]45[/C][C]NA[/C][C]NA[/C][C]NA[/C][/ROW]
[ROW][C]46[/C][C]NA[/C][C]NA[/C][C]NA[/C][/ROW]
[ROW][C]47[/C][C]NA[/C][C]NA[/C][C]NA[/C][/ROW]
[ROW][C]48[/C][C]NA[/C][C]NA[/C][C]NA[/C][/ROW]
[/TABLE]
Source: https://freestatistics.org/blog/index.php?pk=107436&T=2

Globally Unique Identifier (entire table): ba.freestatistics.org/blog/index.php?pk=107436&T=2

As an alternative you can also use a QR Code:  

The GUIDs for individual cells are displayed in the table below:

Partial Autocorrelation Function
Time lag kPACF(k)T-STATP-value
1-0.36191-2.34540.011901
2-0.117107-0.75890.226064
30.4935283.19840.001314
40.0963960.62470.267768
50.010040.06510.474216
60.0262020.16980.432988
7-0.210561-1.36460.089824
8-0.118676-0.76910.223066
9-0.222193-1.440.078644
10-0.073585-0.47690.317957
11-0.007837-0.05080.479868
120.0192520.12480.45065
13-0.158448-1.02690.155182
14-0.088122-0.57110.285488
150.124740.80840.211706
160.0978380.63410.26474
17-0.03857-0.250.401918
18-0.088625-0.57440.284395
19-0.080073-0.51890.303265
200.0496450.32170.374625
21-0.002396-0.01550.493843
22-0.092746-0.60110.275514
230.0902940.58520.280781
24-0.163696-1.06090.147406
25-0.116514-0.75510.227202
26-0.111109-0.72010.237736
270.0934280.60550.274057
280.029140.18880.42556
290.0986590.63940.263023
300.0568720.36860.35715
31-0.127507-0.82630.20664
32-0.009054-0.05870.476744
33-0.039677-0.25710.399164
34-0.114737-0.74360.230635
35-0.07051-0.4570.325028
360.0545520.35350.362727
37-0.035122-0.22760.410524
38-0.051305-0.33250.370586
390.0350410.22710.410727
400.0462660.29980.38289
41-0.034143-0.22130.412976
42NANANA
43NANANA
44NANANA
45NANANA
46NANANA
47NANANA
48NANANA


Parameters (Session):
par1 = 48 ; par2 = 1 ; par3 = 1 ; par4 = 1 ; par5 = 12 ; par6 = White Noise ; par7 = 0.95 ;
Parameters (R input):
par1 = 48 ; par2 = 1 ; par3 = 1 ; par4 = 1 ; par5 = 12 ; par6 = White Noise ; par7 = 0.95 ;
R code (references can be found in the software module):
if (par1 == 'Default') {
par1 = 10*log10(length(x))
} else {
par1 <- as.numeric(par1)
}
par2 <- as.numeric(par2)
par3 <- as.numeric(par3)
par4 <- as.numeric(par4)
par5 <- as.numeric(par5)
if (par6 == 'White Noise') par6 <- 'white' else par6 <- 'ma'
par7 <- as.numeric(par7)
if (par2 == 0) {
x <- log(x)
} else {
x <- (x ^ par2 - 1) / par2
}
if (par3 > 0) x <- diff(x,lag=1,difference=par3)
if (par4 > 0) x <- diff(x,lag=par5,difference=par4)
bitmap(file='pic1.png')
racf <- acf(x, par1, main='Autocorrelation', xlab='time lag', ylab='ACF', ci.type=par6, ci=par7, sub=paste('(lambda=',par2,', d=',par3,', D=',par4,', CI=', par7, ', CI type=',par6,')',sep=''))
dev.off()
bitmap(file='pic2.png')
rpacf <- pacf(x,par1,main='Partial Autocorrelation',xlab='lags',ylab='PACF')
dev.off()
(myacf <- c(racf$acf))
(mypacf <- c(rpacf$acf))
lengthx <- length(x)
sqrtn <- sqrt(lengthx)
load(file='createtable')
a<-table.start()
a<-table.row.start(a)
a<-table.element(a,'Autocorrelation Function',4,TRUE)
a<-table.row.end(a)
a<-table.row.start(a)
a<-table.element(a,'Time lag k',header=TRUE)
a<-table.element(a,hyperlink('basics.htm','ACF(k)','click here for more information about the Autocorrelation Function'),header=TRUE)
a<-table.element(a,'T-STAT',header=TRUE)
a<-table.element(a,'P-value',header=TRUE)
a<-table.row.end(a)
for (i in 2:(par1+1)) {
a<-table.row.start(a)
a<-table.element(a,i-1,header=TRUE)
a<-table.element(a,round(myacf[i],6))
mytstat <- myacf[i]*sqrtn
a<-table.element(a,round(mytstat,4))
a<-table.element(a,round(1-pt(abs(mytstat),lengthx),6))
a<-table.row.end(a)
}
a<-table.end(a)
table.save(a,file='mytable.tab')
a<-table.start()
a<-table.row.start(a)
a<-table.element(a,'Partial Autocorrelation Function',4,TRUE)
a<-table.row.end(a)
a<-table.row.start(a)
a<-table.element(a,'Time lag k',header=TRUE)
a<-table.element(a,hyperlink('basics.htm','PACF(k)','click here for more information about the Partial Autocorrelation Function'),header=TRUE)
a<-table.element(a,'T-STAT',header=TRUE)
a<-table.element(a,'P-value',header=TRUE)
a<-table.row.end(a)
for (i in 1:par1) {
a<-table.row.start(a)
a<-table.element(a,i,header=TRUE)
a<-table.element(a,round(mypacf[i],6))
mytstat <- mypacf[i]*sqrtn
a<-table.element(a,round(mytstat,4))
a<-table.element(a,round(1-pt(abs(mytstat),lengthx),6))
a<-table.row.end(a)
}
a<-table.end(a)
table.save(a,file='mytable1.tab')