Free Statistics
of Irreproducible Research!
Description of Statistical Computation | |||||||||||||||||||||||||||||||||||||||||||||||||||||||||||||
|---|---|---|---|---|---|---|---|---|---|---|---|---|---|---|---|---|---|---|---|---|---|---|---|---|---|---|---|---|---|---|---|---|---|---|---|---|---|---|---|---|---|---|---|---|---|---|---|---|---|---|---|---|---|---|---|---|---|---|---|---|---|
| Author's title | |||||||||||||||||||||||||||||||||||||||||||||||||||||||||||||
| Author | *The author of this computation has been verified* | ||||||||||||||||||||||||||||||||||||||||||||||||||||||||||||
| R Software Module | rwasp_regression_trees1.wasp | ||||||||||||||||||||||||||||||||||||||||||||||||||||||||||||
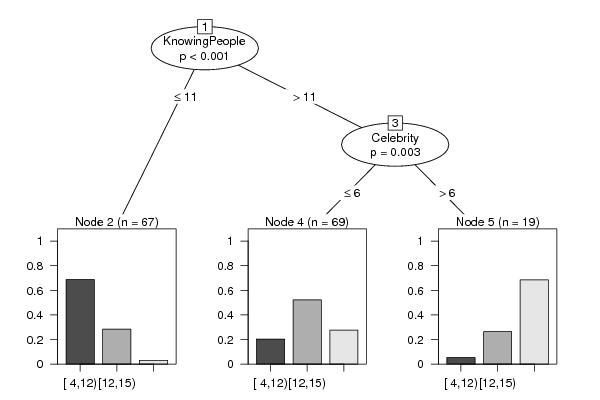
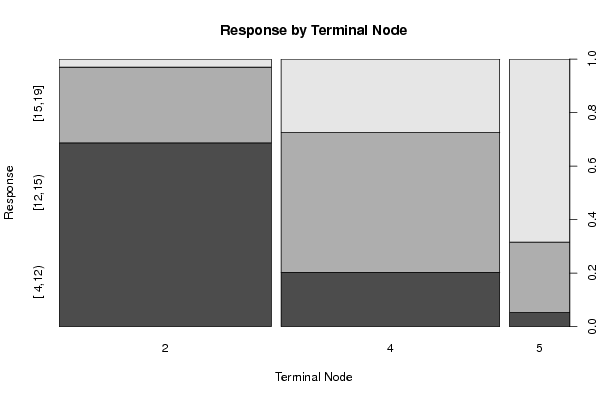
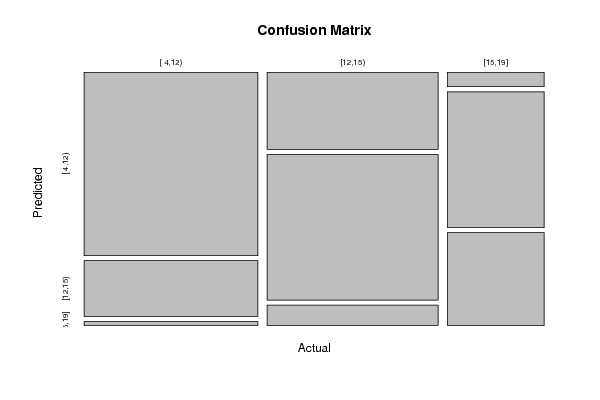
| Title produced by software | Recursive Partitioning (Regression Trees) | ||||||||||||||||||||||||||||||||||||||||||||||||||||||||||||
| Date of computation | Thu, 09 Dec 2010 21:27:00 +0000 | ||||||||||||||||||||||||||||||||||||||||||||||||||||||||||||
| Cite this page as follows | Statistical Computations at FreeStatistics.org, Office for Research Development and Education, URL https://freestatistics.org/blog/index.php?v=date/2010/Dec/09/t1291929956awxdfo56zv7luh1.htm/, Retrieved Mon, 29 Apr 2024 00:31:38 +0000 | ||||||||||||||||||||||||||||||||||||||||||||||||||||||||||||
| Statistical Computations at FreeStatistics.org, Office for Research Development and Education, URL https://freestatistics.org/blog/index.php?pk=107422, Retrieved Mon, 29 Apr 2024 00:31:38 +0000 | |||||||||||||||||||||||||||||||||||||||||||||||||||||||||||||
| QR Codes: | |||||||||||||||||||||||||||||||||||||||||||||||||||||||||||||
|
| |||||||||||||||||||||||||||||||||||||||||||||||||||||||||||||
| Original text written by user: | |||||||||||||||||||||||||||||||||||||||||||||||||||||||||||||
| IsPrivate? | No (this computation is public) | ||||||||||||||||||||||||||||||||||||||||||||||||||||||||||||
| User-defined keywords | |||||||||||||||||||||||||||||||||||||||||||||||||||||||||||||
| Estimated Impact | 233 | ||||||||||||||||||||||||||||||||||||||||||||||||||||||||||||
Tree of Dependent Computations | |||||||||||||||||||||||||||||||||||||||||||||||||||||||||||||
| Family? (F = Feedback message, R = changed R code, M = changed R Module, P = changed Parameters, D = changed Data) | |||||||||||||||||||||||||||||||||||||||||||||||||||||||||||||
| - [Recursive Partitioning (Regression Trees)] [] [2010-12-05 19:35:21] [b98453cac15ba1066b407e146608df68] - R PD [Recursive Partitioning (Regression Trees)] [recursive partiti...] [2010-12-09 21:27:00] [9ea95e194e0eb2a674315798620d5bc6] [Current] - P [Recursive Partitioning (Regression Trees)] [Recursive partiti...] [2010-12-09 21:41:03] [97ad38b1c3b35a5feca8b85f7bc7b3ff] - R PD [Recursive Partitioning (Regression Trees)] [] [2011-12-11 11:24:23] [06c08141d7d783218a8164fd2ea166f2] - R P [Recursive Partitioning (Regression Trees)] [Cross Validation] [2011-12-13 11:01:21] [d1ce18d003fa52f731d1c3ce8b58d5f9] - PD [Recursive Partitioning (Regression Trees)] [] [2011-12-20 21:27:44] [f1de53e71fac758e9834be8effee591f] - R PD [Recursive Partitioning (Regression Trees)] [] [2011-12-12 18:28:46] [ec2187f7727da5d5d939740b21b8b68a] - R [Recursive Partitioning (Regression Trees)] [WS10-Cross valida...] [2011-12-13 13:58:17] [69d59b79aaf660457acc70a0ef0bfdab] - R [Recursive Partitioning (Regression Trees)] [] [2011-12-13 18:04:19] [9401a40688cf36283be626153bc5a38b] - R PD [Recursive Partitioning (Regression Trees)] [] [2011-12-11 11:02:45] [06c08141d7d783218a8164fd2ea166f2] - R [Recursive Partitioning (Regression Trees)] [] [2011-12-12 17:55:35] [ec2187f7727da5d5d939740b21b8b68a] - R [Recursive Partitioning (Regression Trees)] [Recursive Partiti...] [2011-12-13 10:43:17] [d1ce18d003fa52f731d1c3ce8b58d5f9] - R [Recursive Partitioning (Regression Trees)] [WS10-Recursive Pa...] [2011-12-13 13:32:58] [69d59b79aaf660457acc70a0ef0bfdab] - R [Recursive Partitioning (Regression Trees)] [] [2011-12-13 17:35:19] [9401a40688cf36283be626153bc5a38b] | |||||||||||||||||||||||||||||||||||||||||||||||||||||||||||||
| Feedback Forum | |||||||||||||||||||||||||||||||||||||||||||||||||||||||||||||
Post a new message | |||||||||||||||||||||||||||||||||||||||||||||||||||||||||||||
Dataset | |||||||||||||||||||||||||||||||||||||||||||||||||||||||||||||
| Dataseries X: | |||||||||||||||||||||||||||||||||||||||||||||||||||||||||||||
1 15 10 77 5 4 15 11 12 13 6 0 12 20 63 6 4 9 12 7 11 4 0 15 16 73 4 10 12 12 13 14 6 0 12 10 76 6 6 15 11 11 12 5 0 14 8 90 3 5 17 11 16 12 5 0 8 14 67 10 8 14 10 10 6 4 1 11 19 69 8 9 9 11 15 10 5 1 15 15 70 3 6 12 9 5 11 3 0 4 23 54 4 8 11 10 4 10 2 0 13 9 54 3 11 13 12 7 12 5 1 19 12 76 5 6 16 12 15 15 6 1 10 14 75 5 8 16 12 5 13 6 1 15 13 76 6 11 15 13 16 18 8 0 6 11 80 5 5 10 9 15 11 6 1 7 11 89 3 10 16 12 13 12 3 0 14 10 73 4 7 12 12 13 13 6 0 16 12 74 8 7 15 12 15 14 6 1 16 18 78 8 13 13 12 15 16 7 1 14 12 76 8 10 18 13 10 16 8 0 15 10 69 5 8 13 11 17 16 6 1 14 15 74 8 6 17 12 14 15 7 1 12 15 82 2 8 14 12 9 13 4 0 9 12 77 0 7 13 15 6 8 4 1 12 9 84 5 5 13 11 11 14 2 1 14 11 75 2 9 15 12 13 15 6 1 12 15 54 7 9 13 10 12 13 6 1 14 16 79 5 11 15 11 10 16 6 1 10 17 79 2 11 13 13 4 13 6 1 14 12 69 12 11 14 6 13 12 6 1 16 11 88 7 9 13 12 15 15 7 1 10 13 57 0 7 16 12 8 11 4 1 8 9 69 2 6 14 10 10 14 3 1 12 11 86 3 6 18 12 8 13 5 1 11 9 65 0 6 15 12 7 13 6 0 8 20 66 9 5 9 11 9 12 4 0 13 8 54 2 4 16 9 14 14 6 1 11 12 85 3 10 16 10 5 13 3 0 12 10 79 1 8 17 12 7 12 3 0 16 11 84 10 6 13 12 16 14 6 1 16 13 70 1 5 17 11 14 15 6 1 13 13 54 4 9 15 12 16 16 6 1 14 13 70 6 10 14 11 15 15 8 0 5 15 54 6 6 10 14 4 5 2 0 14 12 69 4 9 13 10 12 15 6 1 13 13 68 4 10 11 10 8 8 4 1 16 13 68 7 6 11 11 17 16 7 0 14 9 71 7 6 16 11 15 16 6 0 15 9 71 7 6 16 11 16 14 6 1 15 14 66 0 13 11 10 12 16 6 1 11 9 67 3 8 15 10 12 14 5 1 15 9 71 8 10 15 12 13 13 6 1 16 15 54 8 5 12 11 14 14 6 1 13 10 76 10 8 17 8 14 14 5 0 11 13 77 11 6 15 12 15 12 6 0 12 8 71 6 9 16 10 14 13 7 1 12 15 69 2 9 14 7 11 15 5 1 10 13 73 6 7 17 11 13 15 6 1 8 24 46 1 20 10 7 4 13 6 0 9 11 66 5 8 11 11 8 10 4 1 12 13 77 4 8 15 8 13 13 5 0 14 12 77 6 7 15 11 15 14 6 1 12 22 70 6 7 7 12 15 13 6 0 11 11 86 4 10 17 8 8 13 4 0 14 15 38 1 5 14 14 17 18 6 0 7 7 66 6 8 18 14 12 12 4 0 16 14 75 7 9 14 11 13 14 7 1 16 19 80 7 9 12 12 14 16 8 0 11 10 64 2 20 14 14 7 13 6 1 16 9 80 7 6 9 9 16 16 6 1 13 12 86 8 10 14 13 11 15 6 1 11 16 54 5 11 11 8 10 14 5 1 13 13 74 4 7 16 11 14 13 6 1 14 11 88 2 12 17 9 19 12 6 1 15 12 85 0 12 16 12 14 16 4 0 10 11 63 7 8 12 7 8 9 5 1 15 13 81 0 6 15 11 15 15 8 0 11 13 81 5 6 15 12 8 16 6 1 11 10 74 3 9 15 11 8 12 6 1 6 11 80 3 5 16 12 6 11 2 1 11 9 80 3 11 16 9 7 13 2 0 12 13 60 3 6 11 11 16 13 4 0 13 15 65 7 6 15 13 15 14 6 1 12 14 62 6 10 12 12 10 15 6 0 8 14 63 3 8 14 12 8 14 5 1 9 11 89 0 7 15 11 9 12 4 1 10 10 76 2 8 17 12 8 16 4 1 16 11 81 0 9 19 12 14 14 6 1 15 12 72 9 8 15 11 14 13 5 0 14 14 84 10 10 16 11 14 12 6 1 12 14 76 3 13 14 8 15 13 7 1 12 21 76 7 7 16 9 7 12 6 1 10 14 78 3 7 15 11 7 9 4 1 12 13 72 6 7 15 12 12 13 4 0 8 11 81 5 8 17 13 7 10 3 1 16 12 72 0 9 12 12 12 15 8 1 11 12 78 0 9 18 6 6 9 4 1 12 11 79 4 8 13 12 10 13 4 1 9 14 52 0 7 14 11 12 13 5 0 14 13 67 0 6 14 13 13 13 5 0 15 13 74 7 8 14 11 14 15 7 0 8 12 73 3 8 12 12 8 13 4 1 12 14 69 9 4 14 10 14 14 5 0 10 12 67 4 8 12 10 10 11 5 1 16 12 76 4 10 15 11 14 15 8 1 17 12 77 15 7 11 11 15 14 5 0 8 18 63 7 8 11 11 10 15 2 1 9 11 84 8 7 15 9 6 12 5 1 8 15 90 2 10 14 7 9 15 4 0 11 13 75 8 9 15 11 11 14 5 1 16 11 76 7 8 16 12 16 16 7 0 13 11 75 3 8 12 12 14 14 6 1 5 22 53 3 5 14 15 8 12 3 1 15 10 87 6 8 18 11 16 11 5 1 15 11 78 8 9 14 10 16 13 6 1 12 15 54 5 11 13 13 14 12 5 0 12 14 58 6 7 14 13 12 12 6 1 16 11 80 10 8 14 11 16 16 7 1 12 10 74 0 4 17 12 15 13 6 1 10 14 56 5 16 12 12 11 12 6 1 12 14 82 0 9 16 12 6 14 5 1 4 11 64 0 16 15 8 6 4 4 0 11 15 67 5 12 10 5 16 14 6 0 16 11 75 10 8 13 11 16 15 6 0 7 10 69 0 4 15 12 8 12 3 1 9 10 72 5 11 16 12 11 11 4 0 14 16 71 6 11 15 11 12 12 4 1 11 12 54 1 8 14 12 13 11 4 1 10 14 68 5 8 11 10 11 12 5 0 6 15 54 3 12 13 7 9 11 4 1 14 10 71 3 8 17 12 15 13 6 1 11 12 53 6 6 14 12 11 12 6 1 11 15 54 2 8 16 9 12 12 4 0 9 12 71 5 6 15 11 15 15 7 1 16 11 69 6 14 12 12 8 14 4 0 7 10 30 2 10 16 12 7 12 4 0 8 20 53 3 5 8 11 10 12 4 0 10 19 68 7 8 9 11 9 12 4 1 14 17 69 6 12 13 12 13 13 5 1 9 8 54 3 11 19 12 11 11 4 1 13 17 66 6 8 11 11 12 13 7 0 13 11 79 9 8 15 12 5 12 3 0 12 13 67 2 9 11 12 12 14 5 0 11 9 74 5 6 15 8 14 15 5 0 10 10 86 10 5 16 15 15 15 6 1 12 13 63 9 8 15 11 14 13 5 1 14 16 69 8 7 12 11 13 16 6 0 11 12 73 8 4 16 6 14 17 6 0 13 14 69 5 9 15 13 14 13 3 0 14 11 71 9 5 13 12 15 14 6 1 13 13 77 9 9 14 12 13 13 5 1 16 15 74 14 12 11 12 14 16 8 1 13 14 82 5 6 15 12 11 13 6 1 12 14 54 12 4 16 12 14 14 4 1 9 14 54 6 6 14 10 11 13 3 1 14 10 80 6 7 13 12 8 14 4 | |||||||||||||||||||||||||||||||||||||||||||||||||||||||||||||
Tables (Output of Computation) | |||||||||||||||||||||||||||||||||||||||||||||||||||||||||||||
| |||||||||||||||||||||||||||||||||||||||||||||||||||||||||||||
Figures (Output of Computation) | |||||||||||||||||||||||||||||||||||||||||||||||||||||||||||||
Input Parameters & R Code | |||||||||||||||||||||||||||||||||||||||||||||||||||||||||||||
| Parameters (Session): | |||||||||||||||||||||||||||||||||||||||||||||||||||||||||||||
| par1 = 2 ; par2 = quantiles ; par3 = 3 ; par4 = no ; | |||||||||||||||||||||||||||||||||||||||||||||||||||||||||||||
| Parameters (R input): | |||||||||||||||||||||||||||||||||||||||||||||||||||||||||||||
| par1 = 2 ; par2 = quantiles ; par3 = 3 ; par4 = no ; | |||||||||||||||||||||||||||||||||||||||||||||||||||||||||||||
| R code (references can be found in the software module): | |||||||||||||||||||||||||||||||||||||||||||||||||||||||||||||
library(party) | |||||||||||||||||||||||||||||||||||||||||||||||||||||||||||||