Free Statistics

of Irreproducible Research!

Author's title

Author*The author of this computation has been verified*
R Software Modulerwasp_autocorrelation.wasp
Title produced by software(Partial) Autocorrelation Function
Date of computationThu, 09 Dec 2010 21:17:02 +0000
Cite this page as followsStatistical Computations at FreeStatistics.org, Office for Research Development and Education, URL https://freestatistics.org/blog/index.php?v=date/2010/Dec/09/t1291929287xpa7qzi8z3qhzrw.htm/, Retrieved Mon, 29 Apr 2024 01:47:05 +0000
Statistical Computations at FreeStatistics.org, Office for Research Development and Education, URL https://freestatistics.org/blog/index.php?pk=107418, Retrieved Mon, 29 Apr 2024 01:47:05 +0000
QR Codes:

Original text written by user:
IsPrivate?No (this computation is public)
User-defined keywords
Estimated Impact94
Family? (F = Feedback message, R = changed R code, M = changed R Module, P = changed Parameters, D = changed Data)
-       [(Partial) Autocorrelation Function] [Paper - Werkloosh...] [2010-12-09 21:17:02] [cfd788255f1b1b5389e58d7f218c70bf] [Current]
Feedback Forum

Post a new message
Dataseries X:
376.974
377.632
378.205
370.861
369.167
371.551
382.842
381.903
384.502
392.058
384.359
388.884
386.586
387.495
385.705
378.67
377.367
376.911
389.827
387.82
387.267
380.575
372.402
376.74
377.795
376.126
370.804
367.98
367.866
366.121
379.421
378.519
372.423
355.072
344.693
342.892
344.178
337.606
327.103
323.953
316.532
306.307
327.225
329.573
313.761
307.836
300.074
304.198
306.122
300.414
292.133
290.616
280.244
285.179
305.486
305.957
293.886
289.441
288.776
299.149
306.532
309.914
313.468
314.901
309.16
316.15
336.544
339.196
326.738
320.838
318.62
331.533
335.378


Summary of computational transaction
Raw Inputview raw input (R code)
Raw Outputview raw output of R engine
Computing time1 seconds
R Server'Gwilym Jenkins' @ 72.249.127.135

\begin{tabular}{lllllllll}
\hline
Summary of computational transaction \tabularnewline
Raw Input & view raw input (R code)  \tabularnewline
Raw Output & view raw output of R engine  \tabularnewline
Computing time & 1 seconds \tabularnewline
R Server & 'Gwilym Jenkins' @ 72.249.127.135 \tabularnewline
\hline
\end{tabular}
%Source: https://freestatistics.org/blog/index.php?pk=107418&T=0

[TABLE]
[ROW][C]Summary of computational transaction[/C][/ROW]
[ROW][C]Raw Input[/C][C]view raw input (R code) [/C][/ROW]
[ROW][C]Raw Output[/C][C]view raw output of R engine [/C][/ROW]
[ROW][C]Computing time[/C][C]1 seconds[/C][/ROW]
[ROW][C]R Server[/C][C]'Gwilym Jenkins' @ 72.249.127.135[/C][/ROW]
[/TABLE]
Source: https://freestatistics.org/blog/index.php?pk=107418&T=0

Globally Unique Identifier (entire table): ba.freestatistics.org/blog/index.php?pk=107418&T=0

As an alternative you can also use a QR Code:  

The GUIDs for individual cells are displayed in the table below:

Summary of computational transaction
Raw Inputview raw input (R code)
Raw Outputview raw output of R engine
Computing time1 seconds
R Server'Gwilym Jenkins' @ 72.249.127.135


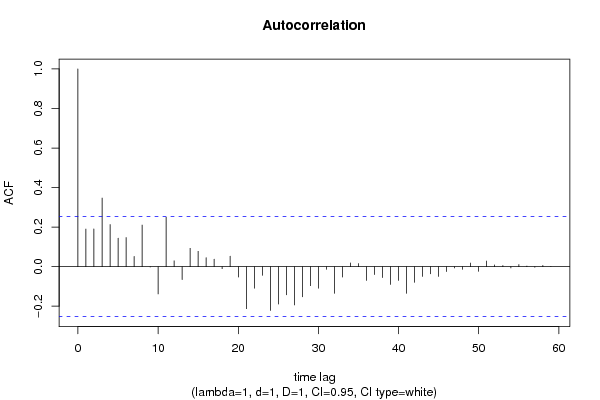
Autocorrelation Function
Time lag kACF(k)T-STATP-value
10.1903791.47470.072765
20.1909921.47940.07213
30.3469252.68730.004654
40.2127951.64830.052259
50.1440061.11550.134549
60.147311.14110.129189
70.0512930.39730.346274
80.2101451.62780.054406
9-0.00231-0.01790.49289
10-0.137838-1.06770.144969
110.2496141.93350.028948
120.0296990.230.409418
13-0.065332-0.50610.307335
140.0924240.71590.23841
150.0776440.60140.274911
160.0450790.34920.364087
170.0378810.29340.385106
18-0.010613-0.08220.467379
190.0526820.40810.342337
20-0.052485-0.40650.342893
21-0.212609-1.64690.052407
22-0.109339-0.84690.200199
23-0.043907-0.34010.367484
24-0.221284-1.71410.04584
25-0.189192-1.46550.074006
26-0.142624-1.10480.136837
27-0.193519-1.4990.06956
28-0.152767-1.18330.120673
29-0.096454-0.74710.228951
30-0.109249-0.84620.200392
31-0.013457-0.10420.458663
32-0.134701-1.04340.150478
33-0.052617-0.40760.342521
340.0187480.14520.442513
350.015650.12120.45196
36-0.069653-0.53950.295758
37-0.039869-0.30880.379262
38-0.055225-0.42780.335174
39-0.089976-0.6970.244261
40-0.069616-0.53920.295857
41-0.135116-1.04660.149739
42-0.079543-0.61610.270067
43-0.049514-0.38350.35134
44-0.036291-0.28110.389796
45-0.049769-0.38550.350613
46-0.024675-0.19110.424535
47-0.006523-0.05050.479934
48-0.013725-0.10630.457844
490.0182140.14110.444139
50-0.023594-0.18280.427801
510.0280370.21720.414406
520.0084460.06540.474028
530.005510.04270.483049
54-0.006304-0.04880.480608
550.0104280.08080.467944
560.0029450.02280.490938
57-0.003508-0.02720.489207
580.0061890.04790.480962
590.0001630.00130.499499
60NANANA

\begin{tabular}{lllllllll}
\hline
Autocorrelation Function \tabularnewline
Time lag k & ACF(k) & T-STAT & P-value \tabularnewline
1 & 0.190379 & 1.4747 & 0.072765 \tabularnewline
2 & 0.190992 & 1.4794 & 0.07213 \tabularnewline
3 & 0.346925 & 2.6873 & 0.004654 \tabularnewline
4 & 0.212795 & 1.6483 & 0.052259 \tabularnewline
5 & 0.144006 & 1.1155 & 0.134549 \tabularnewline
6 & 0.14731 & 1.1411 & 0.129189 \tabularnewline
7 & 0.051293 & 0.3973 & 0.346274 \tabularnewline
8 & 0.210145 & 1.6278 & 0.054406 \tabularnewline
9 & -0.00231 & -0.0179 & 0.49289 \tabularnewline
10 & -0.137838 & -1.0677 & 0.144969 \tabularnewline
11 & 0.249614 & 1.9335 & 0.028948 \tabularnewline
12 & 0.029699 & 0.23 & 0.409418 \tabularnewline
13 & -0.065332 & -0.5061 & 0.307335 \tabularnewline
14 & 0.092424 & 0.7159 & 0.23841 \tabularnewline
15 & 0.077644 & 0.6014 & 0.274911 \tabularnewline
16 & 0.045079 & 0.3492 & 0.364087 \tabularnewline
17 & 0.037881 & 0.2934 & 0.385106 \tabularnewline
18 & -0.010613 & -0.0822 & 0.467379 \tabularnewline
19 & 0.052682 & 0.4081 & 0.342337 \tabularnewline
20 & -0.052485 & -0.4065 & 0.342893 \tabularnewline
21 & -0.212609 & -1.6469 & 0.052407 \tabularnewline
22 & -0.109339 & -0.8469 & 0.200199 \tabularnewline
23 & -0.043907 & -0.3401 & 0.367484 \tabularnewline
24 & -0.221284 & -1.7141 & 0.04584 \tabularnewline
25 & -0.189192 & -1.4655 & 0.074006 \tabularnewline
26 & -0.142624 & -1.1048 & 0.136837 \tabularnewline
27 & -0.193519 & -1.499 & 0.06956 \tabularnewline
28 & -0.152767 & -1.1833 & 0.120673 \tabularnewline
29 & -0.096454 & -0.7471 & 0.228951 \tabularnewline
30 & -0.109249 & -0.8462 & 0.200392 \tabularnewline
31 & -0.013457 & -0.1042 & 0.458663 \tabularnewline
32 & -0.134701 & -1.0434 & 0.150478 \tabularnewline
33 & -0.052617 & -0.4076 & 0.342521 \tabularnewline
34 & 0.018748 & 0.1452 & 0.442513 \tabularnewline
35 & 0.01565 & 0.1212 & 0.45196 \tabularnewline
36 & -0.069653 & -0.5395 & 0.295758 \tabularnewline
37 & -0.039869 & -0.3088 & 0.379262 \tabularnewline
38 & -0.055225 & -0.4278 & 0.335174 \tabularnewline
39 & -0.089976 & -0.697 & 0.244261 \tabularnewline
40 & -0.069616 & -0.5392 & 0.295857 \tabularnewline
41 & -0.135116 & -1.0466 & 0.149739 \tabularnewline
42 & -0.079543 & -0.6161 & 0.270067 \tabularnewline
43 & -0.049514 & -0.3835 & 0.35134 \tabularnewline
44 & -0.036291 & -0.2811 & 0.389796 \tabularnewline
45 & -0.049769 & -0.3855 & 0.350613 \tabularnewline
46 & -0.024675 & -0.1911 & 0.424535 \tabularnewline
47 & -0.006523 & -0.0505 & 0.479934 \tabularnewline
48 & -0.013725 & -0.1063 & 0.457844 \tabularnewline
49 & 0.018214 & 0.1411 & 0.444139 \tabularnewline
50 & -0.023594 & -0.1828 & 0.427801 \tabularnewline
51 & 0.028037 & 0.2172 & 0.414406 \tabularnewline
52 & 0.008446 & 0.0654 & 0.474028 \tabularnewline
53 & 0.00551 & 0.0427 & 0.483049 \tabularnewline
54 & -0.006304 & -0.0488 & 0.480608 \tabularnewline
55 & 0.010428 & 0.0808 & 0.467944 \tabularnewline
56 & 0.002945 & 0.0228 & 0.490938 \tabularnewline
57 & -0.003508 & -0.0272 & 0.489207 \tabularnewline
58 & 0.006189 & 0.0479 & 0.480962 \tabularnewline
59 & 0.000163 & 0.0013 & 0.499499 \tabularnewline
60 & NA & NA & NA \tabularnewline
\hline
\end{tabular}
%Source: https://freestatistics.org/blog/index.php?pk=107418&T=1

[TABLE]
[ROW][C]Autocorrelation Function[/C][/ROW]
[ROW][C]Time lag k[/C][C]ACF(k)[/C][C]T-STAT[/C][C]P-value[/C][/ROW]
[ROW][C]1[/C][C]0.190379[/C][C]1.4747[/C][C]0.072765[/C][/ROW]
[ROW][C]2[/C][C]0.190992[/C][C]1.4794[/C][C]0.07213[/C][/ROW]
[ROW][C]3[/C][C]0.346925[/C][C]2.6873[/C][C]0.004654[/C][/ROW]
[ROW][C]4[/C][C]0.212795[/C][C]1.6483[/C][C]0.052259[/C][/ROW]
[ROW][C]5[/C][C]0.144006[/C][C]1.1155[/C][C]0.134549[/C][/ROW]
[ROW][C]6[/C][C]0.14731[/C][C]1.1411[/C][C]0.129189[/C][/ROW]
[ROW][C]7[/C][C]0.051293[/C][C]0.3973[/C][C]0.346274[/C][/ROW]
[ROW][C]8[/C][C]0.210145[/C][C]1.6278[/C][C]0.054406[/C][/ROW]
[ROW][C]9[/C][C]-0.00231[/C][C]-0.0179[/C][C]0.49289[/C][/ROW]
[ROW][C]10[/C][C]-0.137838[/C][C]-1.0677[/C][C]0.144969[/C][/ROW]
[ROW][C]11[/C][C]0.249614[/C][C]1.9335[/C][C]0.028948[/C][/ROW]
[ROW][C]12[/C][C]0.029699[/C][C]0.23[/C][C]0.409418[/C][/ROW]
[ROW][C]13[/C][C]-0.065332[/C][C]-0.5061[/C][C]0.307335[/C][/ROW]
[ROW][C]14[/C][C]0.092424[/C][C]0.7159[/C][C]0.23841[/C][/ROW]
[ROW][C]15[/C][C]0.077644[/C][C]0.6014[/C][C]0.274911[/C][/ROW]
[ROW][C]16[/C][C]0.045079[/C][C]0.3492[/C][C]0.364087[/C][/ROW]
[ROW][C]17[/C][C]0.037881[/C][C]0.2934[/C][C]0.385106[/C][/ROW]
[ROW][C]18[/C][C]-0.010613[/C][C]-0.0822[/C][C]0.467379[/C][/ROW]
[ROW][C]19[/C][C]0.052682[/C][C]0.4081[/C][C]0.342337[/C][/ROW]
[ROW][C]20[/C][C]-0.052485[/C][C]-0.4065[/C][C]0.342893[/C][/ROW]
[ROW][C]21[/C][C]-0.212609[/C][C]-1.6469[/C][C]0.052407[/C][/ROW]
[ROW][C]22[/C][C]-0.109339[/C][C]-0.8469[/C][C]0.200199[/C][/ROW]
[ROW][C]23[/C][C]-0.043907[/C][C]-0.3401[/C][C]0.367484[/C][/ROW]
[ROW][C]24[/C][C]-0.221284[/C][C]-1.7141[/C][C]0.04584[/C][/ROW]
[ROW][C]25[/C][C]-0.189192[/C][C]-1.4655[/C][C]0.074006[/C][/ROW]
[ROW][C]26[/C][C]-0.142624[/C][C]-1.1048[/C][C]0.136837[/C][/ROW]
[ROW][C]27[/C][C]-0.193519[/C][C]-1.499[/C][C]0.06956[/C][/ROW]
[ROW][C]28[/C][C]-0.152767[/C][C]-1.1833[/C][C]0.120673[/C][/ROW]
[ROW][C]29[/C][C]-0.096454[/C][C]-0.7471[/C][C]0.228951[/C][/ROW]
[ROW][C]30[/C][C]-0.109249[/C][C]-0.8462[/C][C]0.200392[/C][/ROW]
[ROW][C]31[/C][C]-0.013457[/C][C]-0.1042[/C][C]0.458663[/C][/ROW]
[ROW][C]32[/C][C]-0.134701[/C][C]-1.0434[/C][C]0.150478[/C][/ROW]
[ROW][C]33[/C][C]-0.052617[/C][C]-0.4076[/C][C]0.342521[/C][/ROW]
[ROW][C]34[/C][C]0.018748[/C][C]0.1452[/C][C]0.442513[/C][/ROW]
[ROW][C]35[/C][C]0.01565[/C][C]0.1212[/C][C]0.45196[/C][/ROW]
[ROW][C]36[/C][C]-0.069653[/C][C]-0.5395[/C][C]0.295758[/C][/ROW]
[ROW][C]37[/C][C]-0.039869[/C][C]-0.3088[/C][C]0.379262[/C][/ROW]
[ROW][C]38[/C][C]-0.055225[/C][C]-0.4278[/C][C]0.335174[/C][/ROW]
[ROW][C]39[/C][C]-0.089976[/C][C]-0.697[/C][C]0.244261[/C][/ROW]
[ROW][C]40[/C][C]-0.069616[/C][C]-0.5392[/C][C]0.295857[/C][/ROW]
[ROW][C]41[/C][C]-0.135116[/C][C]-1.0466[/C][C]0.149739[/C][/ROW]
[ROW][C]42[/C][C]-0.079543[/C][C]-0.6161[/C][C]0.270067[/C][/ROW]
[ROW][C]43[/C][C]-0.049514[/C][C]-0.3835[/C][C]0.35134[/C][/ROW]
[ROW][C]44[/C][C]-0.036291[/C][C]-0.2811[/C][C]0.389796[/C][/ROW]
[ROW][C]45[/C][C]-0.049769[/C][C]-0.3855[/C][C]0.350613[/C][/ROW]
[ROW][C]46[/C][C]-0.024675[/C][C]-0.1911[/C][C]0.424535[/C][/ROW]
[ROW][C]47[/C][C]-0.006523[/C][C]-0.0505[/C][C]0.479934[/C][/ROW]
[ROW][C]48[/C][C]-0.013725[/C][C]-0.1063[/C][C]0.457844[/C][/ROW]
[ROW][C]49[/C][C]0.018214[/C][C]0.1411[/C][C]0.444139[/C][/ROW]
[ROW][C]50[/C][C]-0.023594[/C][C]-0.1828[/C][C]0.427801[/C][/ROW]
[ROW][C]51[/C][C]0.028037[/C][C]0.2172[/C][C]0.414406[/C][/ROW]
[ROW][C]52[/C][C]0.008446[/C][C]0.0654[/C][C]0.474028[/C][/ROW]
[ROW][C]53[/C][C]0.00551[/C][C]0.0427[/C][C]0.483049[/C][/ROW]
[ROW][C]54[/C][C]-0.006304[/C][C]-0.0488[/C][C]0.480608[/C][/ROW]
[ROW][C]55[/C][C]0.010428[/C][C]0.0808[/C][C]0.467944[/C][/ROW]
[ROW][C]56[/C][C]0.002945[/C][C]0.0228[/C][C]0.490938[/C][/ROW]
[ROW][C]57[/C][C]-0.003508[/C][C]-0.0272[/C][C]0.489207[/C][/ROW]
[ROW][C]58[/C][C]0.006189[/C][C]0.0479[/C][C]0.480962[/C][/ROW]
[ROW][C]59[/C][C]0.000163[/C][C]0.0013[/C][C]0.499499[/C][/ROW]
[ROW][C]60[/C][C]NA[/C][C]NA[/C][C]NA[/C][/ROW]
[/TABLE]
Source: https://freestatistics.org/blog/index.php?pk=107418&T=1

Globally Unique Identifier (entire table): ba.freestatistics.org/blog/index.php?pk=107418&T=1

As an alternative you can also use a QR Code:  

The GUIDs for individual cells are displayed in the table below:

Autocorrelation Function
Time lag kACF(k)T-STATP-value
10.1903791.47470.072765
20.1909921.47940.07213
30.3469252.68730.004654
40.2127951.64830.052259
50.1440061.11550.134549
60.147311.14110.129189
70.0512930.39730.346274
80.2101451.62780.054406
9-0.00231-0.01790.49289
10-0.137838-1.06770.144969
110.2496141.93350.028948
120.0296990.230.409418
13-0.065332-0.50610.307335
140.0924240.71590.23841
150.0776440.60140.274911
160.0450790.34920.364087
170.0378810.29340.385106
18-0.010613-0.08220.467379
190.0526820.40810.342337
20-0.052485-0.40650.342893
21-0.212609-1.64690.052407
22-0.109339-0.84690.200199
23-0.043907-0.34010.367484
24-0.221284-1.71410.04584
25-0.189192-1.46550.074006
26-0.142624-1.10480.136837
27-0.193519-1.4990.06956
28-0.152767-1.18330.120673
29-0.096454-0.74710.228951
30-0.109249-0.84620.200392
31-0.013457-0.10420.458663
32-0.134701-1.04340.150478
33-0.052617-0.40760.342521
340.0187480.14520.442513
350.015650.12120.45196
36-0.069653-0.53950.295758
37-0.039869-0.30880.379262
38-0.055225-0.42780.335174
39-0.089976-0.6970.244261
40-0.069616-0.53920.295857
41-0.135116-1.04660.149739
42-0.079543-0.61610.270067
43-0.049514-0.38350.35134
44-0.036291-0.28110.389796
45-0.049769-0.38550.350613
46-0.024675-0.19110.424535
47-0.006523-0.05050.479934
48-0.013725-0.10630.457844
490.0182140.14110.444139
50-0.023594-0.18280.427801
510.0280370.21720.414406
520.0084460.06540.474028
530.005510.04270.483049
54-0.006304-0.04880.480608
550.0104280.08080.467944
560.0029450.02280.490938
57-0.003508-0.02720.489207
580.0061890.04790.480962
590.0001630.00130.499499
60NANANA


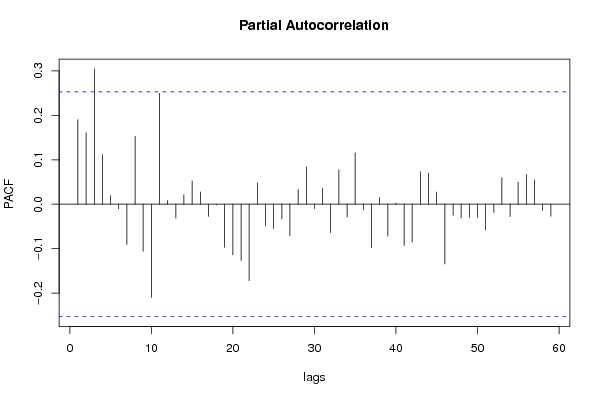
Partial Autocorrelation Function
Time lag kPACF(k)T-STATP-value
10.1903791.47470.072765
20.1605671.24380.109214
30.3044322.35810.010822
40.1114910.86360.195622
50.0191590.14840.44126
6-0.010418-0.08070.467977
7-0.09057-0.70160.242834
80.1524941.18120.12109
9-0.105605-0.8180.208294
10-0.209762-1.62480.054722
110.2494961.93260.029006
120.0082450.06390.474644
13-0.031246-0.2420.404792
140.021320.16510.434692
150.0526770.4080.34235
160.0277260.21480.41534
17-0.027604-0.21380.415706
18-0.001508-0.01170.495359
19-0.096779-0.74960.228199
20-0.114286-0.88530.189776
21-0.126868-0.98270.164847
22-0.172091-1.3330.093784
230.0479580.37150.355794
24-0.048709-0.37730.353642
25-0.054637-0.42320.336825
26-0.033507-0.25950.398053
27-0.07106-0.55040.292034
280.0331610.25690.399082
290.0838610.64960.259221
30-0.009699-0.07510.47018
310.0361450.280.39023
32-0.06388-0.49480.31127
330.077420.59970.275485
34-0.028669-0.22210.412507
350.1154530.89430.187368
36-0.012353-0.09570.462046
37-0.097934-0.75860.225532
380.0146770.11370.454932
39-0.071878-0.55680.289881
400.0027960.02170.491397
41-0.092934-0.71990.237201
42-0.085289-0.66060.255685
430.0733470.56810.286029
440.070260.54420.294151
450.0274180.21240.416265
46-0.134499-1.04180.150836
47-0.024564-0.19030.424869
48-0.030596-0.2370.406732
49-0.029461-0.22820.410133
50-0.029751-0.23050.409263
51-0.057383-0.44450.329145
52-0.018795-0.14560.442367
530.0593210.45950.323769
54-0.027912-0.21620.414782
550.0497270.38520.350731
560.0671180.51990.302526
570.0545850.42280.336971
58-0.01375-0.10650.457768
59-0.027159-0.21040.417045
60NANANA

\begin{tabular}{lllllllll}
\hline
Partial Autocorrelation Function \tabularnewline
Time lag k & PACF(k) & T-STAT & P-value \tabularnewline
1 & 0.190379 & 1.4747 & 0.072765 \tabularnewline
2 & 0.160567 & 1.2438 & 0.109214 \tabularnewline
3 & 0.304432 & 2.3581 & 0.010822 \tabularnewline
4 & 0.111491 & 0.8636 & 0.195622 \tabularnewline
5 & 0.019159 & 0.1484 & 0.44126 \tabularnewline
6 & -0.010418 & -0.0807 & 0.467977 \tabularnewline
7 & -0.09057 & -0.7016 & 0.242834 \tabularnewline
8 & 0.152494 & 1.1812 & 0.12109 \tabularnewline
9 & -0.105605 & -0.818 & 0.208294 \tabularnewline
10 & -0.209762 & -1.6248 & 0.054722 \tabularnewline
11 & 0.249496 & 1.9326 & 0.029006 \tabularnewline
12 & 0.008245 & 0.0639 & 0.474644 \tabularnewline
13 & -0.031246 & -0.242 & 0.404792 \tabularnewline
14 & 0.02132 & 0.1651 & 0.434692 \tabularnewline
15 & 0.052677 & 0.408 & 0.34235 \tabularnewline
16 & 0.027726 & 0.2148 & 0.41534 \tabularnewline
17 & -0.027604 & -0.2138 & 0.415706 \tabularnewline
18 & -0.001508 & -0.0117 & 0.495359 \tabularnewline
19 & -0.096779 & -0.7496 & 0.228199 \tabularnewline
20 & -0.114286 & -0.8853 & 0.189776 \tabularnewline
21 & -0.126868 & -0.9827 & 0.164847 \tabularnewline
22 & -0.172091 & -1.333 & 0.093784 \tabularnewline
23 & 0.047958 & 0.3715 & 0.355794 \tabularnewline
24 & -0.048709 & -0.3773 & 0.353642 \tabularnewline
25 & -0.054637 & -0.4232 & 0.336825 \tabularnewline
26 & -0.033507 & -0.2595 & 0.398053 \tabularnewline
27 & -0.07106 & -0.5504 & 0.292034 \tabularnewline
28 & 0.033161 & 0.2569 & 0.399082 \tabularnewline
29 & 0.083861 & 0.6496 & 0.259221 \tabularnewline
30 & -0.009699 & -0.0751 & 0.47018 \tabularnewline
31 & 0.036145 & 0.28 & 0.39023 \tabularnewline
32 & -0.06388 & -0.4948 & 0.31127 \tabularnewline
33 & 0.07742 & 0.5997 & 0.275485 \tabularnewline
34 & -0.028669 & -0.2221 & 0.412507 \tabularnewline
35 & 0.115453 & 0.8943 & 0.187368 \tabularnewline
36 & -0.012353 & -0.0957 & 0.462046 \tabularnewline
37 & -0.097934 & -0.7586 & 0.225532 \tabularnewline
38 & 0.014677 & 0.1137 & 0.454932 \tabularnewline
39 & -0.071878 & -0.5568 & 0.289881 \tabularnewline
40 & 0.002796 & 0.0217 & 0.491397 \tabularnewline
41 & -0.092934 & -0.7199 & 0.237201 \tabularnewline
42 & -0.085289 & -0.6606 & 0.255685 \tabularnewline
43 & 0.073347 & 0.5681 & 0.286029 \tabularnewline
44 & 0.07026 & 0.5442 & 0.294151 \tabularnewline
45 & 0.027418 & 0.2124 & 0.416265 \tabularnewline
46 & -0.134499 & -1.0418 & 0.150836 \tabularnewline
47 & -0.024564 & -0.1903 & 0.424869 \tabularnewline
48 & -0.030596 & -0.237 & 0.406732 \tabularnewline
49 & -0.029461 & -0.2282 & 0.410133 \tabularnewline
50 & -0.029751 & -0.2305 & 0.409263 \tabularnewline
51 & -0.057383 & -0.4445 & 0.329145 \tabularnewline
52 & -0.018795 & -0.1456 & 0.442367 \tabularnewline
53 & 0.059321 & 0.4595 & 0.323769 \tabularnewline
54 & -0.027912 & -0.2162 & 0.414782 \tabularnewline
55 & 0.049727 & 0.3852 & 0.350731 \tabularnewline
56 & 0.067118 & 0.5199 & 0.302526 \tabularnewline
57 & 0.054585 & 0.4228 & 0.336971 \tabularnewline
58 & -0.01375 & -0.1065 & 0.457768 \tabularnewline
59 & -0.027159 & -0.2104 & 0.417045 \tabularnewline
60 & NA & NA & NA \tabularnewline
\hline
\end{tabular}
%Source: https://freestatistics.org/blog/index.php?pk=107418&T=2

[TABLE]
[ROW][C]Partial Autocorrelation Function[/C][/ROW]
[ROW][C]Time lag k[/C][C]PACF(k)[/C][C]T-STAT[/C][C]P-value[/C][/ROW]
[ROW][C]1[/C][C]0.190379[/C][C]1.4747[/C][C]0.072765[/C][/ROW]
[ROW][C]2[/C][C]0.160567[/C][C]1.2438[/C][C]0.109214[/C][/ROW]
[ROW][C]3[/C][C]0.304432[/C][C]2.3581[/C][C]0.010822[/C][/ROW]
[ROW][C]4[/C][C]0.111491[/C][C]0.8636[/C][C]0.195622[/C][/ROW]
[ROW][C]5[/C][C]0.019159[/C][C]0.1484[/C][C]0.44126[/C][/ROW]
[ROW][C]6[/C][C]-0.010418[/C][C]-0.0807[/C][C]0.467977[/C][/ROW]
[ROW][C]7[/C][C]-0.09057[/C][C]-0.7016[/C][C]0.242834[/C][/ROW]
[ROW][C]8[/C][C]0.152494[/C][C]1.1812[/C][C]0.12109[/C][/ROW]
[ROW][C]9[/C][C]-0.105605[/C][C]-0.818[/C][C]0.208294[/C][/ROW]
[ROW][C]10[/C][C]-0.209762[/C][C]-1.6248[/C][C]0.054722[/C][/ROW]
[ROW][C]11[/C][C]0.249496[/C][C]1.9326[/C][C]0.029006[/C][/ROW]
[ROW][C]12[/C][C]0.008245[/C][C]0.0639[/C][C]0.474644[/C][/ROW]
[ROW][C]13[/C][C]-0.031246[/C][C]-0.242[/C][C]0.404792[/C][/ROW]
[ROW][C]14[/C][C]0.02132[/C][C]0.1651[/C][C]0.434692[/C][/ROW]
[ROW][C]15[/C][C]0.052677[/C][C]0.408[/C][C]0.34235[/C][/ROW]
[ROW][C]16[/C][C]0.027726[/C][C]0.2148[/C][C]0.41534[/C][/ROW]
[ROW][C]17[/C][C]-0.027604[/C][C]-0.2138[/C][C]0.415706[/C][/ROW]
[ROW][C]18[/C][C]-0.001508[/C][C]-0.0117[/C][C]0.495359[/C][/ROW]
[ROW][C]19[/C][C]-0.096779[/C][C]-0.7496[/C][C]0.228199[/C][/ROW]
[ROW][C]20[/C][C]-0.114286[/C][C]-0.8853[/C][C]0.189776[/C][/ROW]
[ROW][C]21[/C][C]-0.126868[/C][C]-0.9827[/C][C]0.164847[/C][/ROW]
[ROW][C]22[/C][C]-0.172091[/C][C]-1.333[/C][C]0.093784[/C][/ROW]
[ROW][C]23[/C][C]0.047958[/C][C]0.3715[/C][C]0.355794[/C][/ROW]
[ROW][C]24[/C][C]-0.048709[/C][C]-0.3773[/C][C]0.353642[/C][/ROW]
[ROW][C]25[/C][C]-0.054637[/C][C]-0.4232[/C][C]0.336825[/C][/ROW]
[ROW][C]26[/C][C]-0.033507[/C][C]-0.2595[/C][C]0.398053[/C][/ROW]
[ROW][C]27[/C][C]-0.07106[/C][C]-0.5504[/C][C]0.292034[/C][/ROW]
[ROW][C]28[/C][C]0.033161[/C][C]0.2569[/C][C]0.399082[/C][/ROW]
[ROW][C]29[/C][C]0.083861[/C][C]0.6496[/C][C]0.259221[/C][/ROW]
[ROW][C]30[/C][C]-0.009699[/C][C]-0.0751[/C][C]0.47018[/C][/ROW]
[ROW][C]31[/C][C]0.036145[/C][C]0.28[/C][C]0.39023[/C][/ROW]
[ROW][C]32[/C][C]-0.06388[/C][C]-0.4948[/C][C]0.31127[/C][/ROW]
[ROW][C]33[/C][C]0.07742[/C][C]0.5997[/C][C]0.275485[/C][/ROW]
[ROW][C]34[/C][C]-0.028669[/C][C]-0.2221[/C][C]0.412507[/C][/ROW]
[ROW][C]35[/C][C]0.115453[/C][C]0.8943[/C][C]0.187368[/C][/ROW]
[ROW][C]36[/C][C]-0.012353[/C][C]-0.0957[/C][C]0.462046[/C][/ROW]
[ROW][C]37[/C][C]-0.097934[/C][C]-0.7586[/C][C]0.225532[/C][/ROW]
[ROW][C]38[/C][C]0.014677[/C][C]0.1137[/C][C]0.454932[/C][/ROW]
[ROW][C]39[/C][C]-0.071878[/C][C]-0.5568[/C][C]0.289881[/C][/ROW]
[ROW][C]40[/C][C]0.002796[/C][C]0.0217[/C][C]0.491397[/C][/ROW]
[ROW][C]41[/C][C]-0.092934[/C][C]-0.7199[/C][C]0.237201[/C][/ROW]
[ROW][C]42[/C][C]-0.085289[/C][C]-0.6606[/C][C]0.255685[/C][/ROW]
[ROW][C]43[/C][C]0.073347[/C][C]0.5681[/C][C]0.286029[/C][/ROW]
[ROW][C]44[/C][C]0.07026[/C][C]0.5442[/C][C]0.294151[/C][/ROW]
[ROW][C]45[/C][C]0.027418[/C][C]0.2124[/C][C]0.416265[/C][/ROW]
[ROW][C]46[/C][C]-0.134499[/C][C]-1.0418[/C][C]0.150836[/C][/ROW]
[ROW][C]47[/C][C]-0.024564[/C][C]-0.1903[/C][C]0.424869[/C][/ROW]
[ROW][C]48[/C][C]-0.030596[/C][C]-0.237[/C][C]0.406732[/C][/ROW]
[ROW][C]49[/C][C]-0.029461[/C][C]-0.2282[/C][C]0.410133[/C][/ROW]
[ROW][C]50[/C][C]-0.029751[/C][C]-0.2305[/C][C]0.409263[/C][/ROW]
[ROW][C]51[/C][C]-0.057383[/C][C]-0.4445[/C][C]0.329145[/C][/ROW]
[ROW][C]52[/C][C]-0.018795[/C][C]-0.1456[/C][C]0.442367[/C][/ROW]
[ROW][C]53[/C][C]0.059321[/C][C]0.4595[/C][C]0.323769[/C][/ROW]
[ROW][C]54[/C][C]-0.027912[/C][C]-0.2162[/C][C]0.414782[/C][/ROW]
[ROW][C]55[/C][C]0.049727[/C][C]0.3852[/C][C]0.350731[/C][/ROW]
[ROW][C]56[/C][C]0.067118[/C][C]0.5199[/C][C]0.302526[/C][/ROW]
[ROW][C]57[/C][C]0.054585[/C][C]0.4228[/C][C]0.336971[/C][/ROW]
[ROW][C]58[/C][C]-0.01375[/C][C]-0.1065[/C][C]0.457768[/C][/ROW]
[ROW][C]59[/C][C]-0.027159[/C][C]-0.2104[/C][C]0.417045[/C][/ROW]
[ROW][C]60[/C][C]NA[/C][C]NA[/C][C]NA[/C][/ROW]
[/TABLE]
Source: https://freestatistics.org/blog/index.php?pk=107418&T=2

Globally Unique Identifier (entire table): ba.freestatistics.org/blog/index.php?pk=107418&T=2

As an alternative you can also use a QR Code:  

The GUIDs for individual cells are displayed in the table below:

Partial Autocorrelation Function
Time lag kPACF(k)T-STATP-value
10.1903791.47470.072765
20.1605671.24380.109214
30.3044322.35810.010822
40.1114910.86360.195622
50.0191590.14840.44126
6-0.010418-0.08070.467977
7-0.09057-0.70160.242834
80.1524941.18120.12109
9-0.105605-0.8180.208294
10-0.209762-1.62480.054722
110.2494961.93260.029006
120.0082450.06390.474644
13-0.031246-0.2420.404792
140.021320.16510.434692
150.0526770.4080.34235
160.0277260.21480.41534
17-0.027604-0.21380.415706
18-0.001508-0.01170.495359
19-0.096779-0.74960.228199
20-0.114286-0.88530.189776
21-0.126868-0.98270.164847
22-0.172091-1.3330.093784
230.0479580.37150.355794
24-0.048709-0.37730.353642
25-0.054637-0.42320.336825
26-0.033507-0.25950.398053
27-0.07106-0.55040.292034
280.0331610.25690.399082
290.0838610.64960.259221
30-0.009699-0.07510.47018
310.0361450.280.39023
32-0.06388-0.49480.31127
330.077420.59970.275485
34-0.028669-0.22210.412507
350.1154530.89430.187368
36-0.012353-0.09570.462046
37-0.097934-0.75860.225532
380.0146770.11370.454932
39-0.071878-0.55680.289881
400.0027960.02170.491397
41-0.092934-0.71990.237201
42-0.085289-0.66060.255685
430.0733470.56810.286029
440.070260.54420.294151
450.0274180.21240.416265
46-0.134499-1.04180.150836
47-0.024564-0.19030.424869
48-0.030596-0.2370.406732
49-0.029461-0.22820.410133
50-0.029751-0.23050.409263
51-0.057383-0.44450.329145
52-0.018795-0.14560.442367
530.0593210.45950.323769
54-0.027912-0.21620.414782
550.0497270.38520.350731
560.0671180.51990.302526
570.0545850.42280.336971
58-0.01375-0.10650.457768
59-0.027159-0.21040.417045
60NANANA


Parameters (Session):
par1 = 60 ; par2 = 1 ; par3 = 1 ; par4 = 1 ; par5 = 12 ; par6 = White Noise ; par7 = 0.95 ;
Parameters (R input):
par1 = 60 ; par2 = 1 ; par3 = 1 ; par4 = 1 ; par5 = 12 ; par6 = White Noise ; par7 = 0.95 ;
R code (references can be found in the software module):
if (par1 == 'Default') {
par1 = 10*log10(length(x))
} else {
par1 <- as.numeric(par1)
}
par2 <- as.numeric(par2)
par3 <- as.numeric(par3)
par4 <- as.numeric(par4)
par5 <- as.numeric(par5)
if (par6 == 'White Noise') par6 <- 'white' else par6 <- 'ma'
par7 <- as.numeric(par7)
if (par2 == 0) {
x <- log(x)
} else {
x <- (x ^ par2 - 1) / par2
}
if (par3 > 0) x <- diff(x,lag=1,difference=par3)
if (par4 > 0) x <- diff(x,lag=par5,difference=par4)
bitmap(file='pic1.png')
racf <- acf(x, par1, main='Autocorrelation', xlab='time lag', ylab='ACF', ci.type=par6, ci=par7, sub=paste('(lambda=',par2,', d=',par3,', D=',par4,', CI=', par7, ', CI type=',par6,')',sep=''))
dev.off()
bitmap(file='pic2.png')
rpacf <- pacf(x,par1,main='Partial Autocorrelation',xlab='lags',ylab='PACF')
dev.off()
(myacf <- c(racf$acf))
(mypacf <- c(rpacf$acf))
lengthx <- length(x)
sqrtn <- sqrt(lengthx)
load(file='createtable')
a<-table.start()
a<-table.row.start(a)
a<-table.element(a,'Autocorrelation Function',4,TRUE)
a<-table.row.end(a)
a<-table.row.start(a)
a<-table.element(a,'Time lag k',header=TRUE)
a<-table.element(a,hyperlink('basics.htm','ACF(k)','click here for more information about the Autocorrelation Function'),header=TRUE)
a<-table.element(a,'T-STAT',header=TRUE)
a<-table.element(a,'P-value',header=TRUE)
a<-table.row.end(a)
for (i in 2:(par1+1)) {
a<-table.row.start(a)
a<-table.element(a,i-1,header=TRUE)
a<-table.element(a,round(myacf[i],6))
mytstat <- myacf[i]*sqrtn
a<-table.element(a,round(mytstat,4))
a<-table.element(a,round(1-pt(abs(mytstat),lengthx),6))
a<-table.row.end(a)
}
a<-table.end(a)
table.save(a,file='mytable.tab')
a<-table.start()
a<-table.row.start(a)
a<-table.element(a,'Partial Autocorrelation Function',4,TRUE)
a<-table.row.end(a)
a<-table.row.start(a)
a<-table.element(a,'Time lag k',header=TRUE)
a<-table.element(a,hyperlink('basics.htm','PACF(k)','click here for more information about the Partial Autocorrelation Function'),header=TRUE)
a<-table.element(a,'T-STAT',header=TRUE)
a<-table.element(a,'P-value',header=TRUE)
a<-table.row.end(a)
for (i in 1:par1) {
a<-table.row.start(a)
a<-table.element(a,i,header=TRUE)
a<-table.element(a,round(mypacf[i],6))
mytstat <- mypacf[i]*sqrtn
a<-table.element(a,round(mytstat,4))
a<-table.element(a,round(1-pt(abs(mytstat),lengthx),6))
a<-table.row.end(a)
}
a<-table.end(a)
table.save(a,file='mytable1.tab')