Free Statistics

of Irreproducible Research!

Author's title

Author*The author of this computation has been verified*
R Software Modulerwasp_autocorrelation.wasp
Title produced by software(Partial) Autocorrelation Function
Date of computationThu, 09 Dec 2010 21:14:29 +0000
Cite this page as followsStatistical Computations at FreeStatistics.org, Office for Research Development and Education, URL https://freestatistics.org/blog/index.php?v=date/2010/Dec/09/t1291929152f4i96ivoibzet1e.htm/, Retrieved Mon, 29 Apr 2024 03:51:00 +0000
Statistical Computations at FreeStatistics.org, Office for Research Development and Education, URL https://freestatistics.org/blog/index.php?pk=107416, Retrieved Mon, 29 Apr 2024 03:51:00 +0000
QR Codes:

Original text written by user:
IsPrivate?No (this computation is public)
User-defined keywords
Estimated Impact111
Family? (F = Feedback message, R = changed R code, M = changed R Module, P = changed Parameters, D = changed Data)
-       [(Partial) Autocorrelation Function] [Paper - Werkloosh...] [2010-12-09 21:14:29] [cfd788255f1b1b5389e58d7f218c70bf] [Current]
Feedback Forum

Post a new message
Dataseries X:
376.974
377.632
378.205
370.861
369.167
371.551
382.842
381.903
384.502
392.058
384.359
388.884
386.586
387.495
385.705
378.67
377.367
376.911
389.827
387.82
387.267
380.575
372.402
376.74
377.795
376.126
370.804
367.98
367.866
366.121
379.421
378.519
372.423
355.072
344.693
342.892
344.178
337.606
327.103
323.953
316.532
306.307
327.225
329.573
313.761
307.836
300.074
304.198
306.122
300.414
292.133
290.616
280.244
285.179
305.486
305.957
293.886
289.441
288.776
299.149
306.532
309.914
313.468
314.901
309.16
316.15
336.544
339.196
326.738
320.838
318.62
331.533
335.378


Summary of computational transaction
Raw Inputview raw input (R code)
Raw Outputview raw output of R engine
Computing time2 seconds
R Server'George Udny Yule' @ 72.249.76.132

\begin{tabular}{lllllllll}
\hline
Summary of computational transaction \tabularnewline
Raw Input & view raw input (R code)  \tabularnewline
Raw Output & view raw output of R engine  \tabularnewline
Computing time & 2 seconds \tabularnewline
R Server & 'George Udny Yule' @ 72.249.76.132 \tabularnewline
\hline
\end{tabular}
%Source: https://freestatistics.org/blog/index.php?pk=107416&T=0

[TABLE]
[ROW][C]Summary of computational transaction[/C][/ROW]
[ROW][C]Raw Input[/C][C]view raw input (R code) [/C][/ROW]
[ROW][C]Raw Output[/C][C]view raw output of R engine [/C][/ROW]
[ROW][C]Computing time[/C][C]2 seconds[/C][/ROW]
[ROW][C]R Server[/C][C]'George Udny Yule' @ 72.249.76.132[/C][/ROW]
[/TABLE]
Source: https://freestatistics.org/blog/index.php?pk=107416&T=0

Globally Unique Identifier (entire table): ba.freestatistics.org/blog/index.php?pk=107416&T=0

As an alternative you can also use a QR Code:  

The GUIDs for individual cells are displayed in the table below:

Summary of computational transaction
Raw Inputview raw input (R code)
Raw Outputview raw output of R engine
Computing time2 seconds
R Server'George Udny Yule' @ 72.249.76.132


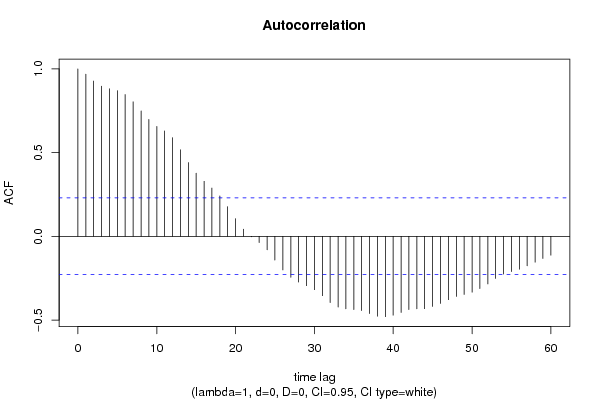
Autocorrelation Function
Time lag kACF(k)T-STATP-value
10.9688078.27750
20.9273357.92320
30.8972797.66640
40.881057.52770
50.87027.4350
60.8472597.2390
70.8037386.86710
80.7490036.39950
90.698425.96730
100.6567985.61170
110.6297335.38040
120.5894655.03642e-06
130.5167754.41531.7e-05
140.4405883.76440.000168
150.3769693.22080.000955
160.3288452.80960.003181
170.2883592.46370.008053
180.2412932.06160.021403
190.177181.51380.067194
200.1052740.89950.185681
210.0429240.36670.357437
22-0.002897-0.02470.490162
23-0.037359-0.31920.375245
24-0.080501-0.68780.246879
25-0.14203-1.21350.114425
26-0.200841-1.7160.045203
27-0.244602-2.08990.020056
28-0.273502-2.33680.011098
29-0.294753-2.51840.006991
30-0.318877-2.72450.004027
31-0.354966-3.03280.001677
32-0.395942-3.38290.000578
33-0.422652-3.61110.000278
34-0.433-3.69960.000208
35-0.437287-3.73620.000184
36-0.443722-3.79120.000153
37-0.461495-3.9439.1e-05
38-0.477586-4.08055.7e-05
39-0.479981-4.1015.3e-05
40-0.471294-4.02676.8e-05
41-0.454475-3.8830.000112
42-0.437497-3.7380.000183
43-0.433174-3.7010.000207
44-0.43209-3.69180.000213
45-0.418948-3.57950.000308
46-0.400655-3.42320.000509
47-0.378608-3.23480.000915
48-0.359209-3.06910.001507
49-0.347158-2.96610.002037
50-0.333834-2.85230.002821
51-0.312083-2.66640.004717
52-0.284201-2.42820.008819
53-0.251311-2.14720.017549
54-0.225486-1.92660.028964
55-0.21033-1.79710.038231
56-0.196782-1.68130.048488
57-0.176219-1.50560.068241
58-0.154241-1.31780.095839
59-0.132071-1.12840.13142
60-0.112988-0.96540.168774

\begin{tabular}{lllllllll}
\hline
Autocorrelation Function \tabularnewline
Time lag k & ACF(k) & T-STAT & P-value \tabularnewline
1 & 0.968807 & 8.2775 & 0 \tabularnewline
2 & 0.927335 & 7.9232 & 0 \tabularnewline
3 & 0.897279 & 7.6664 & 0 \tabularnewline
4 & 0.88105 & 7.5277 & 0 \tabularnewline
5 & 0.8702 & 7.435 & 0 \tabularnewline
6 & 0.847259 & 7.239 & 0 \tabularnewline
7 & 0.803738 & 6.8671 & 0 \tabularnewline
8 & 0.749003 & 6.3995 & 0 \tabularnewline
9 & 0.69842 & 5.9673 & 0 \tabularnewline
10 & 0.656798 & 5.6117 & 0 \tabularnewline
11 & 0.629733 & 5.3804 & 0 \tabularnewline
12 & 0.589465 & 5.0364 & 2e-06 \tabularnewline
13 & 0.516775 & 4.4153 & 1.7e-05 \tabularnewline
14 & 0.440588 & 3.7644 & 0.000168 \tabularnewline
15 & 0.376969 & 3.2208 & 0.000955 \tabularnewline
16 & 0.328845 & 2.8096 & 0.003181 \tabularnewline
17 & 0.288359 & 2.4637 & 0.008053 \tabularnewline
18 & 0.241293 & 2.0616 & 0.021403 \tabularnewline
19 & 0.17718 & 1.5138 & 0.067194 \tabularnewline
20 & 0.105274 & 0.8995 & 0.185681 \tabularnewline
21 & 0.042924 & 0.3667 & 0.357437 \tabularnewline
22 & -0.002897 & -0.0247 & 0.490162 \tabularnewline
23 & -0.037359 & -0.3192 & 0.375245 \tabularnewline
24 & -0.080501 & -0.6878 & 0.246879 \tabularnewline
25 & -0.14203 & -1.2135 & 0.114425 \tabularnewline
26 & -0.200841 & -1.716 & 0.045203 \tabularnewline
27 & -0.244602 & -2.0899 & 0.020056 \tabularnewline
28 & -0.273502 & -2.3368 & 0.011098 \tabularnewline
29 & -0.294753 & -2.5184 & 0.006991 \tabularnewline
30 & -0.318877 & -2.7245 & 0.004027 \tabularnewline
31 & -0.354966 & -3.0328 & 0.001677 \tabularnewline
32 & -0.395942 & -3.3829 & 0.000578 \tabularnewline
33 & -0.422652 & -3.6111 & 0.000278 \tabularnewline
34 & -0.433 & -3.6996 & 0.000208 \tabularnewline
35 & -0.437287 & -3.7362 & 0.000184 \tabularnewline
36 & -0.443722 & -3.7912 & 0.000153 \tabularnewline
37 & -0.461495 & -3.943 & 9.1e-05 \tabularnewline
38 & -0.477586 & -4.0805 & 5.7e-05 \tabularnewline
39 & -0.479981 & -4.101 & 5.3e-05 \tabularnewline
40 & -0.471294 & -4.0267 & 6.8e-05 \tabularnewline
41 & -0.454475 & -3.883 & 0.000112 \tabularnewline
42 & -0.437497 & -3.738 & 0.000183 \tabularnewline
43 & -0.433174 & -3.701 & 0.000207 \tabularnewline
44 & -0.43209 & -3.6918 & 0.000213 \tabularnewline
45 & -0.418948 & -3.5795 & 0.000308 \tabularnewline
46 & -0.400655 & -3.4232 & 0.000509 \tabularnewline
47 & -0.378608 & -3.2348 & 0.000915 \tabularnewline
48 & -0.359209 & -3.0691 & 0.001507 \tabularnewline
49 & -0.347158 & -2.9661 & 0.002037 \tabularnewline
50 & -0.333834 & -2.8523 & 0.002821 \tabularnewline
51 & -0.312083 & -2.6664 & 0.004717 \tabularnewline
52 & -0.284201 & -2.4282 & 0.008819 \tabularnewline
53 & -0.251311 & -2.1472 & 0.017549 \tabularnewline
54 & -0.225486 & -1.9266 & 0.028964 \tabularnewline
55 & -0.21033 & -1.7971 & 0.038231 \tabularnewline
56 & -0.196782 & -1.6813 & 0.048488 \tabularnewline
57 & -0.176219 & -1.5056 & 0.068241 \tabularnewline
58 & -0.154241 & -1.3178 & 0.095839 \tabularnewline
59 & -0.132071 & -1.1284 & 0.13142 \tabularnewline
60 & -0.112988 & -0.9654 & 0.168774 \tabularnewline
\hline
\end{tabular}
%Source: https://freestatistics.org/blog/index.php?pk=107416&T=1

[TABLE]
[ROW][C]Autocorrelation Function[/C][/ROW]
[ROW][C]Time lag k[/C][C]ACF(k)[/C][C]T-STAT[/C][C]P-value[/C][/ROW]
[ROW][C]1[/C][C]0.968807[/C][C]8.2775[/C][C]0[/C][/ROW]
[ROW][C]2[/C][C]0.927335[/C][C]7.9232[/C][C]0[/C][/ROW]
[ROW][C]3[/C][C]0.897279[/C][C]7.6664[/C][C]0[/C][/ROW]
[ROW][C]4[/C][C]0.88105[/C][C]7.5277[/C][C]0[/C][/ROW]
[ROW][C]5[/C][C]0.8702[/C][C]7.435[/C][C]0[/C][/ROW]
[ROW][C]6[/C][C]0.847259[/C][C]7.239[/C][C]0[/C][/ROW]
[ROW][C]7[/C][C]0.803738[/C][C]6.8671[/C][C]0[/C][/ROW]
[ROW][C]8[/C][C]0.749003[/C][C]6.3995[/C][C]0[/C][/ROW]
[ROW][C]9[/C][C]0.69842[/C][C]5.9673[/C][C]0[/C][/ROW]
[ROW][C]10[/C][C]0.656798[/C][C]5.6117[/C][C]0[/C][/ROW]
[ROW][C]11[/C][C]0.629733[/C][C]5.3804[/C][C]0[/C][/ROW]
[ROW][C]12[/C][C]0.589465[/C][C]5.0364[/C][C]2e-06[/C][/ROW]
[ROW][C]13[/C][C]0.516775[/C][C]4.4153[/C][C]1.7e-05[/C][/ROW]
[ROW][C]14[/C][C]0.440588[/C][C]3.7644[/C][C]0.000168[/C][/ROW]
[ROW][C]15[/C][C]0.376969[/C][C]3.2208[/C][C]0.000955[/C][/ROW]
[ROW][C]16[/C][C]0.328845[/C][C]2.8096[/C][C]0.003181[/C][/ROW]
[ROW][C]17[/C][C]0.288359[/C][C]2.4637[/C][C]0.008053[/C][/ROW]
[ROW][C]18[/C][C]0.241293[/C][C]2.0616[/C][C]0.021403[/C][/ROW]
[ROW][C]19[/C][C]0.17718[/C][C]1.5138[/C][C]0.067194[/C][/ROW]
[ROW][C]20[/C][C]0.105274[/C][C]0.8995[/C][C]0.185681[/C][/ROW]
[ROW][C]21[/C][C]0.042924[/C][C]0.3667[/C][C]0.357437[/C][/ROW]
[ROW][C]22[/C][C]-0.002897[/C][C]-0.0247[/C][C]0.490162[/C][/ROW]
[ROW][C]23[/C][C]-0.037359[/C][C]-0.3192[/C][C]0.375245[/C][/ROW]
[ROW][C]24[/C][C]-0.080501[/C][C]-0.6878[/C][C]0.246879[/C][/ROW]
[ROW][C]25[/C][C]-0.14203[/C][C]-1.2135[/C][C]0.114425[/C][/ROW]
[ROW][C]26[/C][C]-0.200841[/C][C]-1.716[/C][C]0.045203[/C][/ROW]
[ROW][C]27[/C][C]-0.244602[/C][C]-2.0899[/C][C]0.020056[/C][/ROW]
[ROW][C]28[/C][C]-0.273502[/C][C]-2.3368[/C][C]0.011098[/C][/ROW]
[ROW][C]29[/C][C]-0.294753[/C][C]-2.5184[/C][C]0.006991[/C][/ROW]
[ROW][C]30[/C][C]-0.318877[/C][C]-2.7245[/C][C]0.004027[/C][/ROW]
[ROW][C]31[/C][C]-0.354966[/C][C]-3.0328[/C][C]0.001677[/C][/ROW]
[ROW][C]32[/C][C]-0.395942[/C][C]-3.3829[/C][C]0.000578[/C][/ROW]
[ROW][C]33[/C][C]-0.422652[/C][C]-3.6111[/C][C]0.000278[/C][/ROW]
[ROW][C]34[/C][C]-0.433[/C][C]-3.6996[/C][C]0.000208[/C][/ROW]
[ROW][C]35[/C][C]-0.437287[/C][C]-3.7362[/C][C]0.000184[/C][/ROW]
[ROW][C]36[/C][C]-0.443722[/C][C]-3.7912[/C][C]0.000153[/C][/ROW]
[ROW][C]37[/C][C]-0.461495[/C][C]-3.943[/C][C]9.1e-05[/C][/ROW]
[ROW][C]38[/C][C]-0.477586[/C][C]-4.0805[/C][C]5.7e-05[/C][/ROW]
[ROW][C]39[/C][C]-0.479981[/C][C]-4.101[/C][C]5.3e-05[/C][/ROW]
[ROW][C]40[/C][C]-0.471294[/C][C]-4.0267[/C][C]6.8e-05[/C][/ROW]
[ROW][C]41[/C][C]-0.454475[/C][C]-3.883[/C][C]0.000112[/C][/ROW]
[ROW][C]42[/C][C]-0.437497[/C][C]-3.738[/C][C]0.000183[/C][/ROW]
[ROW][C]43[/C][C]-0.433174[/C][C]-3.701[/C][C]0.000207[/C][/ROW]
[ROW][C]44[/C][C]-0.43209[/C][C]-3.6918[/C][C]0.000213[/C][/ROW]
[ROW][C]45[/C][C]-0.418948[/C][C]-3.5795[/C][C]0.000308[/C][/ROW]
[ROW][C]46[/C][C]-0.400655[/C][C]-3.4232[/C][C]0.000509[/C][/ROW]
[ROW][C]47[/C][C]-0.378608[/C][C]-3.2348[/C][C]0.000915[/C][/ROW]
[ROW][C]48[/C][C]-0.359209[/C][C]-3.0691[/C][C]0.001507[/C][/ROW]
[ROW][C]49[/C][C]-0.347158[/C][C]-2.9661[/C][C]0.002037[/C][/ROW]
[ROW][C]50[/C][C]-0.333834[/C][C]-2.8523[/C][C]0.002821[/C][/ROW]
[ROW][C]51[/C][C]-0.312083[/C][C]-2.6664[/C][C]0.004717[/C][/ROW]
[ROW][C]52[/C][C]-0.284201[/C][C]-2.4282[/C][C]0.008819[/C][/ROW]
[ROW][C]53[/C][C]-0.251311[/C][C]-2.1472[/C][C]0.017549[/C][/ROW]
[ROW][C]54[/C][C]-0.225486[/C][C]-1.9266[/C][C]0.028964[/C][/ROW]
[ROW][C]55[/C][C]-0.21033[/C][C]-1.7971[/C][C]0.038231[/C][/ROW]
[ROW][C]56[/C][C]-0.196782[/C][C]-1.6813[/C][C]0.048488[/C][/ROW]
[ROW][C]57[/C][C]-0.176219[/C][C]-1.5056[/C][C]0.068241[/C][/ROW]
[ROW][C]58[/C][C]-0.154241[/C][C]-1.3178[/C][C]0.095839[/C][/ROW]
[ROW][C]59[/C][C]-0.132071[/C][C]-1.1284[/C][C]0.13142[/C][/ROW]
[ROW][C]60[/C][C]-0.112988[/C][C]-0.9654[/C][C]0.168774[/C][/ROW]
[/TABLE]
Source: https://freestatistics.org/blog/index.php?pk=107416&T=1

Globally Unique Identifier (entire table): ba.freestatistics.org/blog/index.php?pk=107416&T=1

As an alternative you can also use a QR Code:  

The GUIDs for individual cells are displayed in the table below:

Autocorrelation Function
Time lag kACF(k)T-STATP-value
10.9688078.27750
20.9273357.92320
30.8972797.66640
40.881057.52770
50.87027.4350
60.8472597.2390
70.8037386.86710
80.7490036.39950
90.698425.96730
100.6567985.61170
110.6297335.38040
120.5894655.03642e-06
130.5167754.41531.7e-05
140.4405883.76440.000168
150.3769693.22080.000955
160.3288452.80960.003181
170.2883592.46370.008053
180.2412932.06160.021403
190.177181.51380.067194
200.1052740.89950.185681
210.0429240.36670.357437
22-0.002897-0.02470.490162
23-0.037359-0.31920.375245
24-0.080501-0.68780.246879
25-0.14203-1.21350.114425
26-0.200841-1.7160.045203
27-0.244602-2.08990.020056
28-0.273502-2.33680.011098
29-0.294753-2.51840.006991
30-0.318877-2.72450.004027
31-0.354966-3.03280.001677
32-0.395942-3.38290.000578
33-0.422652-3.61110.000278
34-0.433-3.69960.000208
35-0.437287-3.73620.000184
36-0.443722-3.79120.000153
37-0.461495-3.9439.1e-05
38-0.477586-4.08055.7e-05
39-0.479981-4.1015.3e-05
40-0.471294-4.02676.8e-05
41-0.454475-3.8830.000112
42-0.437497-3.7380.000183
43-0.433174-3.7010.000207
44-0.43209-3.69180.000213
45-0.418948-3.57950.000308
46-0.400655-3.42320.000509
47-0.378608-3.23480.000915
48-0.359209-3.06910.001507
49-0.347158-2.96610.002037
50-0.333834-2.85230.002821
51-0.312083-2.66640.004717
52-0.284201-2.42820.008819
53-0.251311-2.14720.017549
54-0.225486-1.92660.028964
55-0.21033-1.79710.038231
56-0.196782-1.68130.048488
57-0.176219-1.50560.068241
58-0.154241-1.31780.095839
59-0.132071-1.12840.13142
60-0.112988-0.96540.168774


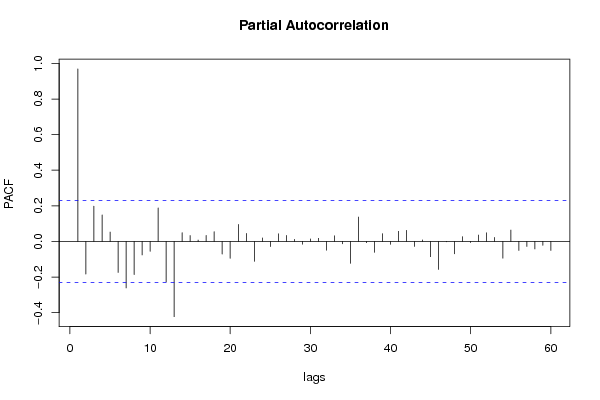
Partial Autocorrelation Function
Time lag kPACF(k)T-STATP-value
10.9688078.27750
2-0.183201-1.56530.060922
30.1982671.6940.047264
40.1486841.27040.103995
50.0525310.44880.327443
6-0.174186-1.48820.070496
7-0.260876-2.22890.014449
8-0.185858-1.5880.058308
9-0.075975-0.64910.259145
10-0.055518-0.47430.318334
110.1884571.61020.055838
12-0.227769-1.94610.027748
13-0.422388-3.60890.00028
140.0490270.41890.338264
150.0333580.2850.388222
160.0077780.06650.473598
170.0337580.28840.386917
180.0547710.4680.320601
19-0.070608-0.60330.274098
20-0.094514-0.80750.210994
210.0956290.81710.208277
220.0451270.38560.350471
23-0.111654-0.9540.171624
240.0197120.16840.433358
25-0.028657-0.24480.403633
260.0431670.36880.356666
270.0340150.29060.386081
280.0116340.09940.460547
29-0.01555-0.13290.447334
300.0138130.1180.453188
310.0176190.15050.440377
32-0.048819-0.41710.33891
330.0313560.26790.394763
34-0.013251-0.11320.455084
35-0.123084-1.05160.148219
360.1369031.16970.122964
37-0.007224-0.06170.475478
38-0.06084-0.51980.302381
390.0435510.37210.35545
40-0.01599-0.13660.445855
410.0572330.4890.313155
420.06220.53140.298366
43-0.027836-0.23780.40634
440.0086680.07410.470582
45-0.08574-0.73260.233086
46-0.157026-1.34160.091937
47-0.001964-0.01680.49333
48-0.06964-0.5950.276839
490.0269840.23060.409154
50-0.006227-0.05320.478859
510.0356640.30470.380727
520.0484360.41380.340102
530.0222670.19020.424822
54-0.093948-0.80270.21238
550.0640050.54690.293072
56-0.050215-0.4290.334581
57-0.028197-0.24090.405147
58-0.042269-0.36110.359516
59-0.021964-0.18770.425832
60-0.050568-0.43210.333489

\begin{tabular}{lllllllll}
\hline
Partial Autocorrelation Function \tabularnewline
Time lag k & PACF(k) & T-STAT & P-value \tabularnewline
1 & 0.968807 & 8.2775 & 0 \tabularnewline
2 & -0.183201 & -1.5653 & 0.060922 \tabularnewline
3 & 0.198267 & 1.694 & 0.047264 \tabularnewline
4 & 0.148684 & 1.2704 & 0.103995 \tabularnewline
5 & 0.052531 & 0.4488 & 0.327443 \tabularnewline
6 & -0.174186 & -1.4882 & 0.070496 \tabularnewline
7 & -0.260876 & -2.2289 & 0.014449 \tabularnewline
8 & -0.185858 & -1.588 & 0.058308 \tabularnewline
9 & -0.075975 & -0.6491 & 0.259145 \tabularnewline
10 & -0.055518 & -0.4743 & 0.318334 \tabularnewline
11 & 0.188457 & 1.6102 & 0.055838 \tabularnewline
12 & -0.227769 & -1.9461 & 0.027748 \tabularnewline
13 & -0.422388 & -3.6089 & 0.00028 \tabularnewline
14 & 0.049027 & 0.4189 & 0.338264 \tabularnewline
15 & 0.033358 & 0.285 & 0.388222 \tabularnewline
16 & 0.007778 & 0.0665 & 0.473598 \tabularnewline
17 & 0.033758 & 0.2884 & 0.386917 \tabularnewline
18 & 0.054771 & 0.468 & 0.320601 \tabularnewline
19 & -0.070608 & -0.6033 & 0.274098 \tabularnewline
20 & -0.094514 & -0.8075 & 0.210994 \tabularnewline
21 & 0.095629 & 0.8171 & 0.208277 \tabularnewline
22 & 0.045127 & 0.3856 & 0.350471 \tabularnewline
23 & -0.111654 & -0.954 & 0.171624 \tabularnewline
24 & 0.019712 & 0.1684 & 0.433358 \tabularnewline
25 & -0.028657 & -0.2448 & 0.403633 \tabularnewline
26 & 0.043167 & 0.3688 & 0.356666 \tabularnewline
27 & 0.034015 & 0.2906 & 0.386081 \tabularnewline
28 & 0.011634 & 0.0994 & 0.460547 \tabularnewline
29 & -0.01555 & -0.1329 & 0.447334 \tabularnewline
30 & 0.013813 & 0.118 & 0.453188 \tabularnewline
31 & 0.017619 & 0.1505 & 0.440377 \tabularnewline
32 & -0.048819 & -0.4171 & 0.33891 \tabularnewline
33 & 0.031356 & 0.2679 & 0.394763 \tabularnewline
34 & -0.013251 & -0.1132 & 0.455084 \tabularnewline
35 & -0.123084 & -1.0516 & 0.148219 \tabularnewline
36 & 0.136903 & 1.1697 & 0.122964 \tabularnewline
37 & -0.007224 & -0.0617 & 0.475478 \tabularnewline
38 & -0.06084 & -0.5198 & 0.302381 \tabularnewline
39 & 0.043551 & 0.3721 & 0.35545 \tabularnewline
40 & -0.01599 & -0.1366 & 0.445855 \tabularnewline
41 & 0.057233 & 0.489 & 0.313155 \tabularnewline
42 & 0.0622 & 0.5314 & 0.298366 \tabularnewline
43 & -0.027836 & -0.2378 & 0.40634 \tabularnewline
44 & 0.008668 & 0.0741 & 0.470582 \tabularnewline
45 & -0.08574 & -0.7326 & 0.233086 \tabularnewline
46 & -0.157026 & -1.3416 & 0.091937 \tabularnewline
47 & -0.001964 & -0.0168 & 0.49333 \tabularnewline
48 & -0.06964 & -0.595 & 0.276839 \tabularnewline
49 & 0.026984 & 0.2306 & 0.409154 \tabularnewline
50 & -0.006227 & -0.0532 & 0.478859 \tabularnewline
51 & 0.035664 & 0.3047 & 0.380727 \tabularnewline
52 & 0.048436 & 0.4138 & 0.340102 \tabularnewline
53 & 0.022267 & 0.1902 & 0.424822 \tabularnewline
54 & -0.093948 & -0.8027 & 0.21238 \tabularnewline
55 & 0.064005 & 0.5469 & 0.293072 \tabularnewline
56 & -0.050215 & -0.429 & 0.334581 \tabularnewline
57 & -0.028197 & -0.2409 & 0.405147 \tabularnewline
58 & -0.042269 & -0.3611 & 0.359516 \tabularnewline
59 & -0.021964 & -0.1877 & 0.425832 \tabularnewline
60 & -0.050568 & -0.4321 & 0.333489 \tabularnewline
\hline
\end{tabular}
%Source: https://freestatistics.org/blog/index.php?pk=107416&T=2

[TABLE]
[ROW][C]Partial Autocorrelation Function[/C][/ROW]
[ROW][C]Time lag k[/C][C]PACF(k)[/C][C]T-STAT[/C][C]P-value[/C][/ROW]
[ROW][C]1[/C][C]0.968807[/C][C]8.2775[/C][C]0[/C][/ROW]
[ROW][C]2[/C][C]-0.183201[/C][C]-1.5653[/C][C]0.060922[/C][/ROW]
[ROW][C]3[/C][C]0.198267[/C][C]1.694[/C][C]0.047264[/C][/ROW]
[ROW][C]4[/C][C]0.148684[/C][C]1.2704[/C][C]0.103995[/C][/ROW]
[ROW][C]5[/C][C]0.052531[/C][C]0.4488[/C][C]0.327443[/C][/ROW]
[ROW][C]6[/C][C]-0.174186[/C][C]-1.4882[/C][C]0.070496[/C][/ROW]
[ROW][C]7[/C][C]-0.260876[/C][C]-2.2289[/C][C]0.014449[/C][/ROW]
[ROW][C]8[/C][C]-0.185858[/C][C]-1.588[/C][C]0.058308[/C][/ROW]
[ROW][C]9[/C][C]-0.075975[/C][C]-0.6491[/C][C]0.259145[/C][/ROW]
[ROW][C]10[/C][C]-0.055518[/C][C]-0.4743[/C][C]0.318334[/C][/ROW]
[ROW][C]11[/C][C]0.188457[/C][C]1.6102[/C][C]0.055838[/C][/ROW]
[ROW][C]12[/C][C]-0.227769[/C][C]-1.9461[/C][C]0.027748[/C][/ROW]
[ROW][C]13[/C][C]-0.422388[/C][C]-3.6089[/C][C]0.00028[/C][/ROW]
[ROW][C]14[/C][C]0.049027[/C][C]0.4189[/C][C]0.338264[/C][/ROW]
[ROW][C]15[/C][C]0.033358[/C][C]0.285[/C][C]0.388222[/C][/ROW]
[ROW][C]16[/C][C]0.007778[/C][C]0.0665[/C][C]0.473598[/C][/ROW]
[ROW][C]17[/C][C]0.033758[/C][C]0.2884[/C][C]0.386917[/C][/ROW]
[ROW][C]18[/C][C]0.054771[/C][C]0.468[/C][C]0.320601[/C][/ROW]
[ROW][C]19[/C][C]-0.070608[/C][C]-0.6033[/C][C]0.274098[/C][/ROW]
[ROW][C]20[/C][C]-0.094514[/C][C]-0.8075[/C][C]0.210994[/C][/ROW]
[ROW][C]21[/C][C]0.095629[/C][C]0.8171[/C][C]0.208277[/C][/ROW]
[ROW][C]22[/C][C]0.045127[/C][C]0.3856[/C][C]0.350471[/C][/ROW]
[ROW][C]23[/C][C]-0.111654[/C][C]-0.954[/C][C]0.171624[/C][/ROW]
[ROW][C]24[/C][C]0.019712[/C][C]0.1684[/C][C]0.433358[/C][/ROW]
[ROW][C]25[/C][C]-0.028657[/C][C]-0.2448[/C][C]0.403633[/C][/ROW]
[ROW][C]26[/C][C]0.043167[/C][C]0.3688[/C][C]0.356666[/C][/ROW]
[ROW][C]27[/C][C]0.034015[/C][C]0.2906[/C][C]0.386081[/C][/ROW]
[ROW][C]28[/C][C]0.011634[/C][C]0.0994[/C][C]0.460547[/C][/ROW]
[ROW][C]29[/C][C]-0.01555[/C][C]-0.1329[/C][C]0.447334[/C][/ROW]
[ROW][C]30[/C][C]0.013813[/C][C]0.118[/C][C]0.453188[/C][/ROW]
[ROW][C]31[/C][C]0.017619[/C][C]0.1505[/C][C]0.440377[/C][/ROW]
[ROW][C]32[/C][C]-0.048819[/C][C]-0.4171[/C][C]0.33891[/C][/ROW]
[ROW][C]33[/C][C]0.031356[/C][C]0.2679[/C][C]0.394763[/C][/ROW]
[ROW][C]34[/C][C]-0.013251[/C][C]-0.1132[/C][C]0.455084[/C][/ROW]
[ROW][C]35[/C][C]-0.123084[/C][C]-1.0516[/C][C]0.148219[/C][/ROW]
[ROW][C]36[/C][C]0.136903[/C][C]1.1697[/C][C]0.122964[/C][/ROW]
[ROW][C]37[/C][C]-0.007224[/C][C]-0.0617[/C][C]0.475478[/C][/ROW]
[ROW][C]38[/C][C]-0.06084[/C][C]-0.5198[/C][C]0.302381[/C][/ROW]
[ROW][C]39[/C][C]0.043551[/C][C]0.3721[/C][C]0.35545[/C][/ROW]
[ROW][C]40[/C][C]-0.01599[/C][C]-0.1366[/C][C]0.445855[/C][/ROW]
[ROW][C]41[/C][C]0.057233[/C][C]0.489[/C][C]0.313155[/C][/ROW]
[ROW][C]42[/C][C]0.0622[/C][C]0.5314[/C][C]0.298366[/C][/ROW]
[ROW][C]43[/C][C]-0.027836[/C][C]-0.2378[/C][C]0.40634[/C][/ROW]
[ROW][C]44[/C][C]0.008668[/C][C]0.0741[/C][C]0.470582[/C][/ROW]
[ROW][C]45[/C][C]-0.08574[/C][C]-0.7326[/C][C]0.233086[/C][/ROW]
[ROW][C]46[/C][C]-0.157026[/C][C]-1.3416[/C][C]0.091937[/C][/ROW]
[ROW][C]47[/C][C]-0.001964[/C][C]-0.0168[/C][C]0.49333[/C][/ROW]
[ROW][C]48[/C][C]-0.06964[/C][C]-0.595[/C][C]0.276839[/C][/ROW]
[ROW][C]49[/C][C]0.026984[/C][C]0.2306[/C][C]0.409154[/C][/ROW]
[ROW][C]50[/C][C]-0.006227[/C][C]-0.0532[/C][C]0.478859[/C][/ROW]
[ROW][C]51[/C][C]0.035664[/C][C]0.3047[/C][C]0.380727[/C][/ROW]
[ROW][C]52[/C][C]0.048436[/C][C]0.4138[/C][C]0.340102[/C][/ROW]
[ROW][C]53[/C][C]0.022267[/C][C]0.1902[/C][C]0.424822[/C][/ROW]
[ROW][C]54[/C][C]-0.093948[/C][C]-0.8027[/C][C]0.21238[/C][/ROW]
[ROW][C]55[/C][C]0.064005[/C][C]0.5469[/C][C]0.293072[/C][/ROW]
[ROW][C]56[/C][C]-0.050215[/C][C]-0.429[/C][C]0.334581[/C][/ROW]
[ROW][C]57[/C][C]-0.028197[/C][C]-0.2409[/C][C]0.405147[/C][/ROW]
[ROW][C]58[/C][C]-0.042269[/C][C]-0.3611[/C][C]0.359516[/C][/ROW]
[ROW][C]59[/C][C]-0.021964[/C][C]-0.1877[/C][C]0.425832[/C][/ROW]
[ROW][C]60[/C][C]-0.050568[/C][C]-0.4321[/C][C]0.333489[/C][/ROW]
[/TABLE]
Source: https://freestatistics.org/blog/index.php?pk=107416&T=2

Globally Unique Identifier (entire table): ba.freestatistics.org/blog/index.php?pk=107416&T=2

As an alternative you can also use a QR Code:  

The GUIDs for individual cells are displayed in the table below:

Partial Autocorrelation Function
Time lag kPACF(k)T-STATP-value
10.9688078.27750
2-0.183201-1.56530.060922
30.1982671.6940.047264
40.1486841.27040.103995
50.0525310.44880.327443
6-0.174186-1.48820.070496
7-0.260876-2.22890.014449
8-0.185858-1.5880.058308
9-0.075975-0.64910.259145
10-0.055518-0.47430.318334
110.1884571.61020.055838
12-0.227769-1.94610.027748
13-0.422388-3.60890.00028
140.0490270.41890.338264
150.0333580.2850.388222
160.0077780.06650.473598
170.0337580.28840.386917
180.0547710.4680.320601
19-0.070608-0.60330.274098
20-0.094514-0.80750.210994
210.0956290.81710.208277
220.0451270.38560.350471
23-0.111654-0.9540.171624
240.0197120.16840.433358
25-0.028657-0.24480.403633
260.0431670.36880.356666
270.0340150.29060.386081
280.0116340.09940.460547
29-0.01555-0.13290.447334
300.0138130.1180.453188
310.0176190.15050.440377
32-0.048819-0.41710.33891
330.0313560.26790.394763
34-0.013251-0.11320.455084
35-0.123084-1.05160.148219
360.1369031.16970.122964
37-0.007224-0.06170.475478
38-0.06084-0.51980.302381
390.0435510.37210.35545
40-0.01599-0.13660.445855
410.0572330.4890.313155
420.06220.53140.298366
43-0.027836-0.23780.40634
440.0086680.07410.470582
45-0.08574-0.73260.233086
46-0.157026-1.34160.091937
47-0.001964-0.01680.49333
48-0.06964-0.5950.276839
490.0269840.23060.409154
50-0.006227-0.05320.478859
510.0356640.30470.380727
520.0484360.41380.340102
530.0222670.19020.424822
54-0.093948-0.80270.21238
550.0640050.54690.293072
56-0.050215-0.4290.334581
57-0.028197-0.24090.405147
58-0.042269-0.36110.359516
59-0.021964-0.18770.425832
60-0.050568-0.43210.333489


Parameters (Session):
par1 = 60 ; par2 = 1 ; par3 = 0 ; par4 = 0 ; par5 = 12 ; par6 = White Noise ; par7 = 0.95 ;
Parameters (R input):
par1 = 60 ; par2 = 1 ; par3 = 0 ; par4 = 0 ; par5 = 12 ; par6 = White Noise ; par7 = 0.95 ;
R code (references can be found in the software module):
if (par1 == 'Default') {
par1 = 10*log10(length(x))
} else {
par1 <- as.numeric(par1)
}
par2 <- as.numeric(par2)
par3 <- as.numeric(par3)
par4 <- as.numeric(par4)
par5 <- as.numeric(par5)
if (par6 == 'White Noise') par6 <- 'white' else par6 <- 'ma'
par7 <- as.numeric(par7)
if (par2 == 0) {
x <- log(x)
} else {
x <- (x ^ par2 - 1) / par2
}
if (par3 > 0) x <- diff(x,lag=1,difference=par3)
if (par4 > 0) x <- diff(x,lag=par5,difference=par4)
bitmap(file='pic1.png')
racf <- acf(x, par1, main='Autocorrelation', xlab='time lag', ylab='ACF', ci.type=par6, ci=par7, sub=paste('(lambda=',par2,', d=',par3,', D=',par4,', CI=', par7, ', CI type=',par6,')',sep=''))
dev.off()
bitmap(file='pic2.png')
rpacf <- pacf(x,par1,main='Partial Autocorrelation',xlab='lags',ylab='PACF')
dev.off()
(myacf <- c(racf$acf))
(mypacf <- c(rpacf$acf))
lengthx <- length(x)
sqrtn <- sqrt(lengthx)
load(file='createtable')
a<-table.start()
a<-table.row.start(a)
a<-table.element(a,'Autocorrelation Function',4,TRUE)
a<-table.row.end(a)
a<-table.row.start(a)
a<-table.element(a,'Time lag k',header=TRUE)
a<-table.element(a,hyperlink('basics.htm','ACF(k)','click here for more information about the Autocorrelation Function'),header=TRUE)
a<-table.element(a,'T-STAT',header=TRUE)
a<-table.element(a,'P-value',header=TRUE)
a<-table.row.end(a)
for (i in 2:(par1+1)) {
a<-table.row.start(a)
a<-table.element(a,i-1,header=TRUE)
a<-table.element(a,round(myacf[i],6))
mytstat <- myacf[i]*sqrtn
a<-table.element(a,round(mytstat,4))
a<-table.element(a,round(1-pt(abs(mytstat),lengthx),6))
a<-table.row.end(a)
}
a<-table.end(a)
table.save(a,file='mytable.tab')
a<-table.start()
a<-table.row.start(a)
a<-table.element(a,'Partial Autocorrelation Function',4,TRUE)
a<-table.row.end(a)
a<-table.row.start(a)
a<-table.element(a,'Time lag k',header=TRUE)
a<-table.element(a,hyperlink('basics.htm','PACF(k)','click here for more information about the Partial Autocorrelation Function'),header=TRUE)
a<-table.element(a,'T-STAT',header=TRUE)
a<-table.element(a,'P-value',header=TRUE)
a<-table.row.end(a)
for (i in 1:par1) {
a<-table.row.start(a)
a<-table.element(a,i,header=TRUE)
a<-table.element(a,round(mypacf[i],6))
mytstat <- mypacf[i]*sqrtn
a<-table.element(a,round(mytstat,4))
a<-table.element(a,round(1-pt(abs(mytstat),lengthx),6))
a<-table.row.end(a)
}
a<-table.end(a)
table.save(a,file='mytable1.tab')