Free Statistics

of Irreproducible Research!

Author's title

Author*The author of this computation has been verified*
R Software Modulerwasp_exponentialsmoothing.wasp
Title produced by softwareExponential Smoothing
Date of computationThu, 09 Dec 2010 19:54:22 +0000
Cite this page as followsStatistical Computations at FreeStatistics.org, Office for Research Development and Education, URL https://freestatistics.org/blog/index.php?v=date/2010/Dec/09/t12919243297jcrsluy480uppw.htm/, Retrieved Sun, 28 Apr 2024 23:23:37 +0000
Statistical Computations at FreeStatistics.org, Office for Research Development and Education, URL https://freestatistics.org/blog/index.php?pk=107376, Retrieved Sun, 28 Apr 2024 23:23:37 +0000
QR Codes:

Original text written by user:
IsPrivate?No (this computation is public)
User-defined keywords
Estimated Impact232
Family? (F = Feedback message, R = changed R code, M = changed R Module, P = changed Parameters, D = changed Data)
-     [Exponential Smoothing] [HPC Retail Sales] [2008-03-10 17:56:43] [74be16979710d4c4e7c6647856088456]
-  M D    [Exponential Smoothing] [] [2010-12-09 19:54:22] [6ca9362bade14820cda7467b7288bbb3] [Current]
-    D      [Exponential Smoothing] [] [2010-12-27 06:47:49] [bfba28641a1925a39268a5d6ad3b00f2]
- RM          [Exponential Smoothing] [] [2012-08-21 21:50:05] [897115520fe7b6114489bc0eeed64548]
Feedback Forum

Post a new message
Dataseries X:
286602
283042
276687
277915
277128
277103
275037
270150
267140
264993
287259
291186
292300
288186
281477
282656
280190
280408
276836
275216
274352
271311
289802
290726
292300
278506
269826
265861
269034
264176
255198
253353
246057
235372
258556
260993
254663
250643
243422
247105
248541
245039
237080
237085
225554
226839
247934
248333
246969
245098
246263
255765
264319
268347
273046
273963
267430
271993
292710
295881
294563


Summary of computational transaction
Raw Inputview raw input (R code)
Raw Outputview raw output of R engine
Computing time2 seconds
R Server'RServer@AstonUniversity' @ vre.aston.ac.uk

\begin{tabular}{lllllllll}
\hline
Summary of computational transaction \tabularnewline
Raw Input & view raw input (R code)  \tabularnewline
Raw Output & view raw output of R engine  \tabularnewline
Computing time & 2 seconds \tabularnewline
R Server & 'RServer@AstonUniversity' @ vre.aston.ac.uk \tabularnewline
\hline
\end{tabular}
%Source: https://freestatistics.org/blog/index.php?pk=107376&T=0

[TABLE]
[ROW][C]Summary of computational transaction[/C][/ROW]
[ROW][C]Raw Input[/C][C]view raw input (R code) [/C][/ROW]
[ROW][C]Raw Output[/C][C]view raw output of R engine [/C][/ROW]
[ROW][C]Computing time[/C][C]2 seconds[/C][/ROW]
[ROW][C]R Server[/C][C]'RServer@AstonUniversity' @ vre.aston.ac.uk[/C][/ROW]
[/TABLE]
Source: https://freestatistics.org/blog/index.php?pk=107376&T=0

Globally Unique Identifier (entire table): ba.freestatistics.org/blog/index.php?pk=107376&T=0

As an alternative you can also use a QR Code:  

The GUIDs for individual cells are displayed in the table below:

Summary of computational transaction
Raw Inputview raw input (R code)
Raw Outputview raw output of R engine
Computing time2 seconds
R Server'RServer@AstonUniversity' @ vre.aston.ac.uk


Estimated Parameters of Exponential Smoothing
ParameterValue
alpha0.819010626931158
beta0.422758665301198
gamma1

\begin{tabular}{lllllllll}
\hline
Estimated Parameters of Exponential Smoothing \tabularnewline
Parameter & Value \tabularnewline
alpha & 0.819010626931158 \tabularnewline
beta & 0.422758665301198 \tabularnewline
gamma & 1 \tabularnewline
\hline
\end{tabular}
%Source: https://freestatistics.org/blog/index.php?pk=107376&T=1

[TABLE]
[ROW][C]Estimated Parameters of Exponential Smoothing[/C][/ROW]
[ROW][C]Parameter[/C][C]Value[/C][/ROW]
[ROW][C]alpha[/C][C]0.819010626931158[/C][/ROW]
[ROW][C]beta[/C][C]0.422758665301198[/C][/ROW]
[ROW][C]gamma[/C][C]1[/C][/ROW]
[/TABLE]
Source: https://freestatistics.org/blog/index.php?pk=107376&T=1

Globally Unique Identifier (entire table): ba.freestatistics.org/blog/index.php?pk=107376&T=1

As an alternative you can also use a QR Code:  

The GUIDs for individual cells are displayed in the table below:

Estimated Parameters of Exponential Smoothing
ParameterValue
alpha0.819010626931158
beta0.422758665301198
gamma1


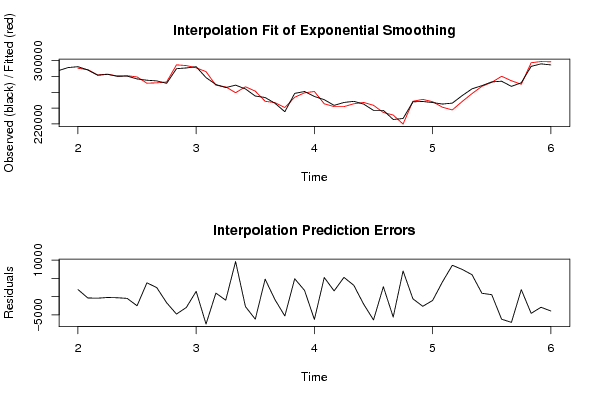
Interpolation Forecasts of Exponential Smoothing
tObservedFittedResiduals
13292300290364.2142094021935.78579059819
14288186288573.902492723-387.902492722787
15281477281925.614863226-448.614863226423
16282656282908.10635773-252.106357730459
17280190280513.791799919-323.791799919447
18280408280915.071853821-507.071853820526
19276836279371.714756965-2535.714756965
20275216271437.9019508353778.09804916533
21274352271898.1454372972453.85456270335
22271311273003.243127755-1692.24312775541
23289802294611.713991497-4809.71399149712
24290726293722.442582664-2996.44258266373
25292300290870.7415991221429.25840087823
26278506286066.314126849-7560.31412684912
27269826268870.65195669955.348043310281
28265861266862.57855225-1001.57855225034
29269034259405.9724786369628.02752136407
30264176266934.991183153-2758.99118315341
31255198261410.676833747-6212.67683374725
32253353248565.5519825574787.44801744341
33246057246919.696978542-862.696978542139
34235372240716.675708324-5344.67570832407
35258556253663.4757150444892.52428495564
36260993259301.9029856051691.09701439535
37254663260966.662871024-6303.66287102413
38250643245400.7085304965242.29146950436
39243422241863.4189976051558.58100239461
40247105241835.7408193755269.25918062523
41248541245450.6261014233090.37389857738
42245039247131.458845871-2092.45884587118
43237080243506.884460543-6426.88446054308
44237085234381.9822133072703.01778669254
45225554231189.374598531-5635.37459853094
46226839219796.8129942227042.18700577784
47247934248560.808388502-626.808388501522
48248333251007.783076531-2674.78307653122
49246969248046.578951782-1077.57895178214
50245098241056.742037424041.25796257981
51246263237659.4345197328603.5654802678
52255765248302.9029561667462.09704383434
53264319258308.2834148936010.71658510726
54268347267442.913613978904.086386021867
55273046272525.635378617520.364621383254
56273963280186.040173054-6223.04017305386
57267430274526.164174507-7096.16417450667
58271993270078.3432711371914.65672886278
59292710297326.093400524-4616.09340052435
60295881298825.137445836-2944.13744583557
61294563298529.141743234-3966.14174323354

\begin{tabular}{lllllllll}
\hline
Interpolation Forecasts of Exponential Smoothing \tabularnewline
t & Observed & Fitted & Residuals \tabularnewline
13 & 292300 & 290364.214209402 & 1935.78579059819 \tabularnewline
14 & 288186 & 288573.902492723 & -387.902492722787 \tabularnewline
15 & 281477 & 281925.614863226 & -448.614863226423 \tabularnewline
16 & 282656 & 282908.10635773 & -252.106357730459 \tabularnewline
17 & 280190 & 280513.791799919 & -323.791799919447 \tabularnewline
18 & 280408 & 280915.071853821 & -507.071853820526 \tabularnewline
19 & 276836 & 279371.714756965 & -2535.714756965 \tabularnewline
20 & 275216 & 271437.901950835 & 3778.09804916533 \tabularnewline
21 & 274352 & 271898.145437297 & 2453.85456270335 \tabularnewline
22 & 271311 & 273003.243127755 & -1692.24312775541 \tabularnewline
23 & 289802 & 294611.713991497 & -4809.71399149712 \tabularnewline
24 & 290726 & 293722.442582664 & -2996.44258266373 \tabularnewline
25 & 292300 & 290870.741599122 & 1429.25840087823 \tabularnewline
26 & 278506 & 286066.314126849 & -7560.31412684912 \tabularnewline
27 & 269826 & 268870.65195669 & 955.348043310281 \tabularnewline
28 & 265861 & 266862.57855225 & -1001.57855225034 \tabularnewline
29 & 269034 & 259405.972478636 & 9628.02752136407 \tabularnewline
30 & 264176 & 266934.991183153 & -2758.99118315341 \tabularnewline
31 & 255198 & 261410.676833747 & -6212.67683374725 \tabularnewline
32 & 253353 & 248565.551982557 & 4787.44801744341 \tabularnewline
33 & 246057 & 246919.696978542 & -862.696978542139 \tabularnewline
34 & 235372 & 240716.675708324 & -5344.67570832407 \tabularnewline
35 & 258556 & 253663.475715044 & 4892.52428495564 \tabularnewline
36 & 260993 & 259301.902985605 & 1691.09701439535 \tabularnewline
37 & 254663 & 260966.662871024 & -6303.66287102413 \tabularnewline
38 & 250643 & 245400.708530496 & 5242.29146950436 \tabularnewline
39 & 243422 & 241863.418997605 & 1558.58100239461 \tabularnewline
40 & 247105 & 241835.740819375 & 5269.25918062523 \tabularnewline
41 & 248541 & 245450.626101423 & 3090.37389857738 \tabularnewline
42 & 245039 & 247131.458845871 & -2092.45884587118 \tabularnewline
43 & 237080 & 243506.884460543 & -6426.88446054308 \tabularnewline
44 & 237085 & 234381.982213307 & 2703.01778669254 \tabularnewline
45 & 225554 & 231189.374598531 & -5635.37459853094 \tabularnewline
46 & 226839 & 219796.812994222 & 7042.18700577784 \tabularnewline
47 & 247934 & 248560.808388502 & -626.808388501522 \tabularnewline
48 & 248333 & 251007.783076531 & -2674.78307653122 \tabularnewline
49 & 246969 & 248046.578951782 & -1077.57895178214 \tabularnewline
50 & 245098 & 241056.74203742 & 4041.25796257981 \tabularnewline
51 & 246263 & 237659.434519732 & 8603.5654802678 \tabularnewline
52 & 255765 & 248302.902956166 & 7462.09704383434 \tabularnewline
53 & 264319 & 258308.283414893 & 6010.71658510726 \tabularnewline
54 & 268347 & 267442.913613978 & 904.086386021867 \tabularnewline
55 & 273046 & 272525.635378617 & 520.364621383254 \tabularnewline
56 & 273963 & 280186.040173054 & -6223.04017305386 \tabularnewline
57 & 267430 & 274526.164174507 & -7096.16417450667 \tabularnewline
58 & 271993 & 270078.343271137 & 1914.65672886278 \tabularnewline
59 & 292710 & 297326.093400524 & -4616.09340052435 \tabularnewline
60 & 295881 & 298825.137445836 & -2944.13744583557 \tabularnewline
61 & 294563 & 298529.141743234 & -3966.14174323354 \tabularnewline
\hline
\end{tabular}
%Source: https://freestatistics.org/blog/index.php?pk=107376&T=2

[TABLE]
[ROW][C]Interpolation Forecasts of Exponential Smoothing[/C][/ROW]
[ROW][C]t[/C][C]Observed[/C][C]Fitted[/C][C]Residuals[/C][/ROW]
[ROW][C]13[/C][C]292300[/C][C]290364.214209402[/C][C]1935.78579059819[/C][/ROW]
[ROW][C]14[/C][C]288186[/C][C]288573.902492723[/C][C]-387.902492722787[/C][/ROW]
[ROW][C]15[/C][C]281477[/C][C]281925.614863226[/C][C]-448.614863226423[/C][/ROW]
[ROW][C]16[/C][C]282656[/C][C]282908.10635773[/C][C]-252.106357730459[/C][/ROW]
[ROW][C]17[/C][C]280190[/C][C]280513.791799919[/C][C]-323.791799919447[/C][/ROW]
[ROW][C]18[/C][C]280408[/C][C]280915.071853821[/C][C]-507.071853820526[/C][/ROW]
[ROW][C]19[/C][C]276836[/C][C]279371.714756965[/C][C]-2535.714756965[/C][/ROW]
[ROW][C]20[/C][C]275216[/C][C]271437.901950835[/C][C]3778.09804916533[/C][/ROW]
[ROW][C]21[/C][C]274352[/C][C]271898.145437297[/C][C]2453.85456270335[/C][/ROW]
[ROW][C]22[/C][C]271311[/C][C]273003.243127755[/C][C]-1692.24312775541[/C][/ROW]
[ROW][C]23[/C][C]289802[/C][C]294611.713991497[/C][C]-4809.71399149712[/C][/ROW]
[ROW][C]24[/C][C]290726[/C][C]293722.442582664[/C][C]-2996.44258266373[/C][/ROW]
[ROW][C]25[/C][C]292300[/C][C]290870.741599122[/C][C]1429.25840087823[/C][/ROW]
[ROW][C]26[/C][C]278506[/C][C]286066.314126849[/C][C]-7560.31412684912[/C][/ROW]
[ROW][C]27[/C][C]269826[/C][C]268870.65195669[/C][C]955.348043310281[/C][/ROW]
[ROW][C]28[/C][C]265861[/C][C]266862.57855225[/C][C]-1001.57855225034[/C][/ROW]
[ROW][C]29[/C][C]269034[/C][C]259405.972478636[/C][C]9628.02752136407[/C][/ROW]
[ROW][C]30[/C][C]264176[/C][C]266934.991183153[/C][C]-2758.99118315341[/C][/ROW]
[ROW][C]31[/C][C]255198[/C][C]261410.676833747[/C][C]-6212.67683374725[/C][/ROW]
[ROW][C]32[/C][C]253353[/C][C]248565.551982557[/C][C]4787.44801744341[/C][/ROW]
[ROW][C]33[/C][C]246057[/C][C]246919.696978542[/C][C]-862.696978542139[/C][/ROW]
[ROW][C]34[/C][C]235372[/C][C]240716.675708324[/C][C]-5344.67570832407[/C][/ROW]
[ROW][C]35[/C][C]258556[/C][C]253663.475715044[/C][C]4892.52428495564[/C][/ROW]
[ROW][C]36[/C][C]260993[/C][C]259301.902985605[/C][C]1691.09701439535[/C][/ROW]
[ROW][C]37[/C][C]254663[/C][C]260966.662871024[/C][C]-6303.66287102413[/C][/ROW]
[ROW][C]38[/C][C]250643[/C][C]245400.708530496[/C][C]5242.29146950436[/C][/ROW]
[ROW][C]39[/C][C]243422[/C][C]241863.418997605[/C][C]1558.58100239461[/C][/ROW]
[ROW][C]40[/C][C]247105[/C][C]241835.740819375[/C][C]5269.25918062523[/C][/ROW]
[ROW][C]41[/C][C]248541[/C][C]245450.626101423[/C][C]3090.37389857738[/C][/ROW]
[ROW][C]42[/C][C]245039[/C][C]247131.458845871[/C][C]-2092.45884587118[/C][/ROW]
[ROW][C]43[/C][C]237080[/C][C]243506.884460543[/C][C]-6426.88446054308[/C][/ROW]
[ROW][C]44[/C][C]237085[/C][C]234381.982213307[/C][C]2703.01778669254[/C][/ROW]
[ROW][C]45[/C][C]225554[/C][C]231189.374598531[/C][C]-5635.37459853094[/C][/ROW]
[ROW][C]46[/C][C]226839[/C][C]219796.812994222[/C][C]7042.18700577784[/C][/ROW]
[ROW][C]47[/C][C]247934[/C][C]248560.808388502[/C][C]-626.808388501522[/C][/ROW]
[ROW][C]48[/C][C]248333[/C][C]251007.783076531[/C][C]-2674.78307653122[/C][/ROW]
[ROW][C]49[/C][C]246969[/C][C]248046.578951782[/C][C]-1077.57895178214[/C][/ROW]
[ROW][C]50[/C][C]245098[/C][C]241056.74203742[/C][C]4041.25796257981[/C][/ROW]
[ROW][C]51[/C][C]246263[/C][C]237659.434519732[/C][C]8603.5654802678[/C][/ROW]
[ROW][C]52[/C][C]255765[/C][C]248302.902956166[/C][C]7462.09704383434[/C][/ROW]
[ROW][C]53[/C][C]264319[/C][C]258308.283414893[/C][C]6010.71658510726[/C][/ROW]
[ROW][C]54[/C][C]268347[/C][C]267442.913613978[/C][C]904.086386021867[/C][/ROW]
[ROW][C]55[/C][C]273046[/C][C]272525.635378617[/C][C]520.364621383254[/C][/ROW]
[ROW][C]56[/C][C]273963[/C][C]280186.040173054[/C][C]-6223.04017305386[/C][/ROW]
[ROW][C]57[/C][C]267430[/C][C]274526.164174507[/C][C]-7096.16417450667[/C][/ROW]
[ROW][C]58[/C][C]271993[/C][C]270078.343271137[/C][C]1914.65672886278[/C][/ROW]
[ROW][C]59[/C][C]292710[/C][C]297326.093400524[/C][C]-4616.09340052435[/C][/ROW]
[ROW][C]60[/C][C]295881[/C][C]298825.137445836[/C][C]-2944.13744583557[/C][/ROW]
[ROW][C]61[/C][C]294563[/C][C]298529.141743234[/C][C]-3966.14174323354[/C][/ROW]
[/TABLE]
Source: https://freestatistics.org/blog/index.php?pk=107376&T=2

Globally Unique Identifier (entire table): ba.freestatistics.org/blog/index.php?pk=107376&T=2

As an alternative you can also use a QR Code:  

The GUIDs for individual cells are displayed in the table below:

Interpolation Forecasts of Exponential Smoothing
tObservedFittedResiduals
13292300290364.2142094021935.78579059819
14288186288573.902492723-387.902492722787
15281477281925.614863226-448.614863226423
16282656282908.10635773-252.106357730459
17280190280513.791799919-323.791799919447
18280408280915.071853821-507.071853820526
19276836279371.714756965-2535.714756965
20275216271437.9019508353778.09804916533
21274352271898.1454372972453.85456270335
22271311273003.243127755-1692.24312775541
23289802294611.713991497-4809.71399149712
24290726293722.442582664-2996.44258266373
25292300290870.7415991221429.25840087823
26278506286066.314126849-7560.31412684912
27269826268870.65195669955.348043310281
28265861266862.57855225-1001.57855225034
29269034259405.9724786369628.02752136407
30264176266934.991183153-2758.99118315341
31255198261410.676833747-6212.67683374725
32253353248565.5519825574787.44801744341
33246057246919.696978542-862.696978542139
34235372240716.675708324-5344.67570832407
35258556253663.4757150444892.52428495564
36260993259301.9029856051691.09701439535
37254663260966.662871024-6303.66287102413
38250643245400.7085304965242.29146950436
39243422241863.4189976051558.58100239461
40247105241835.7408193755269.25918062523
41248541245450.6261014233090.37389857738
42245039247131.458845871-2092.45884587118
43237080243506.884460543-6426.88446054308
44237085234381.9822133072703.01778669254
45225554231189.374598531-5635.37459853094
46226839219796.8129942227042.18700577784
47247934248560.808388502-626.808388501522
48248333251007.783076531-2674.78307653122
49246969248046.578951782-1077.57895178214
50245098241056.742037424041.25796257981
51246263237659.4345197328603.5654802678
52255765248302.9029561667462.09704383434
53264319258308.2834148936010.71658510726
54268347267442.913613978904.086386021867
55273046272525.635378617520.364621383254
56273963280186.040173054-6223.04017305386
57267430274526.164174507-7096.16417450667
58271993270078.3432711371914.65672886278
59292710297326.093400524-4616.09340052435
60295881298825.137445836-2944.13744583557
61294563298529.141743234-3966.14174323354


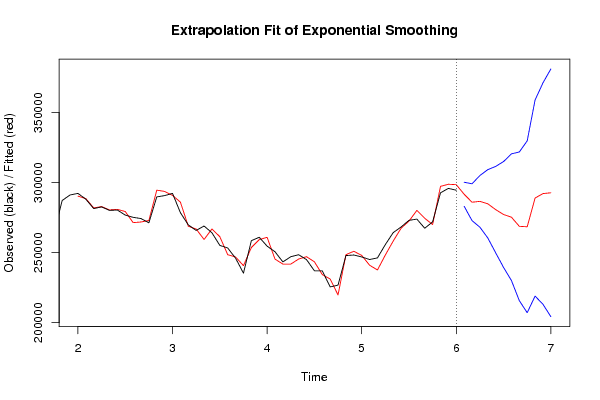
Extrapolation Forecasts of Exponential Smoothing
tForecast95% Lower Bound95% Upper Bound
62291696.584758329283130.14362148300263.025895177
63286012.500995323272858.569618521299166.432372125
64286621.360466709268163.820250168305078.90068325
65284887.210826267260516.248895975309258.17275656
66280728.271998057249899.549587436311556.994408678
67277241.571031326239456.983668843315026.158393809
68275315.617208485230112.367695075320518.866721896
69268809.450544399215753.051026108321865.85006269
70268476.328932647207155.748675367329796.909189928
71288983.022981553219007.133580811358958.912382294
72292172.661238336213167.52619024371177.796286432
73292729.721328746204336.465964794381122.976692698

\begin{tabular}{lllllllll}
\hline
Extrapolation Forecasts of Exponential Smoothing \tabularnewline
t & Forecast & 95% Lower Bound & 95% Upper Bound \tabularnewline
62 & 291696.584758329 & 283130.14362148 & 300263.025895177 \tabularnewline
63 & 286012.500995323 & 272858.569618521 & 299166.432372125 \tabularnewline
64 & 286621.360466709 & 268163.820250168 & 305078.90068325 \tabularnewline
65 & 284887.210826267 & 260516.248895975 & 309258.17275656 \tabularnewline
66 & 280728.271998057 & 249899.549587436 & 311556.994408678 \tabularnewline
67 & 277241.571031326 & 239456.983668843 & 315026.158393809 \tabularnewline
68 & 275315.617208485 & 230112.367695075 & 320518.866721896 \tabularnewline
69 & 268809.450544399 & 215753.051026108 & 321865.85006269 \tabularnewline
70 & 268476.328932647 & 207155.748675367 & 329796.909189928 \tabularnewline
71 & 288983.022981553 & 219007.133580811 & 358958.912382294 \tabularnewline
72 & 292172.661238336 & 213167.52619024 & 371177.796286432 \tabularnewline
73 & 292729.721328746 & 204336.465964794 & 381122.976692698 \tabularnewline
\hline
\end{tabular}
%Source: https://freestatistics.org/blog/index.php?pk=107376&T=3

[TABLE]
[ROW][C]Extrapolation Forecasts of Exponential Smoothing[/C][/ROW]
[ROW][C]t[/C][C]Forecast[/C][C]95% Lower Bound[/C][C]95% Upper Bound[/C][/ROW]
[ROW][C]62[/C][C]291696.584758329[/C][C]283130.14362148[/C][C]300263.025895177[/C][/ROW]
[ROW][C]63[/C][C]286012.500995323[/C][C]272858.569618521[/C][C]299166.432372125[/C][/ROW]
[ROW][C]64[/C][C]286621.360466709[/C][C]268163.820250168[/C][C]305078.90068325[/C][/ROW]
[ROW][C]65[/C][C]284887.210826267[/C][C]260516.248895975[/C][C]309258.17275656[/C][/ROW]
[ROW][C]66[/C][C]280728.271998057[/C][C]249899.549587436[/C][C]311556.994408678[/C][/ROW]
[ROW][C]67[/C][C]277241.571031326[/C][C]239456.983668843[/C][C]315026.158393809[/C][/ROW]
[ROW][C]68[/C][C]275315.617208485[/C][C]230112.367695075[/C][C]320518.866721896[/C][/ROW]
[ROW][C]69[/C][C]268809.450544399[/C][C]215753.051026108[/C][C]321865.85006269[/C][/ROW]
[ROW][C]70[/C][C]268476.328932647[/C][C]207155.748675367[/C][C]329796.909189928[/C][/ROW]
[ROW][C]71[/C][C]288983.022981553[/C][C]219007.133580811[/C][C]358958.912382294[/C][/ROW]
[ROW][C]72[/C][C]292172.661238336[/C][C]213167.52619024[/C][C]371177.796286432[/C][/ROW]
[ROW][C]73[/C][C]292729.721328746[/C][C]204336.465964794[/C][C]381122.976692698[/C][/ROW]
[/TABLE]
Source: https://freestatistics.org/blog/index.php?pk=107376&T=3

Globally Unique Identifier (entire table): ba.freestatistics.org/blog/index.php?pk=107376&T=3

As an alternative you can also use a QR Code:  

The GUIDs for individual cells are displayed in the table below:

Extrapolation Forecasts of Exponential Smoothing
tForecast95% Lower Bound95% Upper Bound
62291696.584758329283130.14362148300263.025895177
63286012.500995323272858.569618521299166.432372125
64286621.360466709268163.820250168305078.90068325
65284887.210826267260516.248895975309258.17275656
66280728.271998057249899.549587436311556.994408678
67277241.571031326239456.983668843315026.158393809
68275315.617208485230112.367695075320518.866721896
69268809.450544399215753.051026108321865.85006269
70268476.328932647207155.748675367329796.909189928
71288983.022981553219007.133580811358958.912382294
72292172.661238336213167.52619024371177.796286432
73292729.721328746204336.465964794381122.976692698


Parameters (Session):
par1 = 12 ; par2 = Triple ; par3 = additive ;
Parameters (R input):
par1 = 12 ; par2 = Triple ; par3 = additive ;
R code (references can be found in the software module):
par1 <- as.numeric(par1)
if (par2 == 'Single') K <- 1
if (par2 == 'Double') K <- 2
if (par2 == 'Triple') K <- par1
nx <- length(x)
nxmK <- nx - K
x <- ts(x, frequency = par1)
if (par2 == 'Single') fit <- HoltWinters(x, gamma=0, beta=0)
if (par2 == 'Double') fit <- HoltWinters(x, gamma=0)
if (par2 == 'Triple') fit <- HoltWinters(x, seasonal=par3)
fit
myresid <- x - fit$fitted[,'xhat']
bitmap(file='test1.png')
op <- par(mfrow=c(2,1))
plot(fit,ylab='Observed (black) / Fitted (red)',main='Interpolation Fit of Exponential Smoothing')
plot(myresid,ylab='Residuals',main='Interpolation Prediction Errors')
par(op)
dev.off()
bitmap(file='test2.png')
p <- predict(fit, par1, prediction.interval=TRUE)
np <- length(p[,1])
plot(fit,p,ylab='Observed (black) / Fitted (red)',main='Extrapolation Fit of Exponential Smoothing')
dev.off()
bitmap(file='test3.png')
op <- par(mfrow = c(2,2))
acf(as.numeric(myresid),lag.max = nx/2,main='Residual ACF')
spectrum(myresid,main='Residals Periodogram')
cpgram(myresid,main='Residal Cumulative Periodogram')
qqnorm(myresid,main='Residual Normal QQ Plot')
qqline(myresid)
par(op)
dev.off()
load(file='createtable')
a<-table.start()
a<-table.row.start(a)
a<-table.element(a,'Estimated Parameters of Exponential Smoothing',2,TRUE)
a<-table.row.end(a)
a<-table.row.start(a)
a<-table.element(a,'Parameter',header=TRUE)
a<-table.element(a,'Value',header=TRUE)
a<-table.row.end(a)
a<-table.row.start(a)
a<-table.element(a,'alpha',header=TRUE)
a<-table.element(a,fit$alpha)
a<-table.row.end(a)
a<-table.row.start(a)
a<-table.element(a,'beta',header=TRUE)
a<-table.element(a,fit$beta)
a<-table.row.end(a)
a<-table.row.start(a)
a<-table.element(a,'gamma',header=TRUE)
a<-table.element(a,fit$gamma)
a<-table.row.end(a)
a<-table.end(a)
table.save(a,file='mytable.tab')
a<-table.start()
a<-table.row.start(a)
a<-table.element(a,'Interpolation Forecasts of Exponential Smoothing',4,TRUE)
a<-table.row.end(a)
a<-table.row.start(a)
a<-table.element(a,'t',header=TRUE)
a<-table.element(a,'Observed',header=TRUE)
a<-table.element(a,'Fitted',header=TRUE)
a<-table.element(a,'Residuals',header=TRUE)
a<-table.row.end(a)
for (i in 1:nxmK) {
a<-table.row.start(a)
a<-table.element(a,i+K,header=TRUE)
a<-table.element(a,x[i+K])
a<-table.element(a,fit$fitted[i,'xhat'])
a<-table.element(a,myresid[i])
a<-table.row.end(a)
}
a<-table.end(a)
table.save(a,file='mytable1.tab')
a<-table.start()
a<-table.row.start(a)
a<-table.element(a,'Extrapolation Forecasts of Exponential Smoothing',4,TRUE)
a<-table.row.end(a)
a<-table.row.start(a)
a<-table.element(a,'t',header=TRUE)
a<-table.element(a,'Forecast',header=TRUE)
a<-table.element(a,'95% Lower Bound',header=TRUE)
a<-table.element(a,'95% Upper Bound',header=TRUE)
a<-table.row.end(a)
for (i in 1:np) {
a<-table.row.start(a)
a<-table.element(a,nx+i,header=TRUE)
a<-table.element(a,p[i,'fit'])
a<-table.element(a,p[i,'lwr'])
a<-table.element(a,p[i,'upr'])
a<-table.row.end(a)
}
a<-table.end(a)
table.save(a,file='mytable2.tab')