Free Statistics

of Irreproducible Research!

Author's title

Author*The author of this computation has been verified*
R Software Modulerwasp_multipleregression.wasp
Title produced by softwareMultiple Regression
Date of computationThu, 09 Dec 2010 19:50:41 +0000
Cite this page as followsStatistical Computations at FreeStatistics.org, Office for Research Development and Education, URL https://freestatistics.org/blog/index.php?v=date/2010/Dec/09/t12919241147gjusabds0dqp5a.htm/, Retrieved Sun, 28 Apr 2024 23:40:03 +0000
Statistical Computations at FreeStatistics.org, Office for Research Development and Education, URL https://freestatistics.org/blog/index.php?pk=107374, Retrieved Sun, 28 Apr 2024 23:40:03 +0000
QR Codes:

Original text written by user:
IsPrivate?No (this computation is public)
User-defined keywords
Estimated Impact116
Family? (F = Feedback message, R = changed R code, M = changed R Module, P = changed Parameters, D = changed Data)
-     [Multiple Regression] [HPC Retail Sales] [2008-03-08 13:40:54] [1c0f2c85e8a48e42648374b3bcceca26]
-  MPD    [Multiple Regression] [] [2010-12-09 19:50:41] [6ca9362bade14820cda7467b7288bbb3] [Current]
Feedback Forum

Post a new message
Dataseries X:
286602
283042
276687
277915
277128
277103
275037
270150
267140
264993
287259
291186
292300
288186
281477
282656
280190
280408
276836
275216
274352
271311
289802
290726
292300
278506
269826
265861
269034
264176
255198
253353
246057
235372
258556
260993
254663
250643
243422
247105
248541
245039
237080
237085
225554
226839
247934
248333
246969
245098
246263
255765
264319
268347
273046
273963
267430
271993
292710
295881
294563


Summary of computational transaction
Raw Inputview raw input (R code)
Raw Outputview raw output of R engine
Computing time5 seconds
R Server'Sir Ronald Aylmer Fisher' @ 193.190.124.24

\begin{tabular}{lllllllll}
\hline
Summary of computational transaction \tabularnewline
Raw Input & view raw input (R code)  \tabularnewline
Raw Output & view raw output of R engine  \tabularnewline
Computing time & 5 seconds \tabularnewline
R Server & 'Sir Ronald Aylmer Fisher' @ 193.190.124.24 \tabularnewline
\hline
\end{tabular}
%Source: https://freestatistics.org/blog/index.php?pk=107374&T=0

[TABLE]
[ROW][C]Summary of computational transaction[/C][/ROW]
[ROW][C]Raw Input[/C][C]view raw input (R code) [/C][/ROW]
[ROW][C]Raw Output[/C][C]view raw output of R engine [/C][/ROW]
[ROW][C]Computing time[/C][C]5 seconds[/C][/ROW]
[ROW][C]R Server[/C][C]'Sir Ronald Aylmer Fisher' @ 193.190.124.24[/C][/ROW]
[/TABLE]
Source: https://freestatistics.org/blog/index.php?pk=107374&T=0

Globally Unique Identifier (entire table): ba.freestatistics.org/blog/index.php?pk=107374&T=0

As an alternative you can also use a QR Code:  

The GUIDs for individual cells are displayed in the table below:

Summary of computational transaction
Raw Inputview raw input (R code)
Raw Outputview raw output of R engine
Computing time5 seconds
R Server'Sir Ronald Aylmer Fisher' @ 193.190.124.24


Multiple Linear Regression - Estimated Regression Equation
HPC[t] = + 293568.447058824 -1766.61209150322M1[t] -12813.4241830065M2[t] -17924.9617647059M3[t] -15151.0993464052M4[t] -12720.6369281046M5[t] -13099.9745098039M6[t] -16226.7120915033M7[t] -17264.2496732026M8[t] -22662.5872549020M9[t] -24219.1248366013M10[t] -2620.06241830065M11[t] -448.462418300654t + e[t]

\begin{tabular}{lllllllll}
\hline
Multiple Linear Regression - Estimated Regression Equation \tabularnewline
HPC[t] =  +  293568.447058824 -1766.61209150322M1[t] -12813.4241830065M2[t] -17924.9617647059M3[t] -15151.0993464052M4[t] -12720.6369281046M5[t] -13099.9745098039M6[t] -16226.7120915033M7[t] -17264.2496732026M8[t] -22662.5872549020M9[t] -24219.1248366013M10[t] -2620.06241830065M11[t] -448.462418300654t  + e[t] \tabularnewline
\hline
\end{tabular}
%Source: https://freestatistics.org/blog/index.php?pk=107374&T=1

[TABLE]
[ROW][C]Multiple Linear Regression - Estimated Regression Equation[/C][/ROW]
[ROW][C]HPC[t] =  +  293568.447058824 -1766.61209150322M1[t] -12813.4241830065M2[t] -17924.9617647059M3[t] -15151.0993464052M4[t] -12720.6369281046M5[t] -13099.9745098039M6[t] -16226.7120915033M7[t] -17264.2496732026M8[t] -22662.5872549020M9[t] -24219.1248366013M10[t] -2620.06241830065M11[t] -448.462418300654t  + e[t][/C][/ROW]
[/TABLE]
Source: https://freestatistics.org/blog/index.php?pk=107374&T=1

Globally Unique Identifier (entire table): ba.freestatistics.org/blog/index.php?pk=107374&T=1

As an alternative you can also use a QR Code:  

The GUIDs for individual cells are displayed in the table below:

Multiple Linear Regression - Estimated Regression Equation
HPC[t] = + 293568.447058824 -1766.61209150322M1[t] -12813.4241830065M2[t] -17924.9617647059M3[t] -15151.0993464052M4[t] -12720.6369281046M5[t] -13099.9745098039M6[t] -16226.7120915033M7[t] -17264.2496732026M8[t] -22662.5872549020M9[t] -24219.1248366013M10[t] -2620.06241830065M11[t] -448.462418300654t + e[t]


Multiple Linear Regression - Ordinary Least Squares
VariableParameterS.D.T-STATH0: parameter = 02-tail p-value1-tail p-value
(Intercept)293568.4470588248513.55238434.482500
M1-1766.612091503229928.804936-0.17790.8595280.429764
M2-12813.424183006510421.331268-1.22950.2248630.112432
M3-17924.961764705910408.023114-1.72220.0914670.045734
M4-15151.099346405210396.101377-1.45740.1515220.075761
M5-12720.636928104610385.570833-1.22480.2266130.113307
M6-13099.974509803910376.435717-1.26250.2128780.106439
M7-16226.712091503310368.699718-1.5650.1241590.06208
M8-17264.249673202610362.365968-1.66610.1022170.051108
M9-22662.587254902010357.43704-2.1880.0335660.016783
M10-24219.124836601310353.914941-2.33910.0235390.011769
M11-2620.0624183006510351.801106-0.25310.801270.400635
t-448.462418300654120.786951-3.71280.0005330.000267

\begin{tabular}{lllllllll}
\hline
Multiple Linear Regression - Ordinary Least Squares \tabularnewline
Variable & Parameter & S.D. & T-STATH0: parameter = 0 & 2-tail p-value & 1-tail p-value \tabularnewline
(Intercept) & 293568.447058824 & 8513.552384 & 34.4825 & 0 & 0 \tabularnewline
M1 & -1766.61209150322 & 9928.804936 & -0.1779 & 0.859528 & 0.429764 \tabularnewline
M2 & -12813.4241830065 & 10421.331268 & -1.2295 & 0.224863 & 0.112432 \tabularnewline
M3 & -17924.9617647059 & 10408.023114 & -1.7222 & 0.091467 & 0.045734 \tabularnewline
M4 & -15151.0993464052 & 10396.101377 & -1.4574 & 0.151522 & 0.075761 \tabularnewline
M5 & -12720.6369281046 & 10385.570833 & -1.2248 & 0.226613 & 0.113307 \tabularnewline
M6 & -13099.9745098039 & 10376.435717 & -1.2625 & 0.212878 & 0.106439 \tabularnewline
M7 & -16226.7120915033 & 10368.699718 & -1.565 & 0.124159 & 0.06208 \tabularnewline
M8 & -17264.2496732026 & 10362.365968 & -1.6661 & 0.102217 & 0.051108 \tabularnewline
M9 & -22662.5872549020 & 10357.43704 & -2.188 & 0.033566 & 0.016783 \tabularnewline
M10 & -24219.1248366013 & 10353.914941 & -2.3391 & 0.023539 & 0.011769 \tabularnewline
M11 & -2620.06241830065 & 10351.801106 & -0.2531 & 0.80127 & 0.400635 \tabularnewline
t & -448.462418300654 & 120.786951 & -3.7128 & 0.000533 & 0.000267 \tabularnewline
\hline
\end{tabular}
%Source: https://freestatistics.org/blog/index.php?pk=107374&T=2

[TABLE]
[ROW][C]Multiple Linear Regression - Ordinary Least Squares[/C][/ROW]
[ROW][C]Variable[/C][C]Parameter[/C][C]S.D.[/C][C]T-STATH0: parameter = 0[/C][C]2-tail p-value[/C][C]1-tail p-value[/C][/ROW]
[ROW][C](Intercept)[/C][C]293568.447058824[/C][C]8513.552384[/C][C]34.4825[/C][C]0[/C][C]0[/C][/ROW]
[ROW][C]M1[/C][C]-1766.61209150322[/C][C]9928.804936[/C][C]-0.1779[/C][C]0.859528[/C][C]0.429764[/C][/ROW]
[ROW][C]M2[/C][C]-12813.4241830065[/C][C]10421.331268[/C][C]-1.2295[/C][C]0.224863[/C][C]0.112432[/C][/ROW]
[ROW][C]M3[/C][C]-17924.9617647059[/C][C]10408.023114[/C][C]-1.7222[/C][C]0.091467[/C][C]0.045734[/C][/ROW]
[ROW][C]M4[/C][C]-15151.0993464052[/C][C]10396.101377[/C][C]-1.4574[/C][C]0.151522[/C][C]0.075761[/C][/ROW]
[ROW][C]M5[/C][C]-12720.6369281046[/C][C]10385.570833[/C][C]-1.2248[/C][C]0.226613[/C][C]0.113307[/C][/ROW]
[ROW][C]M6[/C][C]-13099.9745098039[/C][C]10376.435717[/C][C]-1.2625[/C][C]0.212878[/C][C]0.106439[/C][/ROW]
[ROW][C]M7[/C][C]-16226.7120915033[/C][C]10368.699718[/C][C]-1.565[/C][C]0.124159[/C][C]0.06208[/C][/ROW]
[ROW][C]M8[/C][C]-17264.2496732026[/C][C]10362.365968[/C][C]-1.6661[/C][C]0.102217[/C][C]0.051108[/C][/ROW]
[ROW][C]M9[/C][C]-22662.5872549020[/C][C]10357.43704[/C][C]-2.188[/C][C]0.033566[/C][C]0.016783[/C][/ROW]
[ROW][C]M10[/C][C]-24219.1248366013[/C][C]10353.914941[/C][C]-2.3391[/C][C]0.023539[/C][C]0.011769[/C][/ROW]
[ROW][C]M11[/C][C]-2620.06241830065[/C][C]10351.801106[/C][C]-0.2531[/C][C]0.80127[/C][C]0.400635[/C][/ROW]
[ROW][C]t[/C][C]-448.462418300654[/C][C]120.786951[/C][C]-3.7128[/C][C]0.000533[/C][C]0.000267[/C][/ROW]
[/TABLE]
Source: https://freestatistics.org/blog/index.php?pk=107374&T=2

Globally Unique Identifier (entire table): ba.freestatistics.org/blog/index.php?pk=107374&T=2

As an alternative you can also use a QR Code:  

The GUIDs for individual cells are displayed in the table below:

Multiple Linear Regression - Ordinary Least Squares
VariableParameterS.D.T-STATH0: parameter = 02-tail p-value1-tail p-value
(Intercept)293568.4470588248513.55238434.482500
M1-1766.612091503229928.804936-0.17790.8595280.429764
M2-12813.424183006510421.331268-1.22950.2248630.112432
M3-17924.961764705910408.023114-1.72220.0914670.045734
M4-15151.099346405210396.101377-1.45740.1515220.075761
M5-12720.636928104610385.570833-1.22480.2266130.113307
M6-13099.974509803910376.435717-1.26250.2128780.106439
M7-16226.712091503310368.699718-1.5650.1241590.06208
M8-17264.249673202610362.365968-1.66610.1022170.051108
M9-22662.587254902010357.43704-2.1880.0335660.016783
M10-24219.124836601310353.914941-2.33910.0235390.011769
M11-2620.0624183006510351.801106-0.25310.801270.400635
t-448.462418300654120.786951-3.71280.0005330.000267


Multiple Linear Regression - Regression Statistics
Multiple R0.593587018188936
R-squared0.352345548162432
Adjusted R-squared0.190431935203040
F-TEST (value)2.17613294967854
F-TEST (DF numerator)12
F-TEST (DF denominator)48
p-value0.0286157043556925
Multiple Linear Regression - Residual Statistics
Residual Standard Deviation16366.520449259
Sum Squared Residuals12857423597.5686

\begin{tabular}{lllllllll}
\hline
Multiple Linear Regression - Regression Statistics \tabularnewline
Multiple R & 0.593587018188936 \tabularnewline
R-squared & 0.352345548162432 \tabularnewline
Adjusted R-squared & 0.190431935203040 \tabularnewline
F-TEST (value) & 2.17613294967854 \tabularnewline
F-TEST (DF numerator) & 12 \tabularnewline
F-TEST (DF denominator) & 48 \tabularnewline
p-value & 0.0286157043556925 \tabularnewline
Multiple Linear Regression - Residual Statistics \tabularnewline
Residual Standard Deviation & 16366.520449259 \tabularnewline
Sum Squared Residuals & 12857423597.5686 \tabularnewline
\hline
\end{tabular}
%Source: https://freestatistics.org/blog/index.php?pk=107374&T=3

[TABLE]
[ROW][C]Multiple Linear Regression - Regression Statistics[/C][/ROW]
[ROW][C]Multiple R[/C][C]0.593587018188936[/C][/ROW]
[ROW][C]R-squared[/C][C]0.352345548162432[/C][/ROW]
[ROW][C]Adjusted R-squared[/C][C]0.190431935203040[/C][/ROW]
[ROW][C]F-TEST (value)[/C][C]2.17613294967854[/C][/ROW]
[ROW][C]F-TEST (DF numerator)[/C][C]12[/C][/ROW]
[ROW][C]F-TEST (DF denominator)[/C][C]48[/C][/ROW]
[ROW][C]p-value[/C][C]0.0286157043556925[/C][/ROW]
[ROW][C]Multiple Linear Regression - Residual Statistics[/C][/ROW]
[ROW][C]Residual Standard Deviation[/C][C]16366.520449259[/C][/ROW]
[ROW][C]Sum Squared Residuals[/C][C]12857423597.5686[/C][/ROW]
[/TABLE]
Source: https://freestatistics.org/blog/index.php?pk=107374&T=3

Globally Unique Identifier (entire table): ba.freestatistics.org/blog/index.php?pk=107374&T=3

As an alternative you can also use a QR Code:  

The GUIDs for individual cells are displayed in the table below:

Multiple Linear Regression - Regression Statistics
Multiple R0.593587018188936
R-squared0.352345548162432
Adjusted R-squared0.190431935203040
F-TEST (value)2.17613294967854
F-TEST (DF numerator)12
F-TEST (DF denominator)48
p-value0.0286157043556925
Multiple Linear Regression - Residual Statistics
Residual Standard Deviation16366.520449259
Sum Squared Residuals12857423597.5686


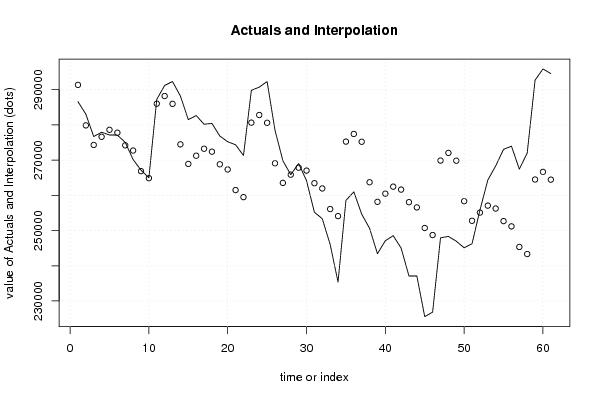
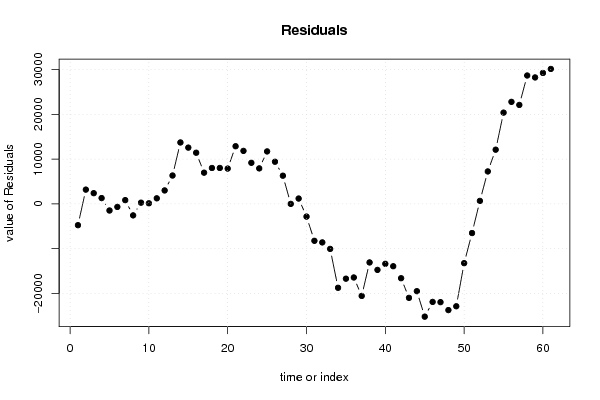
Multiple Linear Regression - Actuals, Interpolation, and Residuals
Time or IndexActualsInterpolationForecastResidualsPrediction Error
1286602291353.372549019-4751.37254901937
2283042279858.0980392163183.90196078429
3276687274298.0980392162388.90196078429
4277915276623.4980392161291.50196078430
5277128278605.498039216-1477.49803921570
6277103277777.698039216-674.698039215695
7275037274202.498039216834.501960784299
8270150272716.498039216-2566.4980392157
9267140266869.698039216270.301960784298
10264993264864.698039216128.301960784296
11287259286015.2980392161243.70196078430
12291186288186.8980392162999.1019607843
13292300285971.8235294126328.17647058818
14288186274476.54901960813709.4509803922
15281477268916.54901960812560.4509803922
16282656271241.94901960811414.0509803922
17280190273223.9490196086966.05098039215
18280408272396.1490196088011.85098039215
19276836268820.9490196088015.05098039215
20275216267334.9490196087881.05098039215
21274352261488.14901960812863.8509803921
22271311259483.14901960811827.8509803922
23289802280633.7490196089168.25098039215
24290726282805.3490196087920.65098039215
25292300280590.27450980411709.7254901960
262785062690959411
272698262635356291
28265861265860.40.599999999996718
29269034267842.41191.60000000000
30264176267014.6-2838.60000000000
31255198263439.4-8241.4
32253353261953.4-8600.4
33246057256106.6-10049.6
34235372254101.6-18729.6
35258556275252.2-16696.2
36260993277423.8-16430.8
37254663275208.725490196-20545.7254901961
38250643263713.450980392-13070.4509803921
39243422258153.450980392-14731.4509803921
40247105260478.850980392-13373.8509803921
41248541262460.850980392-13919.8509803921
42245039261633.050980392-16594.0509803921
43237080258057.850980392-20977.8509803921
44237085256571.850980392-19486.8509803922
45225554250725.050980392-25171.0509803921
46226839248720.050980392-21881.0509803922
47247934269870.650980392-21936.6509803921
48248333272042.250980392-23709.2509803921
49246969269827.176470588-22858.1764705883
50245098258331.901960784-13233.9019607843
51246263252771.901960784-6508.9019607843
52255765255097.301960784667.698039215697
53264319257079.3019607847239.6980392157
54268347256251.50196078412095.4980392157
55273046252676.30196078420369.6980392157
56273963251190.30196078422772.6980392157
57267430245343.50196078422086.4980392157
58271993243338.50196078428654.4980392157
59292710264489.10196078428220.8980392157
60295881266660.70196078429220.2980392157
61294563264445.62745098030117.3725490196

\begin{tabular}{lllllllll}
\hline
Multiple Linear Regression - Actuals, Interpolation, and Residuals \tabularnewline
Time or Index & Actuals & InterpolationForecast & ResidualsPrediction Error \tabularnewline
1 & 286602 & 291353.372549019 & -4751.37254901937 \tabularnewline
2 & 283042 & 279858.098039216 & 3183.90196078429 \tabularnewline
3 & 276687 & 274298.098039216 & 2388.90196078429 \tabularnewline
4 & 277915 & 276623.498039216 & 1291.50196078430 \tabularnewline
5 & 277128 & 278605.498039216 & -1477.49803921570 \tabularnewline
6 & 277103 & 277777.698039216 & -674.698039215695 \tabularnewline
7 & 275037 & 274202.498039216 & 834.501960784299 \tabularnewline
8 & 270150 & 272716.498039216 & -2566.4980392157 \tabularnewline
9 & 267140 & 266869.698039216 & 270.301960784298 \tabularnewline
10 & 264993 & 264864.698039216 & 128.301960784296 \tabularnewline
11 & 287259 & 286015.298039216 & 1243.70196078430 \tabularnewline
12 & 291186 & 288186.898039216 & 2999.1019607843 \tabularnewline
13 & 292300 & 285971.823529412 & 6328.17647058818 \tabularnewline
14 & 288186 & 274476.549019608 & 13709.4509803922 \tabularnewline
15 & 281477 & 268916.549019608 & 12560.4509803922 \tabularnewline
16 & 282656 & 271241.949019608 & 11414.0509803922 \tabularnewline
17 & 280190 & 273223.949019608 & 6966.05098039215 \tabularnewline
18 & 280408 & 272396.149019608 & 8011.85098039215 \tabularnewline
19 & 276836 & 268820.949019608 & 8015.05098039215 \tabularnewline
20 & 275216 & 267334.949019608 & 7881.05098039215 \tabularnewline
21 & 274352 & 261488.149019608 & 12863.8509803921 \tabularnewline
22 & 271311 & 259483.149019608 & 11827.8509803922 \tabularnewline
23 & 289802 & 280633.749019608 & 9168.25098039215 \tabularnewline
24 & 290726 & 282805.349019608 & 7920.65098039215 \tabularnewline
25 & 292300 & 280590.274509804 & 11709.7254901960 \tabularnewline
26 & 278506 & 269095 & 9411 \tabularnewline
27 & 269826 & 263535 & 6291 \tabularnewline
28 & 265861 & 265860.4 & 0.599999999996718 \tabularnewline
29 & 269034 & 267842.4 & 1191.60000000000 \tabularnewline
30 & 264176 & 267014.6 & -2838.60000000000 \tabularnewline
31 & 255198 & 263439.4 & -8241.4 \tabularnewline
32 & 253353 & 261953.4 & -8600.4 \tabularnewline
33 & 246057 & 256106.6 & -10049.6 \tabularnewline
34 & 235372 & 254101.6 & -18729.6 \tabularnewline
35 & 258556 & 275252.2 & -16696.2 \tabularnewline
36 & 260993 & 277423.8 & -16430.8 \tabularnewline
37 & 254663 & 275208.725490196 & -20545.7254901961 \tabularnewline
38 & 250643 & 263713.450980392 & -13070.4509803921 \tabularnewline
39 & 243422 & 258153.450980392 & -14731.4509803921 \tabularnewline
40 & 247105 & 260478.850980392 & -13373.8509803921 \tabularnewline
41 & 248541 & 262460.850980392 & -13919.8509803921 \tabularnewline
42 & 245039 & 261633.050980392 & -16594.0509803921 \tabularnewline
43 & 237080 & 258057.850980392 & -20977.8509803921 \tabularnewline
44 & 237085 & 256571.850980392 & -19486.8509803922 \tabularnewline
45 & 225554 & 250725.050980392 & -25171.0509803921 \tabularnewline
46 & 226839 & 248720.050980392 & -21881.0509803922 \tabularnewline
47 & 247934 & 269870.650980392 & -21936.6509803921 \tabularnewline
48 & 248333 & 272042.250980392 & -23709.2509803921 \tabularnewline
49 & 246969 & 269827.176470588 & -22858.1764705883 \tabularnewline
50 & 245098 & 258331.901960784 & -13233.9019607843 \tabularnewline
51 & 246263 & 252771.901960784 & -6508.9019607843 \tabularnewline
52 & 255765 & 255097.301960784 & 667.698039215697 \tabularnewline
53 & 264319 & 257079.301960784 & 7239.6980392157 \tabularnewline
54 & 268347 & 256251.501960784 & 12095.4980392157 \tabularnewline
55 & 273046 & 252676.301960784 & 20369.6980392157 \tabularnewline
56 & 273963 & 251190.301960784 & 22772.6980392157 \tabularnewline
57 & 267430 & 245343.501960784 & 22086.4980392157 \tabularnewline
58 & 271993 & 243338.501960784 & 28654.4980392157 \tabularnewline
59 & 292710 & 264489.101960784 & 28220.8980392157 \tabularnewline
60 & 295881 & 266660.701960784 & 29220.2980392157 \tabularnewline
61 & 294563 & 264445.627450980 & 30117.3725490196 \tabularnewline
\hline
\end{tabular}
%Source: https://freestatistics.org/blog/index.php?pk=107374&T=4

[TABLE]
[ROW][C]Multiple Linear Regression - Actuals, Interpolation, and Residuals[/C][/ROW]
[ROW][C]Time or Index[/C][C]Actuals[/C][C]InterpolationForecast[/C][C]ResidualsPrediction Error[/C][/ROW]
[ROW][C]1[/C][C]286602[/C][C]291353.372549019[/C][C]-4751.37254901937[/C][/ROW]
[ROW][C]2[/C][C]283042[/C][C]279858.098039216[/C][C]3183.90196078429[/C][/ROW]
[ROW][C]3[/C][C]276687[/C][C]274298.098039216[/C][C]2388.90196078429[/C][/ROW]
[ROW][C]4[/C][C]277915[/C][C]276623.498039216[/C][C]1291.50196078430[/C][/ROW]
[ROW][C]5[/C][C]277128[/C][C]278605.498039216[/C][C]-1477.49803921570[/C][/ROW]
[ROW][C]6[/C][C]277103[/C][C]277777.698039216[/C][C]-674.698039215695[/C][/ROW]
[ROW][C]7[/C][C]275037[/C][C]274202.498039216[/C][C]834.501960784299[/C][/ROW]
[ROW][C]8[/C][C]270150[/C][C]272716.498039216[/C][C]-2566.4980392157[/C][/ROW]
[ROW][C]9[/C][C]267140[/C][C]266869.698039216[/C][C]270.301960784298[/C][/ROW]
[ROW][C]10[/C][C]264993[/C][C]264864.698039216[/C][C]128.301960784296[/C][/ROW]
[ROW][C]11[/C][C]287259[/C][C]286015.298039216[/C][C]1243.70196078430[/C][/ROW]
[ROW][C]12[/C][C]291186[/C][C]288186.898039216[/C][C]2999.1019607843[/C][/ROW]
[ROW][C]13[/C][C]292300[/C][C]285971.823529412[/C][C]6328.17647058818[/C][/ROW]
[ROW][C]14[/C][C]288186[/C][C]274476.549019608[/C][C]13709.4509803922[/C][/ROW]
[ROW][C]15[/C][C]281477[/C][C]268916.549019608[/C][C]12560.4509803922[/C][/ROW]
[ROW][C]16[/C][C]282656[/C][C]271241.949019608[/C][C]11414.0509803922[/C][/ROW]
[ROW][C]17[/C][C]280190[/C][C]273223.949019608[/C][C]6966.05098039215[/C][/ROW]
[ROW][C]18[/C][C]280408[/C][C]272396.149019608[/C][C]8011.85098039215[/C][/ROW]
[ROW][C]19[/C][C]276836[/C][C]268820.949019608[/C][C]8015.05098039215[/C][/ROW]
[ROW][C]20[/C][C]275216[/C][C]267334.949019608[/C][C]7881.05098039215[/C][/ROW]
[ROW][C]21[/C][C]274352[/C][C]261488.149019608[/C][C]12863.8509803921[/C][/ROW]
[ROW][C]22[/C][C]271311[/C][C]259483.149019608[/C][C]11827.8509803922[/C][/ROW]
[ROW][C]23[/C][C]289802[/C][C]280633.749019608[/C][C]9168.25098039215[/C][/ROW]
[ROW][C]24[/C][C]290726[/C][C]282805.349019608[/C][C]7920.65098039215[/C][/ROW]
[ROW][C]25[/C][C]292300[/C][C]280590.274509804[/C][C]11709.7254901960[/C][/ROW]
[ROW][C]26[/C][C]278506[/C][C]269095[/C][C]9411[/C][/ROW]
[ROW][C]27[/C][C]269826[/C][C]263535[/C][C]6291[/C][/ROW]
[ROW][C]28[/C][C]265861[/C][C]265860.4[/C][C]0.599999999996718[/C][/ROW]
[ROW][C]29[/C][C]269034[/C][C]267842.4[/C][C]1191.60000000000[/C][/ROW]
[ROW][C]30[/C][C]264176[/C][C]267014.6[/C][C]-2838.60000000000[/C][/ROW]
[ROW][C]31[/C][C]255198[/C][C]263439.4[/C][C]-8241.4[/C][/ROW]
[ROW][C]32[/C][C]253353[/C][C]261953.4[/C][C]-8600.4[/C][/ROW]
[ROW][C]33[/C][C]246057[/C][C]256106.6[/C][C]-10049.6[/C][/ROW]
[ROW][C]34[/C][C]235372[/C][C]254101.6[/C][C]-18729.6[/C][/ROW]
[ROW][C]35[/C][C]258556[/C][C]275252.2[/C][C]-16696.2[/C][/ROW]
[ROW][C]36[/C][C]260993[/C][C]277423.8[/C][C]-16430.8[/C][/ROW]
[ROW][C]37[/C][C]254663[/C][C]275208.725490196[/C][C]-20545.7254901961[/C][/ROW]
[ROW][C]38[/C][C]250643[/C][C]263713.450980392[/C][C]-13070.4509803921[/C][/ROW]
[ROW][C]39[/C][C]243422[/C][C]258153.450980392[/C][C]-14731.4509803921[/C][/ROW]
[ROW][C]40[/C][C]247105[/C][C]260478.850980392[/C][C]-13373.8509803921[/C][/ROW]
[ROW][C]41[/C][C]248541[/C][C]262460.850980392[/C][C]-13919.8509803921[/C][/ROW]
[ROW][C]42[/C][C]245039[/C][C]261633.050980392[/C][C]-16594.0509803921[/C][/ROW]
[ROW][C]43[/C][C]237080[/C][C]258057.850980392[/C][C]-20977.8509803921[/C][/ROW]
[ROW][C]44[/C][C]237085[/C][C]256571.850980392[/C][C]-19486.8509803922[/C][/ROW]
[ROW][C]45[/C][C]225554[/C][C]250725.050980392[/C][C]-25171.0509803921[/C][/ROW]
[ROW][C]46[/C][C]226839[/C][C]248720.050980392[/C][C]-21881.0509803922[/C][/ROW]
[ROW][C]47[/C][C]247934[/C][C]269870.650980392[/C][C]-21936.6509803921[/C][/ROW]
[ROW][C]48[/C][C]248333[/C][C]272042.250980392[/C][C]-23709.2509803921[/C][/ROW]
[ROW][C]49[/C][C]246969[/C][C]269827.176470588[/C][C]-22858.1764705883[/C][/ROW]
[ROW][C]50[/C][C]245098[/C][C]258331.901960784[/C][C]-13233.9019607843[/C][/ROW]
[ROW][C]51[/C][C]246263[/C][C]252771.901960784[/C][C]-6508.9019607843[/C][/ROW]
[ROW][C]52[/C][C]255765[/C][C]255097.301960784[/C][C]667.698039215697[/C][/ROW]
[ROW][C]53[/C][C]264319[/C][C]257079.301960784[/C][C]7239.6980392157[/C][/ROW]
[ROW][C]54[/C][C]268347[/C][C]256251.501960784[/C][C]12095.4980392157[/C][/ROW]
[ROW][C]55[/C][C]273046[/C][C]252676.301960784[/C][C]20369.6980392157[/C][/ROW]
[ROW][C]56[/C][C]273963[/C][C]251190.301960784[/C][C]22772.6980392157[/C][/ROW]
[ROW][C]57[/C][C]267430[/C][C]245343.501960784[/C][C]22086.4980392157[/C][/ROW]
[ROW][C]58[/C][C]271993[/C][C]243338.501960784[/C][C]28654.4980392157[/C][/ROW]
[ROW][C]59[/C][C]292710[/C][C]264489.101960784[/C][C]28220.8980392157[/C][/ROW]
[ROW][C]60[/C][C]295881[/C][C]266660.701960784[/C][C]29220.2980392157[/C][/ROW]
[ROW][C]61[/C][C]294563[/C][C]264445.627450980[/C][C]30117.3725490196[/C][/ROW]
[/TABLE]
Source: https://freestatistics.org/blog/index.php?pk=107374&T=4

Globally Unique Identifier (entire table): ba.freestatistics.org/blog/index.php?pk=107374&T=4

As an alternative you can also use a QR Code:  

The GUIDs for individual cells are displayed in the table below:

Multiple Linear Regression - Actuals, Interpolation, and Residuals
Time or IndexActualsInterpolationForecastResidualsPrediction Error
1286602291353.372549019-4751.37254901937
2283042279858.0980392163183.90196078429
3276687274298.0980392162388.90196078429
4277915276623.4980392161291.50196078430
5277128278605.498039216-1477.49803921570
6277103277777.698039216-674.698039215695
7275037274202.498039216834.501960784299
8270150272716.498039216-2566.4980392157
9267140266869.698039216270.301960784298
10264993264864.698039216128.301960784296
11287259286015.2980392161243.70196078430
12291186288186.8980392162999.1019607843
13292300285971.8235294126328.17647058818
14288186274476.54901960813709.4509803922
15281477268916.54901960812560.4509803922
16282656271241.94901960811414.0509803922
17280190273223.9490196086966.05098039215
18280408272396.1490196088011.85098039215
19276836268820.9490196088015.05098039215
20275216267334.9490196087881.05098039215
21274352261488.14901960812863.8509803921
22271311259483.14901960811827.8509803922
23289802280633.7490196089168.25098039215
24290726282805.3490196087920.65098039215
25292300280590.27450980411709.7254901960
262785062690959411
272698262635356291
28265861265860.40.599999999996718
29269034267842.41191.60000000000
30264176267014.6-2838.60000000000
31255198263439.4-8241.4
32253353261953.4-8600.4
33246057256106.6-10049.6
34235372254101.6-18729.6
35258556275252.2-16696.2
36260993277423.8-16430.8
37254663275208.725490196-20545.7254901961
38250643263713.450980392-13070.4509803921
39243422258153.450980392-14731.4509803921
40247105260478.850980392-13373.8509803921
41248541262460.850980392-13919.8509803921
42245039261633.050980392-16594.0509803921
43237080258057.850980392-20977.8509803921
44237085256571.850980392-19486.8509803922
45225554250725.050980392-25171.0509803921
46226839248720.050980392-21881.0509803922
47247934269870.650980392-21936.6509803921
48248333272042.250980392-23709.2509803921
49246969269827.176470588-22858.1764705883
50245098258331.901960784-13233.9019607843
51246263252771.901960784-6508.9019607843
52255765255097.301960784667.698039215697
53264319257079.3019607847239.6980392157
54268347256251.50196078412095.4980392157
55273046252676.30196078420369.6980392157
56273963251190.30196078422772.6980392157
57267430245343.50196078422086.4980392157
58271993243338.50196078428654.4980392157
59292710264489.10196078428220.8980392157
60295881266660.70196078429220.2980392157
61294563264445.62745098030117.3725490196


Goldfeld-Quandt test for Heteroskedasticity
p-valuesAlternative Hypothesis
breakpoint indexgreater2-sidedless
166.01658023459024e-061.20331604691805e-050.999993983419765
173.49408884324547e-066.98817768649094e-060.999996505911157
182.54562690197232e-075.09125380394464e-070.99999974543731
198.07125049453863e-081.61425009890773e-070.999999919287495
204.78329676791352e-099.56659353582705e-090.999999995216703
211.78023099037116e-093.56046198074232e-090.99999999821977
222.06880556340787e-104.13761112681574e-100.99999999979312
233.24936681888441e-116.49873363776883e-110.999999999967506
246.6783307778119e-111.33566615556238e-100.999999999933217
253.27584220096189e-116.55168440192378e-110.999999999967242
263.51334674057214e-087.02669348114428e-080.999999964866533
276.29952550644207e-071.25990510128841e-060.99999937004745
289.99500574734472e-061.99900114946894e-050.999990004994253
291.50444291850858e-053.00888583701716e-050.999984955570815
304.58778401854214e-059.17556803708429e-050.999954122159815
310.0002448968321039610.0004897936642079220.999755103167896
320.0005352226014298950.001070445202859790.99946477739857
330.0023903839488120.0047807678976240.997609616051188
340.009891507528859920.01978301505771980.99010849247114
350.02041222729210130.04082445458420270.979587772707899
360.04293909003276240.08587818006552480.957060909967238
370.08966125088387850.1793225017677570.910338749116121
380.2410671154441920.4821342308883840.758932884555808
390.4621065265755990.9242130531511970.537893473424401
400.7223856167095020.5552287665809960.277614383290498
410.9171755261557120.1656489476885760.0828244738442881
420.992234409228180.01553118154364170.00776559077182083
430.9930023504489170.01399529910216490.00699764955108246
440.9979896050700920.004020789859815170.00201039492990758
450.9980006028090760.003998794381848990.00199939719092449

\begin{tabular}{lllllllll}
\hline
Goldfeld-Quandt test for Heteroskedasticity \tabularnewline
p-values & Alternative Hypothesis \tabularnewline
breakpoint index & greater & 2-sided & less \tabularnewline
16 & 6.01658023459024e-06 & 1.20331604691805e-05 & 0.999993983419765 \tabularnewline
17 & 3.49408884324547e-06 & 6.98817768649094e-06 & 0.999996505911157 \tabularnewline
18 & 2.54562690197232e-07 & 5.09125380394464e-07 & 0.99999974543731 \tabularnewline
19 & 8.07125049453863e-08 & 1.61425009890773e-07 & 0.999999919287495 \tabularnewline
20 & 4.78329676791352e-09 & 9.56659353582705e-09 & 0.999999995216703 \tabularnewline
21 & 1.78023099037116e-09 & 3.56046198074232e-09 & 0.99999999821977 \tabularnewline
22 & 2.06880556340787e-10 & 4.13761112681574e-10 & 0.99999999979312 \tabularnewline
23 & 3.24936681888441e-11 & 6.49873363776883e-11 & 0.999999999967506 \tabularnewline
24 & 6.6783307778119e-11 & 1.33566615556238e-10 & 0.999999999933217 \tabularnewline
25 & 3.27584220096189e-11 & 6.55168440192378e-11 & 0.999999999967242 \tabularnewline
26 & 3.51334674057214e-08 & 7.02669348114428e-08 & 0.999999964866533 \tabularnewline
27 & 6.29952550644207e-07 & 1.25990510128841e-06 & 0.99999937004745 \tabularnewline
28 & 9.99500574734472e-06 & 1.99900114946894e-05 & 0.999990004994253 \tabularnewline
29 & 1.50444291850858e-05 & 3.00888583701716e-05 & 0.999984955570815 \tabularnewline
30 & 4.58778401854214e-05 & 9.17556803708429e-05 & 0.999954122159815 \tabularnewline
31 & 0.000244896832103961 & 0.000489793664207922 & 0.999755103167896 \tabularnewline
32 & 0.000535222601429895 & 0.00107044520285979 & 0.99946477739857 \tabularnewline
33 & 0.002390383948812 & 0.004780767897624 & 0.997609616051188 \tabularnewline
34 & 0.00989150752885992 & 0.0197830150577198 & 0.99010849247114 \tabularnewline
35 & 0.0204122272921013 & 0.0408244545842027 & 0.979587772707899 \tabularnewline
36 & 0.0429390900327624 & 0.0858781800655248 & 0.957060909967238 \tabularnewline
37 & 0.0896612508838785 & 0.179322501767757 & 0.910338749116121 \tabularnewline
38 & 0.241067115444192 & 0.482134230888384 & 0.758932884555808 \tabularnewline
39 & 0.462106526575599 & 0.924213053151197 & 0.537893473424401 \tabularnewline
40 & 0.722385616709502 & 0.555228766580996 & 0.277614383290498 \tabularnewline
41 & 0.917175526155712 & 0.165648947688576 & 0.0828244738442881 \tabularnewline
42 & 0.99223440922818 & 0.0155311815436417 & 0.00776559077182083 \tabularnewline
43 & 0.993002350448917 & 0.0139952991021649 & 0.00699764955108246 \tabularnewline
44 & 0.997989605070092 & 0.00402078985981517 & 0.00201039492990758 \tabularnewline
45 & 0.998000602809076 & 0.00399879438184899 & 0.00199939719092449 \tabularnewline
\hline
\end{tabular}
%Source: https://freestatistics.org/blog/index.php?pk=107374&T=5

[TABLE]
[ROW][C]Goldfeld-Quandt test for Heteroskedasticity[/C][/ROW]
[ROW][C]p-values[/C][C]Alternative Hypothesis[/C][/ROW]
[ROW][C]breakpoint index[/C][C]greater[/C][C]2-sided[/C][C]less[/C][/ROW]
[ROW][C]16[/C][C]6.01658023459024e-06[/C][C]1.20331604691805e-05[/C][C]0.999993983419765[/C][/ROW]
[ROW][C]17[/C][C]3.49408884324547e-06[/C][C]6.98817768649094e-06[/C][C]0.999996505911157[/C][/ROW]
[ROW][C]18[/C][C]2.54562690197232e-07[/C][C]5.09125380394464e-07[/C][C]0.99999974543731[/C][/ROW]
[ROW][C]19[/C][C]8.07125049453863e-08[/C][C]1.61425009890773e-07[/C][C]0.999999919287495[/C][/ROW]
[ROW][C]20[/C][C]4.78329676791352e-09[/C][C]9.56659353582705e-09[/C][C]0.999999995216703[/C][/ROW]
[ROW][C]21[/C][C]1.78023099037116e-09[/C][C]3.56046198074232e-09[/C][C]0.99999999821977[/C][/ROW]
[ROW][C]22[/C][C]2.06880556340787e-10[/C][C]4.13761112681574e-10[/C][C]0.99999999979312[/C][/ROW]
[ROW][C]23[/C][C]3.24936681888441e-11[/C][C]6.49873363776883e-11[/C][C]0.999999999967506[/C][/ROW]
[ROW][C]24[/C][C]6.6783307778119e-11[/C][C]1.33566615556238e-10[/C][C]0.999999999933217[/C][/ROW]
[ROW][C]25[/C][C]3.27584220096189e-11[/C][C]6.55168440192378e-11[/C][C]0.999999999967242[/C][/ROW]
[ROW][C]26[/C][C]3.51334674057214e-08[/C][C]7.02669348114428e-08[/C][C]0.999999964866533[/C][/ROW]
[ROW][C]27[/C][C]6.29952550644207e-07[/C][C]1.25990510128841e-06[/C][C]0.99999937004745[/C][/ROW]
[ROW][C]28[/C][C]9.99500574734472e-06[/C][C]1.99900114946894e-05[/C][C]0.999990004994253[/C][/ROW]
[ROW][C]29[/C][C]1.50444291850858e-05[/C][C]3.00888583701716e-05[/C][C]0.999984955570815[/C][/ROW]
[ROW][C]30[/C][C]4.58778401854214e-05[/C][C]9.17556803708429e-05[/C][C]0.999954122159815[/C][/ROW]
[ROW][C]31[/C][C]0.000244896832103961[/C][C]0.000489793664207922[/C][C]0.999755103167896[/C][/ROW]
[ROW][C]32[/C][C]0.000535222601429895[/C][C]0.00107044520285979[/C][C]0.99946477739857[/C][/ROW]
[ROW][C]33[/C][C]0.002390383948812[/C][C]0.004780767897624[/C][C]0.997609616051188[/C][/ROW]
[ROW][C]34[/C][C]0.00989150752885992[/C][C]0.0197830150577198[/C][C]0.99010849247114[/C][/ROW]
[ROW][C]35[/C][C]0.0204122272921013[/C][C]0.0408244545842027[/C][C]0.979587772707899[/C][/ROW]
[ROW][C]36[/C][C]0.0429390900327624[/C][C]0.0858781800655248[/C][C]0.957060909967238[/C][/ROW]
[ROW][C]37[/C][C]0.0896612508838785[/C][C]0.179322501767757[/C][C]0.910338749116121[/C][/ROW]
[ROW][C]38[/C][C]0.241067115444192[/C][C]0.482134230888384[/C][C]0.758932884555808[/C][/ROW]
[ROW][C]39[/C][C]0.462106526575599[/C][C]0.924213053151197[/C][C]0.537893473424401[/C][/ROW]
[ROW][C]40[/C][C]0.722385616709502[/C][C]0.555228766580996[/C][C]0.277614383290498[/C][/ROW]
[ROW][C]41[/C][C]0.917175526155712[/C][C]0.165648947688576[/C][C]0.0828244738442881[/C][/ROW]
[ROW][C]42[/C][C]0.99223440922818[/C][C]0.0155311815436417[/C][C]0.00776559077182083[/C][/ROW]
[ROW][C]43[/C][C]0.993002350448917[/C][C]0.0139952991021649[/C][C]0.00699764955108246[/C][/ROW]
[ROW][C]44[/C][C]0.997989605070092[/C][C]0.00402078985981517[/C][C]0.00201039492990758[/C][/ROW]
[ROW][C]45[/C][C]0.998000602809076[/C][C]0.00399879438184899[/C][C]0.00199939719092449[/C][/ROW]
[/TABLE]
Source: https://freestatistics.org/blog/index.php?pk=107374&T=5

Globally Unique Identifier (entire table): ba.freestatistics.org/blog/index.php?pk=107374&T=5

As an alternative you can also use a QR Code:  

The GUIDs for individual cells are displayed in the table below:

Goldfeld-Quandt test for Heteroskedasticity
p-valuesAlternative Hypothesis
breakpoint indexgreater2-sidedless
166.01658023459024e-061.20331604691805e-050.999993983419765
173.49408884324547e-066.98817768649094e-060.999996505911157
182.54562690197232e-075.09125380394464e-070.99999974543731
198.07125049453863e-081.61425009890773e-070.999999919287495
204.78329676791352e-099.56659353582705e-090.999999995216703
211.78023099037116e-093.56046198074232e-090.99999999821977
222.06880556340787e-104.13761112681574e-100.99999999979312
233.24936681888441e-116.49873363776883e-110.999999999967506
246.6783307778119e-111.33566615556238e-100.999999999933217
253.27584220096189e-116.55168440192378e-110.999999999967242
263.51334674057214e-087.02669348114428e-080.999999964866533
276.29952550644207e-071.25990510128841e-060.99999937004745
289.99500574734472e-061.99900114946894e-050.999990004994253
291.50444291850858e-053.00888583701716e-050.999984955570815
304.58778401854214e-059.17556803708429e-050.999954122159815
310.0002448968321039610.0004897936642079220.999755103167896
320.0005352226014298950.001070445202859790.99946477739857
330.0023903839488120.0047807678976240.997609616051188
340.009891507528859920.01978301505771980.99010849247114
350.02041222729210130.04082445458420270.979587772707899
360.04293909003276240.08587818006552480.957060909967238
370.08966125088387850.1793225017677570.910338749116121
380.2410671154441920.4821342308883840.758932884555808
390.4621065265755990.9242130531511970.537893473424401
400.7223856167095020.5552287665809960.277614383290498
410.9171755261557120.1656489476885760.0828244738442881
420.992234409228180.01553118154364170.00776559077182083
430.9930023504489170.01399529910216490.00699764955108246
440.9979896050700920.004020789859815170.00201039492990758
450.9980006028090760.003998794381848990.00199939719092449


Meta Analysis of Goldfeld-Quandt test for Heteroskedasticity
Description# significant tests% significant testsOK/NOK
1% type I error level200.666666666666667NOK
5% type I error level240.8NOK
10% type I error level250.833333333333333NOK

\begin{tabular}{lllllllll}
\hline
Meta Analysis of Goldfeld-Quandt test for Heteroskedasticity \tabularnewline
Description & # significant tests & % significant tests & OK/NOK \tabularnewline
1% type I error level & 20 & 0.666666666666667 & NOK \tabularnewline
5% type I error level & 24 & 0.8 & NOK \tabularnewline
10% type I error level & 25 & 0.833333333333333 & NOK \tabularnewline
\hline
\end{tabular}
%Source: https://freestatistics.org/blog/index.php?pk=107374&T=6

[TABLE]
[ROW][C]Meta Analysis of Goldfeld-Quandt test for Heteroskedasticity[/C][/ROW]
[ROW][C]Description[/C][C]# significant tests[/C][C]% significant tests[/C][C]OK/NOK[/C][/ROW]
[ROW][C]1% type I error level[/C][C]20[/C][C]0.666666666666667[/C][C]NOK[/C][/ROW]
[ROW][C]5% type I error level[/C][C]24[/C][C]0.8[/C][C]NOK[/C][/ROW]
[ROW][C]10% type I error level[/C][C]25[/C][C]0.833333333333333[/C][C]NOK[/C][/ROW]
[/TABLE]
Source: https://freestatistics.org/blog/index.php?pk=107374&T=6

Globally Unique Identifier (entire table): ba.freestatistics.org/blog/index.php?pk=107374&T=6

As an alternative you can also use a QR Code:  

The GUIDs for individual cells are displayed in the table below:

Meta Analysis of Goldfeld-Quandt test for Heteroskedasticity
Description# significant tests% significant testsOK/NOK
1% type I error level200.666666666666667NOK
5% type I error level240.8NOK
10% type I error level250.833333333333333NOK


Parameters (Session):
par1 = 1 ; par2 = Include Monthly Dummies ; par3 = Linear Trend ;
Parameters (R input):
par1 = 1 ; par2 = Include Monthly Dummies ; par3 = Linear Trend ;
R code (references can be found in the software module):
library(lattice)
library(lmtest)
n25 <- 25 #minimum number of obs. for Goldfeld-Quandt test
par1 <- as.numeric(par1)
x <- t(y)
k <- length(x[1,])
n <- length(x[,1])
x1 <- cbind(x[,par1], x[,1:k!=par1])
mycolnames <- c(colnames(x)[par1], colnames(x)[1:k!=par1])
colnames(x1) <- mycolnames #colnames(x)[par1]
x <- x1
if (par3 == 'First Differences'){
x2 <- array(0, dim=c(n-1,k), dimnames=list(1:(n-1), paste('(1-B)',colnames(x),sep='')))
for (i in 1:n-1) {
for (j in 1:k) {
x2[i,j] <- x[i+1,j] - x[i,j]
}
}
x <- x2
}
if (par2 == 'Include Monthly Dummies'){
x2 <- array(0, dim=c(n,11), dimnames=list(1:n, paste('M', seq(1:11), sep ='')))
for (i in 1:11){
x2[seq(i,n,12),i] <- 1
}
x <- cbind(x, x2)
}
if (par2 == 'Include Quarterly Dummies'){
x2 <- array(0, dim=c(n,3), dimnames=list(1:n, paste('Q', seq(1:3), sep ='')))
for (i in 1:3){
x2[seq(i,n,4),i] <- 1
}
x <- cbind(x, x2)
}
k <- length(x[1,])
if (par3 == 'Linear Trend'){
x <- cbind(x, c(1:n))
colnames(x)[k+1] <- 't'
}
x
k <- length(x[1,])
df <- as.data.frame(x)
(mylm <- lm(df))
(mysum <- summary(mylm))
if (n > n25) {
kp3 <- k + 3
nmkm3 <- n - k - 3
gqarr <- array(NA, dim=c(nmkm3-kp3+1,3))
numgqtests <- 0
numsignificant1 <- 0
numsignificant5 <- 0
numsignificant10 <- 0
for (mypoint in kp3:nmkm3) {
j <- 0
numgqtests <- numgqtests + 1
for (myalt in c('greater', 'two.sided', 'less')) {
j <- j + 1
gqarr[mypoint-kp3+1,j] <- gqtest(mylm, point=mypoint, alternative=myalt)$p.value
}
if (gqarr[mypoint-kp3+1,2] < 0.01) numsignificant1 <- numsignificant1 + 1
if (gqarr[mypoint-kp3+1,2] < 0.05) numsignificant5 <- numsignificant5 + 1
if (gqarr[mypoint-kp3+1,2] < 0.10) numsignificant10 <- numsignificant10 + 1
}
gqarr
}
bitmap(file='test0.png')
plot(x[,1], type='l', main='Actuals and Interpolation', ylab='value of Actuals and Interpolation (dots)', xlab='time or index')
points(x[,1]-mysum$resid)
grid()
dev.off()
bitmap(file='test1.png')
plot(mysum$resid, type='b', pch=19, main='Residuals', ylab='value of Residuals', xlab='time or index')
grid()
dev.off()
bitmap(file='test2.png')
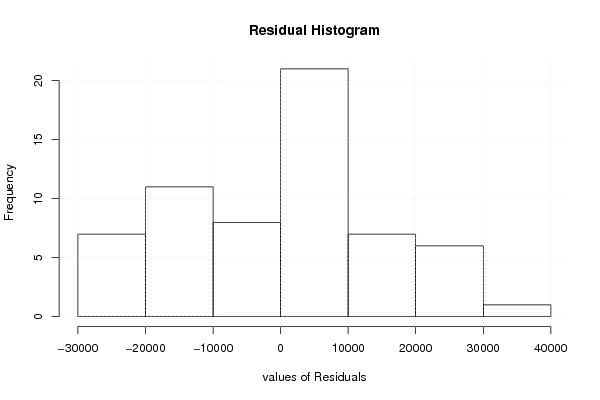
hist(mysum$resid, main='Residual Histogram', xlab='values of Residuals')
grid()
dev.off()
bitmap(file='test3.png')
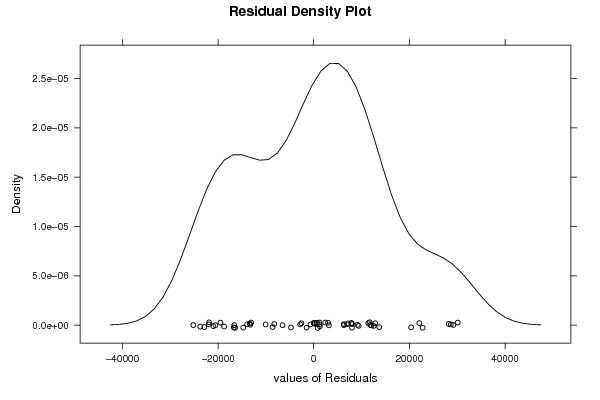
densityplot(~mysum$resid,col='black',main='Residual Density Plot', xlab='values of Residuals')
dev.off()
bitmap(file='test4.png')
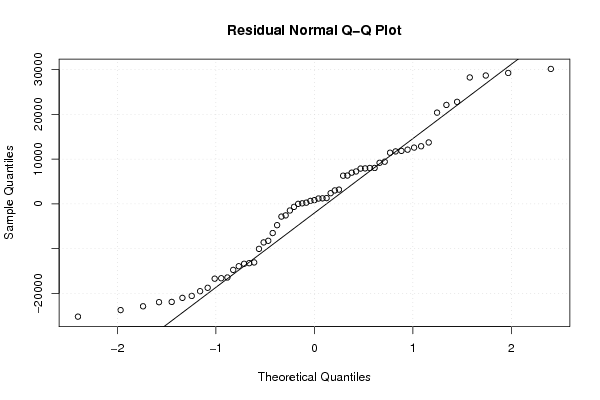
qqnorm(mysum$resid, main='Residual Normal Q-Q Plot')
qqline(mysum$resid)
grid()
dev.off()
(myerror <- as.ts(mysum$resid))
bitmap(file='test5.png')
dum <- cbind(lag(myerror,k=1),myerror)
dum
dum1 <- dum[2:length(myerror),]
dum1
z <- as.data.frame(dum1)
z
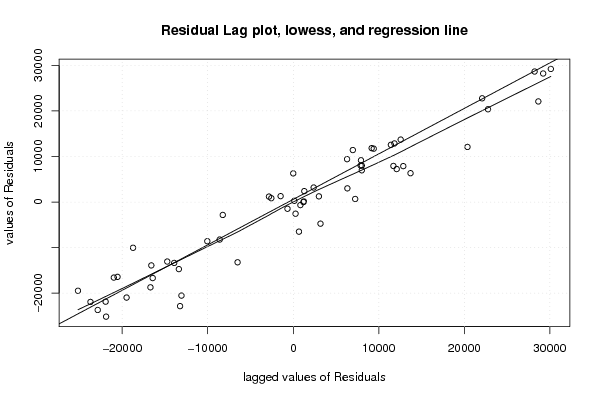
plot(z,main=paste('Residual Lag plot, lowess, and regression line'), ylab='values of Residuals', xlab='lagged values of Residuals')
lines(lowess(z))
abline(lm(z))
grid()
dev.off()
bitmap(file='test6.png')
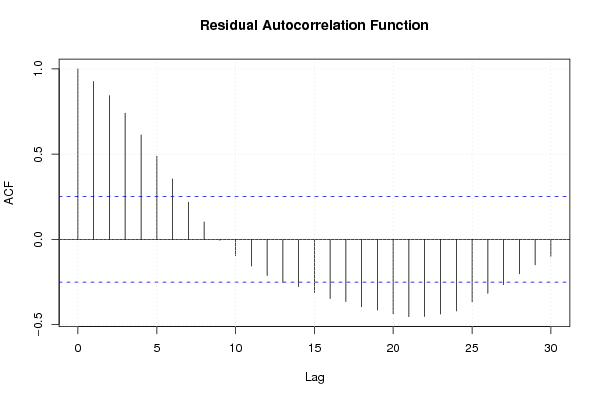
acf(mysum$resid, lag.max=length(mysum$resid)/2, main='Residual Autocorrelation Function')
grid()
dev.off()
bitmap(file='test7.png')
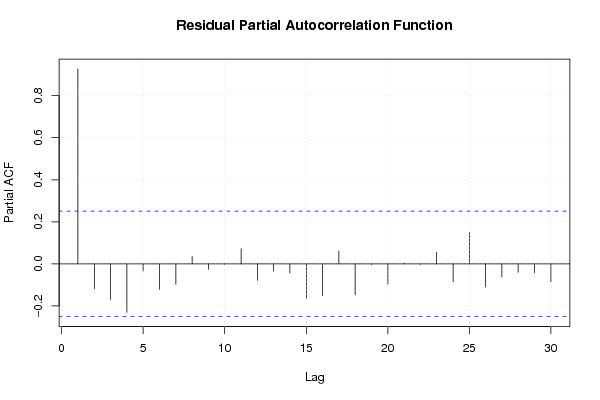
pacf(mysum$resid, lag.max=length(mysum$resid)/2, main='Residual Partial Autocorrelation Function')
grid()
dev.off()
bitmap(file='test8.png')
opar <- par(mfrow = c(2,2), oma = c(0, 0, 1.1, 0))
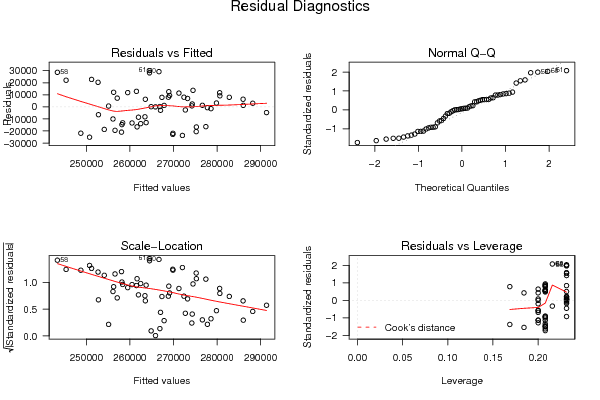
plot(mylm, las = 1, sub='Residual Diagnostics')
par(opar)
dev.off()
if (n > n25) {
bitmap(file='test9.png')
plot(kp3:nmkm3,gqarr[,2], main='Goldfeld-Quandt test',ylab='2-sided p-value',xlab='breakpoint')
grid()
dev.off()
}
load(file='createtable')
a<-table.start()
a<-table.row.start(a)
a<-table.element(a, 'Multiple Linear Regression - Estimated Regression Equation', 1, TRUE)
a<-table.row.end(a)
myeq <- colnames(x)[1]
myeq <- paste(myeq, '[t] = ', sep='')
for (i in 1:k){
if (mysum$coefficients[i,1] > 0) myeq <- paste(myeq, '+', '')
myeq <- paste(myeq, mysum$coefficients[i,1], sep=' ')
if (rownames(mysum$coefficients)[i] != '(Intercept)') {
myeq <- paste(myeq, rownames(mysum$coefficients)[i], sep='')
if (rownames(mysum$coefficients)[i] != 't') myeq <- paste(myeq, '[t]', sep='')
}
}
myeq <- paste(myeq, ' + e[t]')
a<-table.row.start(a)
a<-table.element(a, myeq)
a<-table.row.end(a)
a<-table.end(a)
table.save(a,file='mytable1.tab')
a<-table.start()
a<-table.row.start(a)
a<-table.element(a,hyperlink('ols1.htm','Multiple Linear Regression - Ordinary Least Squares',''), 6, TRUE)
a<-table.row.end(a)
a<-table.row.start(a)
a<-table.element(a,'Variable',header=TRUE)
a<-table.element(a,'Parameter',header=TRUE)
a<-table.element(a,'S.D.',header=TRUE)
a<-table.element(a,'T-STAT
H0: parameter = 0',header=TRUE)
a<-table.element(a,'2-tail p-value',header=TRUE)
a<-table.element(a,'1-tail p-value',header=TRUE)
a<-table.row.end(a)
for (i in 1:k){
a<-table.row.start(a)
a<-table.element(a,rownames(mysum$coefficients)[i],header=TRUE)
a<-table.element(a,mysum$coefficients[i,1])
a<-table.element(a, round(mysum$coefficients[i,2],6))
a<-table.element(a, round(mysum$coefficients[i,3],4))
a<-table.element(a, round(mysum$coefficients[i,4],6))
a<-table.element(a, round(mysum$coefficients[i,4]/2,6))
a<-table.row.end(a)
}
a<-table.end(a)
table.save(a,file='mytable2.tab')
a<-table.start()
a<-table.row.start(a)
a<-table.element(a, 'Multiple Linear Regression - Regression Statistics', 2, TRUE)
a<-table.row.end(a)
a<-table.row.start(a)
a<-table.element(a, 'Multiple R',1,TRUE)
a<-table.element(a, sqrt(mysum$r.squared))
a<-table.row.end(a)
a<-table.row.start(a)
a<-table.element(a, 'R-squared',1,TRUE)
a<-table.element(a, mysum$r.squared)
a<-table.row.end(a)
a<-table.row.start(a)
a<-table.element(a, 'Adjusted R-squared',1,TRUE)
a<-table.element(a, mysum$adj.r.squared)
a<-table.row.end(a)
a<-table.row.start(a)
a<-table.element(a, 'F-TEST (value)',1,TRUE)
a<-table.element(a, mysum$fstatistic[1])
a<-table.row.end(a)
a<-table.row.start(a)
a<-table.element(a, 'F-TEST (DF numerator)',1,TRUE)
a<-table.element(a, mysum$fstatistic[2])
a<-table.row.end(a)
a<-table.row.start(a)
a<-table.element(a, 'F-TEST (DF denominator)',1,TRUE)
a<-table.element(a, mysum$fstatistic[3])
a<-table.row.end(a)
a<-table.row.start(a)
a<-table.element(a, 'p-value',1,TRUE)
a<-table.element(a, 1-pf(mysum$fstatistic[1],mysum$fstatistic[2],mysum$fstatistic[3]))
a<-table.row.end(a)
a<-table.row.start(a)
a<-table.element(a, 'Multiple Linear Regression - Residual Statistics', 2, TRUE)
a<-table.row.end(a)
a<-table.row.start(a)
a<-table.element(a, 'Residual Standard Deviation',1,TRUE)
a<-table.element(a, mysum$sigma)
a<-table.row.end(a)
a<-table.row.start(a)
a<-table.element(a, 'Sum Squared Residuals',1,TRUE)
a<-table.element(a, sum(myerror*myerror))
a<-table.row.end(a)
a<-table.end(a)
table.save(a,file='mytable3.tab')
a<-table.start()
a<-table.row.start(a)
a<-table.element(a, 'Multiple Linear Regression - Actuals, Interpolation, and Residuals', 4, TRUE)
a<-table.row.end(a)
a<-table.row.start(a)
a<-table.element(a, 'Time or Index', 1, TRUE)
a<-table.element(a, 'Actuals', 1, TRUE)
a<-table.element(a, 'Interpolation
Forecast', 1, TRUE)
a<-table.element(a, 'Residuals
Prediction Error', 1, TRUE)
a<-table.row.end(a)
for (i in 1:n) {
a<-table.row.start(a)
a<-table.element(a,i, 1, TRUE)
a<-table.element(a,x[i])
a<-table.element(a,x[i]-mysum$resid[i])
a<-table.element(a,mysum$resid[i])
a<-table.row.end(a)
}
a<-table.end(a)
table.save(a,file='mytable4.tab')
if (n > n25) {
a<-table.start()
a<-table.row.start(a)
a<-table.element(a,'Goldfeld-Quandt test for Heteroskedasticity',4,TRUE)
a<-table.row.end(a)
a<-table.row.start(a)
a<-table.element(a,'p-values',header=TRUE)
a<-table.element(a,'Alternative Hypothesis',3,header=TRUE)
a<-table.row.end(a)
a<-table.row.start(a)
a<-table.element(a,'breakpoint index',header=TRUE)
a<-table.element(a,'greater',header=TRUE)
a<-table.element(a,'2-sided',header=TRUE)
a<-table.element(a,'less',header=TRUE)
a<-table.row.end(a)
for (mypoint in kp3:nmkm3) {
a<-table.row.start(a)
a<-table.element(a,mypoint,header=TRUE)
a<-table.element(a,gqarr[mypoint-kp3+1,1])
a<-table.element(a,gqarr[mypoint-kp3+1,2])
a<-table.element(a,gqarr[mypoint-kp3+1,3])
a<-table.row.end(a)
}
a<-table.end(a)
table.save(a,file='mytable5.tab')
a<-table.start()
a<-table.row.start(a)
a<-table.element(a,'Meta Analysis of Goldfeld-Quandt test for Heteroskedasticity',4,TRUE)
a<-table.row.end(a)
a<-table.row.start(a)
a<-table.element(a,'Description',header=TRUE)
a<-table.element(a,'# significant tests',header=TRUE)
a<-table.element(a,'% significant tests',header=TRUE)
a<-table.element(a,'OK/NOK',header=TRUE)
a<-table.row.end(a)
a<-table.row.start(a)
a<-table.element(a,'1% type I error level',header=TRUE)
a<-table.element(a,numsignificant1)
a<-table.element(a,numsignificant1/numgqtests)
if (numsignificant1/numgqtests < 0.01) dum <- 'OK' else dum <- 'NOK'
a<-table.element(a,dum)
a<-table.row.end(a)
a<-table.row.start(a)
a<-table.element(a,'5% type I error level',header=TRUE)
a<-table.element(a,numsignificant5)
a<-table.element(a,numsignificant5/numgqtests)
if (numsignificant5/numgqtests < 0.05) dum <- 'OK' else dum <- 'NOK'
a<-table.element(a,dum)
a<-table.row.end(a)
a<-table.row.start(a)
a<-table.element(a,'10% type I error level',header=TRUE)
a<-table.element(a,numsignificant10)
a<-table.element(a,numsignificant10/numgqtests)
if (numsignificant10/numgqtests < 0.1) dum <- 'OK' else dum <- 'NOK'
a<-table.element(a,dum)
a<-table.row.end(a)
a<-table.end(a)
table.save(a,file='mytable6.tab')
}