| Multiple Linear Regression - Estimated Regression Equation |
| births[t] = + 6947.20633706813 + 173.236282358347difference[t] + 0.258154051655289Y1[t] -873.773242778912M1[t] + 313.821678685072M2[t] -315.452804436626M3[t] -44.9190632971903M4[t] -141.316615424233M5[t] + 439.945673352842M6[t] + 164.362142445581M7[t] -33.1643734665533M8[t] + 95.9311315482093M9[t] -680.3389636175M10[t] -73.9005296879053M11[t] + 5.43525886352773t + e[t] |
| Multiple Linear Regression - Ordinary Least Squares | |||||
| Variable | Parameter | S.D. | T-STAT H0: parameter = 0 | 2-tail p-value | 1-tail p-value |
| (Intercept) | 6947.20633706813 | 1183.325377 | 5.8709 | 0 | 0 |
| difference | 173.236282358347 | 141.073038 | 1.228 | 0.224587 | 0.112294 |
| Y1 | 0.258154051655289 | 0.128651 | 2.0066 | 0.049627 | 0.024813 |
| M1 | -873.773242778912 | 171.461961 | -5.096 | 4e-06 | 2e-06 |
| M2 | 313.821678685072 | 187.869952 | 1.6704 | 0.100417 | 0.050209 |
| M3 | -315.452804436626 | 173.39924 | -1.8192 | 0.074224 | 0.037112 |
| M4 | -44.9190632971903 | 168.882586 | -0.266 | 0.791233 | 0.395616 |
| M5 | -141.316615424233 | 169.356938 | -0.8344 | 0.407584 | 0.203792 |
| M6 | 439.945673352842 | 169.159421 | 2.6008 | 0.011875 | 0.005937 |
| M7 | 164.362142445581 | 187.271435 | 0.8777 | 0.383874 | 0.191937 |
| M8 | -33.1643734665533 | 181.133234 | -0.1831 | 0.855386 | 0.427693 |
| M9 | 95.9311315482093 | 173.380351 | 0.5533 | 0.582261 | 0.291131 |
| M10 | -680.3389636175 | 175.816228 | -3.8696 | 0.000287 | 0.000143 |
| M11 | -73.9005296879053 | 179.593853 | -0.4115 | 0.682286 | 0.341143 |
| t | 5.43525886352773 | 3.508735 | 1.5491 | 0.127 | 0.0635 |
| Multiple Linear Regression - Regression Statistics | |
| Multiple R | 0.872427654180786 |
| R-squared | 0.76113001177939 |
| Adjusted R-squared | 0.701412514724237 |
| F-TEST (value) | 12.7455109358726 |
| F-TEST (DF numerator) | 14 |
| F-TEST (DF denominator) | 56 |
| p-value | 1.08324460512677e-12 |
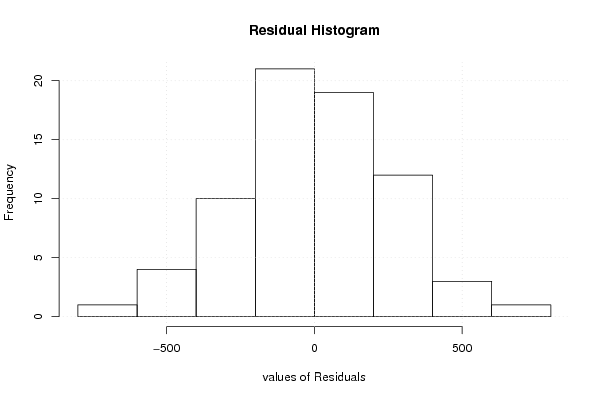
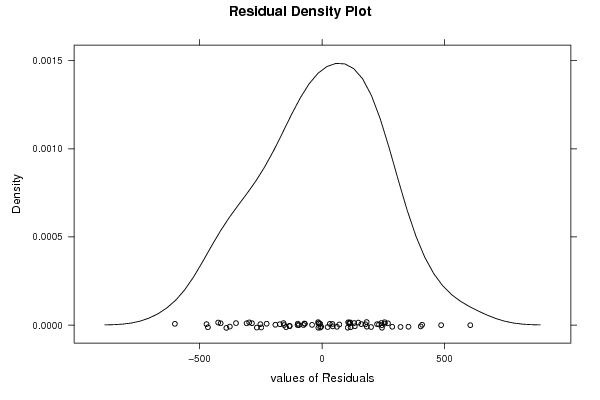
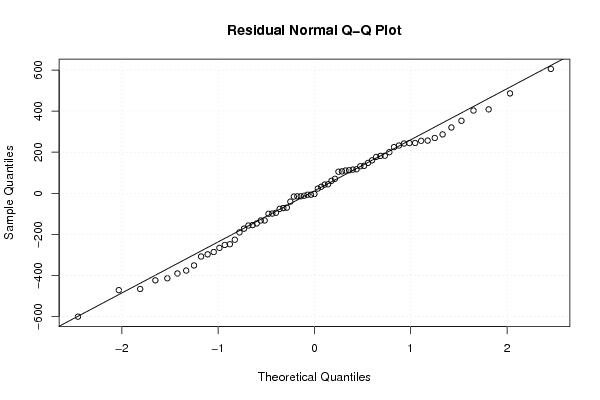
| Multiple Linear Regression - Residual Statistics | |
| Residual Standard Deviation | 278.193377872033 |
| Sum Squared Residuals | 4333927.10754370 |
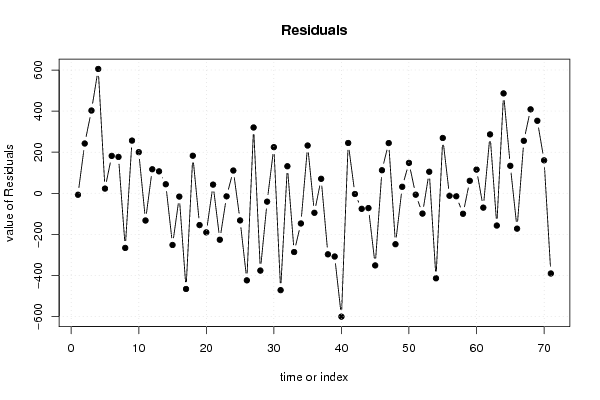
| Multiple Linear Regression - Actuals, Interpolation, and Residuals | |||
| Time or Index | Actuals | Interpolation Forecast | Residuals Prediction Error |
| 1 | 8587 | 8594.0632784302 | -7.06327843019715 |
| 2 | 9731 | 9488.66737504422 | 242.332624955782 |
| 3 | 9563 | 9160.1563858797 | 402.843614120302 |
| 4 | 9998 | 9392.75550520457 | 605.244494795426 |
| 5 | 9437 | 9414.0902244111 | 22.909775588891 |
| 6 | 10038 | 9855.9633490731 | 182.036650926906 |
| 7 | 9918 | 9740.96566207419 | 177.03433792581 |
| 8 | 9252 | 9517.89591882695 | -265.895918826949 |
| 9 | 9737 | 9480.49608430282 | 256.503915697183 |
| 10 | 9035 | 8834.86596305345 | 200.134036946549 |
| 11 | 9133 | 9265.51551158456 | -132.515511584560 |
| 12 | 9487 | 9370.15039719821 | 116.849602801789 |
| 13 | 8700 | 8593.1989475688 | 106.801052431202 |
| 14 | 9627 | 9583.0618892436 | 43.9381107564011 |
| 15 | 8947 | 9198.53147086988 | -251.531470869882 |
| 16 | 9283 | 9298.95571574725 | -15.955715747248 |
| 17 | 8829 | 9294.73318383991 | -465.73318383991 |
| 18 | 9947 | 9764.2287920290 | 182.771207970988 |
| 19 | 9628 | 9782.6967497359 | -154.696749735891 |
| 20 | 9318 | 9508.25435020925 | -190.254350209248 |
| 21 | 9605 | 9562.7573580744 | 42.2426419256015 |
| 22 | 8640 | 8866.01273459729 | -226.012734597285 |
| 23 | 9214 | 9228.76776754305 | -14.7677675430531 |
| 24 | 9567 | 9456.28398174462 | 110.716018255378 |
| 25 | 8547 | 8679.07437806355 | -132.074378063555 |
| 26 | 9185 | 9608.78742570267 | -423.787425702672 |
| 27 | 9470 | 9149.65048640058 | 320.349513599423 |
| 28 | 9123 | 9499.1933911253 | -376.193391125297 |
| 29 | 9278 | 9318.6516419374 | -40.6516419373967 |
| 30 | 10170 | 9945.36306758457 | 224.636932415431 |
| 31 | 9434 | 9905.48820961735 | -471.488209617353 |
| 32 | 9655 | 9523.39557055045 | 131.604429449546 |
| 33 | 9429 | 9714.97837984456 | -285.978379844564 |
| 34 | 8739 | 8885.80072786829 | -146.800727868287 |
| 35 | 9552 | 9319.54812501926 | 232.451874980740 |
| 36 | 9687 | 9781.99943992479 | -94.9994399247896 |
| 37 | 9019 | 8948.51225298287 | 70.4877470171306 |
| 38 | 9672 | 9969.09552680465 | -297.095526804649 |
| 39 | 9206 | 9513.83089827738 | -307.830898277383 |
| 40 | 9069 | 9669.50011020898 | -600.50011020898 |
| 41 | 9788 | 9543.17071186869 | 244.829288131309 |
| 42 | 10312 | 10315.4810226494 | -3.48102264944673 |
| 43 | 10105 | 10180.6054736731 | -75.6054736730843 |
| 44 | 9863 | 9935.07632793183 | -72.076327931833 |
| 45 | 9656 | 10007.1338113095 | -351.133811309543 |
| 46 | 9295 | 9182.86108631472 | 112.138913685282 |
| 47 | 9946 | 9701.54116646028 | 244.45883353972 |
| 48 | 9701 | 9948.9352426393 | -247.935242639306 |
| 49 | 9049 | 9017.34951606838 | 31.6504839316238 |
| 50 | 10190 | 10042.0632547166 | 147.93674528336 |
| 51 | 9706 | 9712.77780339716 | -6.77780339715467 |
| 52 | 9765 | 9863.80024239896 | -98.8002423989576 |
| 53 | 9893 | 9788.0690381831 | 104.930961816895 |
| 54 | 9994 | 10407.8103044356 | -413.810304435585 |
| 55 | 10433 | 10163.7355916090 | 269.264408390965 |
| 56 | 10073 | 10084.9739632371 | -11.9739632371005 |
| 57 | 10112 | 10126.5692685195 | -14.5692685194869 |
| 58 | 9266 | 9365.80244023186 | -99.8024402318617 |
| 59 | 9820 | 9759.2778053246 | 60.7221946753907 |
| 60 | 10097 | 9981.63093849307 | 115.369061506928 |
| 61 | 9115 | 9184.8016268862 | -69.8016268862032 |
| 62 | 10411 | 10124.3245284882 | 286.675471511778 |
| 63 | 9678 | 9835.0529551753 | -157.052955175306 |
| 64 | 10408 | 9921.79503531494 | 486.204964685058 |
| 65 | 10153 | 10019.2851997598 | 133.714800240212 |
| 66 | 10368 | 10540.1534642283 | -172.153464228293 |
| 67 | 10581 | 10325.5083132904 | 255.491686709554 |
| 68 | 10597 | 10188.4038692444 | 408.596130755584 |
| 69 | 10680 | 10327.0650979492 | 352.934902050809 |
| 70 | 9738 | 9577.6570479344 | 160.342952065601 |
| 71 | 9556 | 9946.34962406824 | -390.349624068238 |
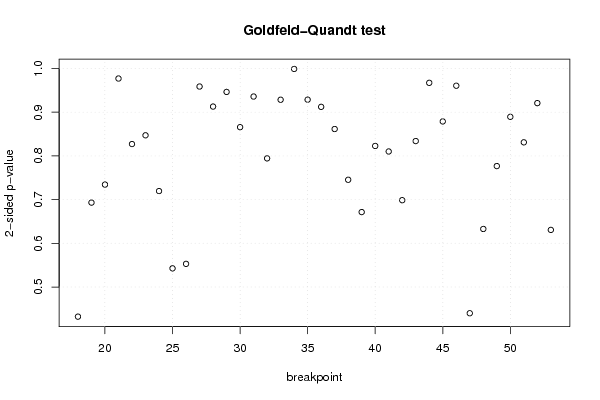
| Goldfeld-Quandt test for Heteroskedasticity | |||
| p-values | Alternative Hypothesis | ||
| breakpoint index | greater | 2-sided | less |
| 18 | 0.783911325223041 | 0.432177349553918 | 0.216088674776959 |
| 19 | 0.653444255151926 | 0.693111489696149 | 0.346555744848074 |
| 20 | 0.632834847657737 | 0.734330304684525 | 0.367165152342263 |
| 21 | 0.51151932448441 | 0.97696135103118 | 0.48848067551559 |
| 22 | 0.413539200541369 | 0.827078401082737 | 0.586460799458631 |
| 23 | 0.423534582835073 | 0.847069165670146 | 0.576465417164927 |
| 24 | 0.359766653577378 | 0.719533307154756 | 0.640233346422622 |
| 25 | 0.271347952874445 | 0.54269590574889 | 0.728652047125555 |
| 26 | 0.276462359933734 | 0.552924719867469 | 0.723537640066266 |
| 27 | 0.479308208006073 | 0.958616416012145 | 0.520691791993927 |
| 28 | 0.456396370538607 | 0.912792741077213 | 0.543603629461393 |
| 29 | 0.473160779647047 | 0.946321559294093 | 0.526839220352953 |
| 30 | 0.567161367952205 | 0.86567726409559 | 0.432838632047795 |
| 31 | 0.532126891319965 | 0.93574621736007 | 0.467873108680035 |
| 32 | 0.602857996101842 | 0.794284007796317 | 0.397142003898158 |
| 33 | 0.535790519287707 | 0.928418961424585 | 0.464209480712292 |
| 34 | 0.499436145789224 | 0.998872291578449 | 0.500563854210776 |
| 35 | 0.535696875140347 | 0.928606249719307 | 0.464303124859653 |
| 36 | 0.456095691191572 | 0.912191382383145 | 0.543904308808428 |
| 37 | 0.430719431351817 | 0.861438862703634 | 0.569280568648183 |
| 38 | 0.372658347878394 | 0.745316695756788 | 0.627341652121606 |
| 39 | 0.335703744977743 | 0.671407489955485 | 0.664296255022258 |
| 40 | 0.58865916020399 | 0.822681679592021 | 0.411340839796010 |
| 41 | 0.594987551261185 | 0.810024897477631 | 0.405012448738815 |
| 42 | 0.650687232836624 | 0.698625534326752 | 0.349312767163376 |
| 43 | 0.583050764522214 | 0.833898470955571 | 0.416949235477786 |
| 44 | 0.516438623917899 | 0.967122752164203 | 0.483561376082101 |
| 45 | 0.56059966125744 | 0.87880067748512 | 0.43940033874256 |
| 46 | 0.480248767911185 | 0.96049753582237 | 0.519751232088815 |
| 47 | 0.779995353867149 | 0.440009292265703 | 0.220004646132851 |
| 48 | 0.683603864608243 | 0.632792270783514 | 0.316396135391757 |
| 49 | 0.611655056699373 | 0.776689886601254 | 0.388344943300627 |
| 50 | 0.555335907067507 | 0.889328185864987 | 0.444664092932493 |
| 51 | 0.584492940876188 | 0.831014118247623 | 0.415507059123812 |
| 52 | 0.460344974872109 | 0.920689949744218 | 0.539655025127891 |
| 53 | 0.31531753218212 | 0.63063506436424 | 0.68468246781788 |
| Meta Analysis of Goldfeld-Quandt test for Heteroskedasticity | |||
| Description | # significant tests | % significant tests | OK/NOK |
| 1% type I error level | 0 | 0 | OK |
| 5% type I error level | 0 | 0 | OK |
| 10% type I error level | 0 | 0 | OK |