| Multiple Linear Regression - Estimated Regression Equation |
| Log_PS[t] = + 1.07450734071795 -0.110510499899245D[t] -0.303538868542366Log_tg[t] + e[t] |
| Multiple Linear Regression - Ordinary Least Squares | |||||
| Variable | Parameter | S.D. | T-STAT H0: parameter = 0 | 2-tail p-value | 1-tail p-value |
| (Intercept) | 1.07450734071795 | 0.128751 | 8.3456 | 0 | 0 |
| D | -0.110510499899245 | 0.022191 | -4.98 | 1.6e-05 | 8e-06 |
| Log_tg | -0.303538868542366 | 0.068904 | -4.4053 | 9.1e-05 | 4.5e-05 |
| Multiple Linear Regression - Regression Statistics | |
| Multiple R | 0.809091683127883 |
| R-squared | 0.654629351706711 |
| Adjusted R-squared | 0.635442093468194 |
| F-TEST (value) | 34.1179205266869 |
| F-TEST (DF numerator) | 2 |
| F-TEST (DF denominator) | 36 |
| p-value | 4.88807283538506e-09 |
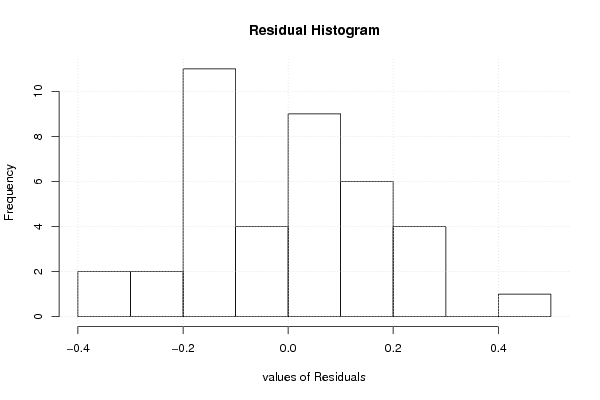
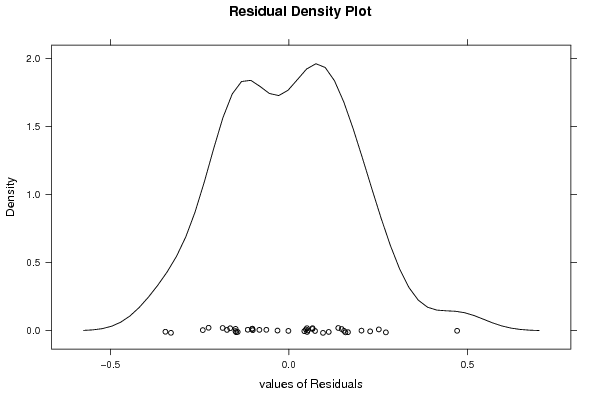
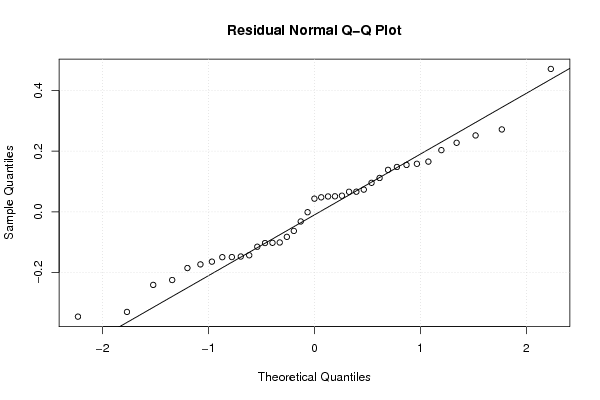
| Multiple Linear Regression - Residual Statistics | |
| Residual Standard Deviation | 0.181764010742274 |
| Sum Squared Residuals | 1.18937360164024 |
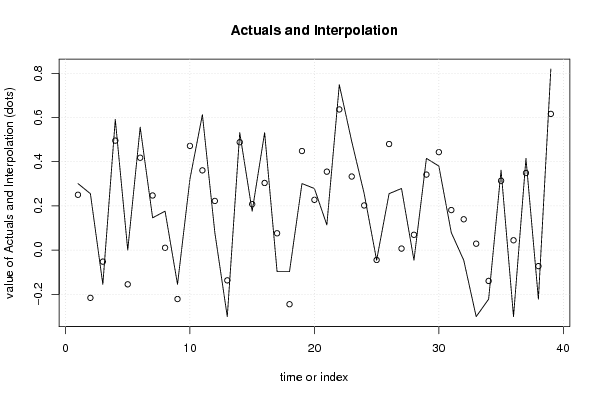
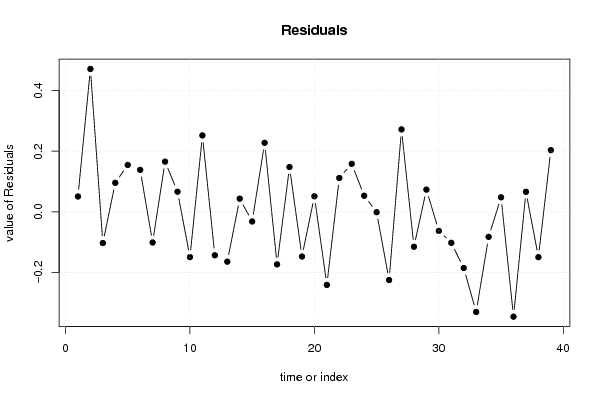
| Multiple Linear Regression - Actuals, Interpolation, and Residuals | |||
| Time or Index | Actuals | Interpolation Forecast | Residuals Prediction Error |
| 1 | 0.301029996 | 0.25025658817142 | 0.0507734078285805 |
| 2 | 0.255272505 | -0.215981826694683 | 0.471254331694683 |
| 3 | -0.15490196 | -0.0520975233014339 | -0.102804436698566 |
| 4 | 0.591064607 | 0.495312173790523 | 0.0957524332094768 |
| 5 | 0 | -0.154697777462889 | 0.154697777462889 |
| 6 | 0.556302501 | 0.417827046452848 | 0.138475454547152 |
| 7 | 0.146128036 | 0.247120645674257 | -0.100992609674257 |
| 8 | 0.176091259 | 0.0104480210229294 | 0.165643237977071 |
| 9 | -0.15490196 | -0.221322704543612 | 0.0664207445436118 |
| 10 | 0.322219295 | 0.471277587969908 | -0.149058292969908 |
| 11 | 0.612783857 | 0.360767088070664 | 0.252016768929336 |
| 12 | 0.079181246 | 0.222374018014116 | -0.143192772014116 |
| 13 | -0.301029996 | -0.136803944190186 | -0.164226051809814 |
| 14 | 0.531478917 | 0.48798912369039 | 0.0434897933096105 |
| 15 | 0.176091259 | 0.207771731092155 | -0.0316804720921555 |
| 16 | 0.531478917 | 0.30370712968848 | 0.22777178731152 |
| 17 | -0.096910013 | 0.0762276590751524 | -0.173137672075152 |
| 18 | -0.096910013 | -0.24488732447299 | 0.14797731147299 |
| 19 | 0.301029996 | 0.448293408117128 | -0.147263412117128 |
| 20 | 0.278753601 | 0.227456358149458 | 0.051297242850542 |
| 21 | 0.113943352 | 0.354824419828202 | -0.240881067828202 |
| 22 | 0.748188027 | 0.636423386455726 | 0.111764640544274 |
| 23 | 0.491361694 | 0.332884517913361 | 0.158477176086639 |
| 24 | 0.255272505 | 0.202053065124973 | 0.0532194398750271 |
| 25 | -0.045757491 | -0.0445626007009075 | -0.00119489029909253 |
| 26 | 0.255272505 | 0.479997267639947 | -0.224724762639947 |
| 27 | 0.278753601 | 0.006963450359676 | 0.271790150640324 |
| 28 | -0.045757491 | 0.0692686000375423 | -0.115026091037542 |
| 29 | 0.414973348 | 0.341630892251033 | 0.073342455748967 |
| 30 | 0.380211242 | 0.443123127366031 | -0.062911885366031 |
| 31 | 0.079181246 | 0.181195145299523 | -0.102013899299523 |
| 32 | -0.045757491 | 0.13950752080061 | -0.18526501180061 |
| 33 | -0.301029996 | 0.0289970209013649 | -0.330027016901365 |
| 34 | -0.22184875 | -0.13944935585055 | -0.0823993941494498 |
| 35 | 0.361727836 | 0.313748322397269 | 0.047979513602731 |
| 36 | -0.301029996 | 0.0445237995523334 | -0.345553795552333 |
| 37 | 0.414973348 | 0.348774709934225 | 0.0661986380657748 |
| 38 | -0.22184875 | -0.0724184761905773 | -0.149430273809423 |
| 39 | 0.819543936 | 0.616102433566583 | 0.203441502433417 |
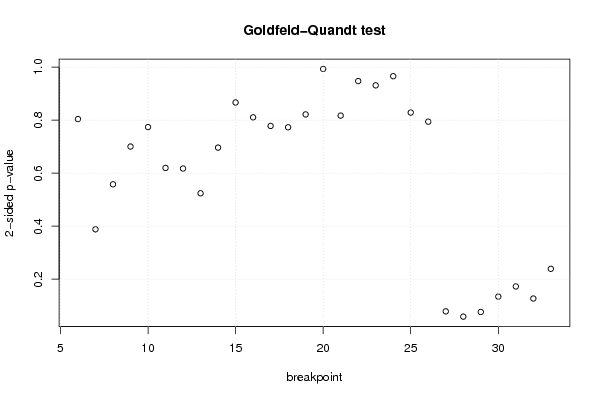
| Goldfeld-Quandt test for Heteroskedasticity | |||
| p-values | Alternative Hypothesis | ||
| breakpoint index | greater | 2-sided | less |
| 6 | 0.597928969196273 | 0.804142061607455 | 0.402071030803727 |
| 7 | 0.80581497678414 | 0.388370046431719 | 0.194185023215859 |
| 8 | 0.720981817820847 | 0.558036364358306 | 0.279018182179153 |
| 9 | 0.649764791941819 | 0.700470416116362 | 0.350235208058181 |
| 10 | 0.613004804262045 | 0.77399039147591 | 0.386995195737955 |
| 11 | 0.690107187267012 | 0.619785625465977 | 0.309892812732988 |
| 12 | 0.691199655254988 | 0.617600689490024 | 0.308800344745012 |
| 13 | 0.737898423302203 | 0.524203153395593 | 0.262101576697796 |
| 14 | 0.65177309562817 | 0.69645380874366 | 0.34822690437183 |
| 15 | 0.5666429741455 | 0.866714051709 | 0.4333570258545 |
| 16 | 0.594689071709139 | 0.810621856581722 | 0.405310928290861 |
| 17 | 0.610880145271227 | 0.778239709457545 | 0.389119854728773 |
| 18 | 0.613441083269618 | 0.773117833460764 | 0.386558916730382 |
| 19 | 0.589205363827822 | 0.821589272344356 | 0.410794636172178 |
| 20 | 0.503427822592435 | 0.99314435481513 | 0.496572177407565 |
| 21 | 0.591400029969701 | 0.817199940060597 | 0.408599970030299 |
| 22 | 0.526280887052885 | 0.94743822589423 | 0.473719112947115 |
| 23 | 0.534351613860744 | 0.931296772278511 | 0.465648386139256 |
| 24 | 0.482913739179434 | 0.965827478358867 | 0.517086260820566 |
| 25 | 0.414301127629767 | 0.828602255259534 | 0.585698872370233 |
| 26 | 0.602854839087056 | 0.794290321825888 | 0.397145160912944 |
| 27 | 0.960558244299837 | 0.0788835114003268 | 0.0394417557001634 |
| 28 | 0.970552683638618 | 0.0588946327227642 | 0.0294473163613821 |
| 29 | 0.961721815384085 | 0.0765563692318299 | 0.0382781846159149 |
| 30 | 0.932745485385787 | 0.134509029228427 | 0.0672545146142134 |
| 31 | 0.91360527378361 | 0.172789452432781 | 0.0863947262163907 |
| 32 | 0.936353641212515 | 0.127292717574969 | 0.0636463587874847 |
| 33 | 0.880356993342365 | 0.23928601331527 | 0.119643006657635 |
| Meta Analysis of Goldfeld-Quandt test for Heteroskedasticity | |||
| Description | # significant tests | % significant tests | OK/NOK |
| 1% type I error level | 0 | 0 | OK |
| 5% type I error level | 0 | 0 | OK |
| 10% type I error level | 3 | 0.107142857142857 | NOK |