| Multiple Linear Regression - Estimated Regression Equation |
| births[t] = + 4290.89132456752 + 131.651523693341difference[t] + 0.108196703969025Y1[t] + 0.154343076203814Y2[t] + 0.237959866862384Y3[t] + 0.0510733953878393Y4[t] -770.958525039385M1[t] + 176.625479263266M2[t] -253.792403401782M3[t] + 9.40421424853412M4[t] -185.287572708533M5[t] + 403.52059922142M6[t] + 199.734827907282M7[t] -101.130816660665M8[t] -119.148713516400M9[t] -847.616376220034M10[t] -304.047680579611M11[t] + 3.22629603458473t + e[t] |
| Multiple Linear Regression - Ordinary Least Squares | |||||
| Variable | Parameter | S.D. | T-STAT H0: parameter = 0 | 2-tail p-value | 1-tail p-value |
| (Intercept) | 4290.89132456752 | 1655.215049 | 2.5923 | 0.012292 | 0.006146 |
| difference | 131.651523693341 | 139.159386 | 0.946 | 0.348417 | 0.174209 |
| Y1 | 0.108196703969025 | 0.14475 | 0.7475 | 0.458083 | 0.229041 |
| Y2 | 0.154343076203814 | 0.136943 | 1.1271 | 0.264794 | 0.132397 |
| Y3 | 0.237959866862384 | 0.137245 | 1.7338 | 0.088762 | 0.044381 |
| Y4 | 0.0510733953878393 | 0.146009 | 0.3498 | 0.727877 | 0.363939 |
| M1 | -770.958525039385 | 209.514566 | -3.6797 | 0.000547 | 0.000274 |
| M2 | 176.625479263266 | 236.030242 | 0.7483 | 0.457577 | 0.228788 |
| M3 | -253.792403401782 | 174.216279 | -1.4568 | 0.15108 | 0.07554 |
| M4 | 9.40421424853412 | 240.16382 | 0.0392 | 0.968912 | 0.484456 |
| M5 | -185.287572708533 | 219.4378 | -0.8444 | 0.402256 | 0.201128 |
| M6 | 403.52059922142 | 191.718751 | 2.1048 | 0.040071 | 0.020035 |
| M7 | 199.734827907282 | 210.27704 | 0.9499 | 0.346492 | 0.173246 |
| M8 | -101.130816660665 | 238.135869 | -0.4247 | 0.672791 | 0.336396 |
| M9 | -119.148713516400 | 218.23283 | -0.546 | 0.587377 | 0.293689 |
| M10 | -847.616376220034 | 196.396946 | -4.3158 | 7e-05 | 3.5e-05 |
| M11 | -304.047680579611 | 222.053505 | -1.3693 | 0.176694 | 0.088347 |
| t | 3.22629603458473 | 3.551075 | 0.9085 | 0.367706 | 0.183853 |
| Multiple Linear Regression - Regression Statistics | |
| Multiple R | 0.885845071872243 |
| R-squared | 0.784721491360339 |
| Adjusted R-squared | 0.715669894249504 |
| F-TEST (value) | 11.3642772099939 |
| F-TEST (DF numerator) | 17 |
| F-TEST (DF denominator) | 53 |
| p-value | 3.73157060806761e-12 |
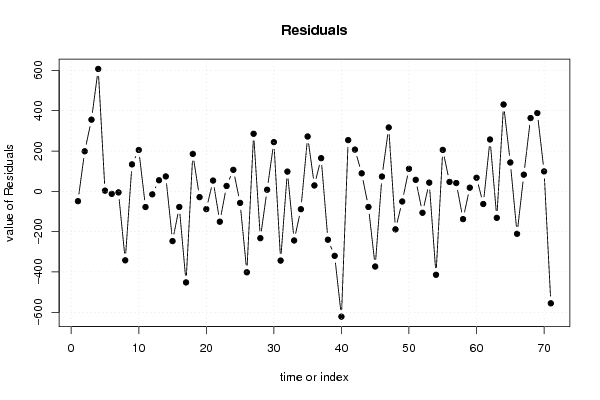
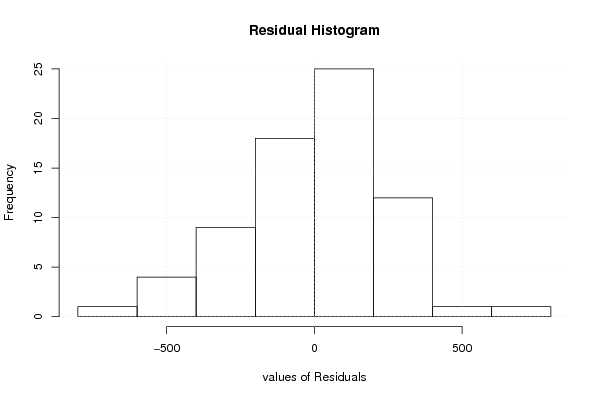
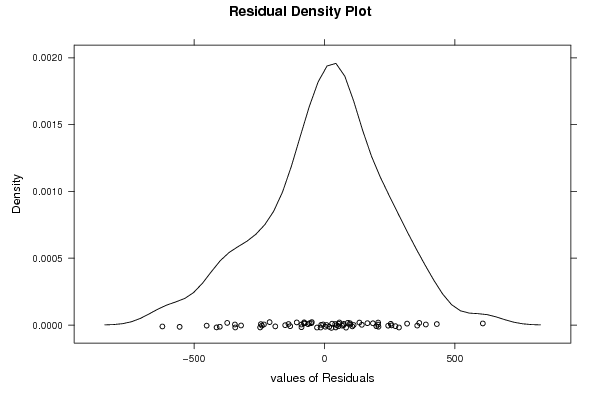
| Multiple Linear Regression - Residual Statistics | |
| Residual Standard Deviation | 271.470354791428 |
| Sum Squared Residuals | 3905896.13712095 |
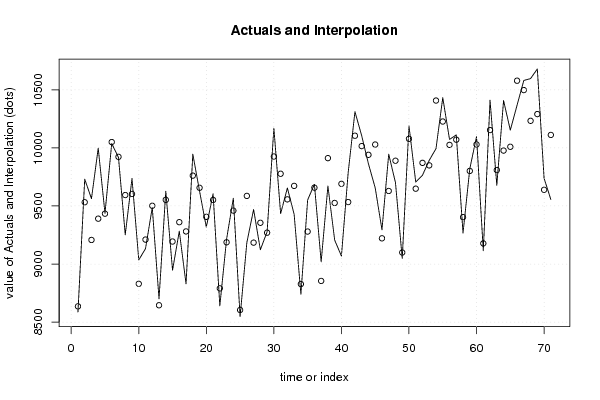
| Multiple Linear Regression - Actuals, Interpolation, and Residuals | |||
| Time or Index | Actuals | Interpolation Forecast | Residuals Prediction Error |
| 1 | 8587 | 8635.69757280774 | -48.6975728077437 |
| 2 | 9731 | 9532.2440184306 | 198.755981569396 |
| 3 | 9563 | 9207.37763749757 | 355.622362502429 |
| 4 | 9998 | 9390.7677455605 | 607.232254439491 |
| 5 | 9437 | 9433.62342668454 | 3.37657331546353 |
| 6 | 10038 | 10050.5494885619 | -12.5494885619189 |
| 7 | 9918 | 9923.36197827739 | -5.36197827738936 |
| 8 | 9252 | 9594.22065575015 | -342.220655750149 |
| 9 | 9737 | 9603.21058611289 | 133.789413887114 |
| 10 | 9035 | 8829.79205872168 | 205.207941278322 |
| 11 | 9133 | 9210.8792773924 | -77.8792773923923 |
| 12 | 9487 | 9501.80334560043 | -14.8033456004296 |
| 13 | 8700 | 8645.22114149435 | 54.7788585056529 |
| 14 | 9627 | 9552.98462817436 | 74.0153718256399 |
| 15 | 8947 | 9193.86637076807 | -246.866370768074 |
| 16 | 9283 | 9360.59712414157 | -77.597124141572 |
| 17 | 8829 | 9280.92646834529 | -451.926468345289 |
| 18 | 9947 | 9761.23123437048 | 185.768765629523 |
| 19 | 9628 | 9656.7885239338 | -28.7885239337919 |
| 20 | 9318 | 9406.31686732497 | -88.3168673249673 |
| 21 | 9605 | 9551.60065661047 | 53.3993433895307 |
| 22 | 8640 | 8790.75624887185 | -150.756248871851 |
| 23 | 9214 | 9187.37791223118 | 26.6220877688152 |
| 24 | 9567 | 9460.2774576062 | 106.722542393806 |
| 25 | 8547 | 8604.35838379756 | -57.3583837975583 |
| 26 | 9185 | 9586.59428901608 | -401.594289016078 |
| 27 | 9470 | 9184.318223745 | 285.681776254997 |
| 28 | 9123 | 9355.35792505138 | -232.357925051385 |
| 29 | 9278 | 9270.05948633234 | 7.94051366765665 |
| 30 | 10170 | 9925.71078428258 | 244.289215717422 |
| 31 | 9434 | 9777.56978963927 | -343.569789639273 |
| 32 | 9655 | 9557.1330021226 | 97.8669978773998 |
| 33 | 9429 | 9672.83294631896 | -243.832946318959 |
| 34 | 8739 | 8827.66795106919 | -88.6679510691908 |
| 35 | 9552 | 9279.92479335465 | 272.075206645353 |
| 36 | 9687 | 9657.82578187818 | 29.1742181218188 |
| 37 | 9019 | 8854.4461333702 | 164.553866629796 |
| 38 | 9672 | 9912.03807968516 | -240.038079685155 |
| 39 | 9206 | 9526.04501831905 | -320.045018319052 |
| 40 | 9069 | 9690.77201402876 | -621.772014028764 |
| 41 | 9788 | 9533.8304660936 | 254.169533906392 |
| 42 | 10312 | 10104.9749920023 | 207.02500799766 |
| 43 | 10105 | 10015.6825573822 | 89.3174426177814 |
| 44 | 9863 | 9940.61835216399 | -77.6183521639874 |
| 45 | 9656 | 10029.1068737279 | -373.106873727889 |
| 46 | 9295 | 9221.62253163864 | 73.3774683613571 |
| 47 | 9946 | 9629.25101578066 | 316.748984219336 |
| 48 | 9701 | 9889.62574204475 | -188.625742044747 |
| 49 | 9049 | 9099.38695839362 | -50.3869583936155 |
| 50 | 10190 | 10078.3133316655 | 111.686668334486 |
| 51 | 9706 | 9648.89111159502 | 57.1088884049797 |
| 52 | 9765 | 9871.38945544317 | -106.389455443170 |
| 53 | 9893 | 9849.81787546932 | 43.1821245306768 |
| 54 | 9994 | 10407.9099316141 | -413.909931614052 |
| 55 | 10433 | 10227.3543459666 | 205.645654033375 |
| 56 | 10073 | 10026.2741944585 | 46.7258055414821 |
| 57 | 10112 | 10070.8597318247 | 41.1402681752623 |
| 58 | 9266 | 9403.89732366386 | -137.897323663865 |
| 59 | 9820 | 9801.93295225783 | 18.0670477421700 |
| 60 | 10097 | 10029.4676728704 | 67.5323271295508 |
| 61 | 9115 | 9177.88981013653 | -62.8898101365311 |
| 62 | 10411 | 10153.8256530283 | 257.174346971711 |
| 63 | 9678 | 9809.50163807528 | -131.501638075280 |
| 64 | 10408 | 9977.1157357746 | 430.884264225401 |
| 65 | 10153 | 10009.7422770749 | 143.257722925100 |
| 66 | 10368 | 10578.6235691686 | -210.623569168634 |
| 67 | 10581 | 10498.2428048007 | 82.7571951992975 |
| 68 | 10597 | 10233.4369281798 | 363.563071820222 |
| 69 | 10680 | 10291.3892054051 | 388.610794594942 |
| 70 | 9738 | 9639.26388603477 | 98.736113965228 |
| 71 | 9556 | 10111.6340489833 | -555.634048983283 |
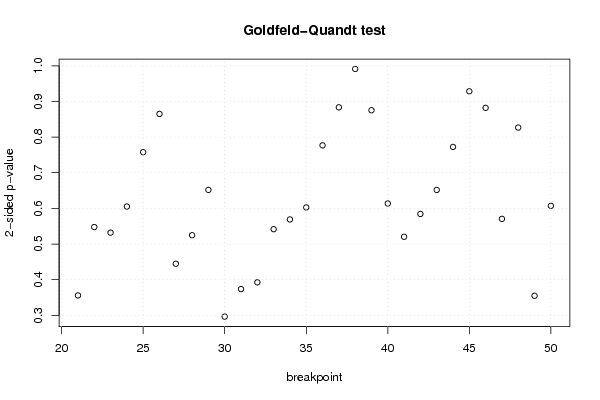
| Goldfeld-Quandt test for Heteroskedasticity | |||
| p-values | Alternative Hypothesis | ||
| breakpoint index | greater | 2-sided | less |
| 21 | 0.822122455598207 | 0.355755088803586 | 0.177877544401793 |
| 22 | 0.726239083632223 | 0.547521832735554 | 0.273760916367777 |
| 23 | 0.734083475606155 | 0.531833048787691 | 0.265916524393845 |
| 24 | 0.697426669369347 | 0.605146661261306 | 0.302573330630653 |
| 25 | 0.6212075131184 | 0.757584973763201 | 0.378792486881600 |
| 26 | 0.567476913246912 | 0.865046173506177 | 0.432523086753088 |
| 27 | 0.77767102672314 | 0.444657946553721 | 0.222328973276860 |
| 28 | 0.737703853684781 | 0.524592292630437 | 0.262296146315219 |
| 29 | 0.674084407667949 | 0.651831184664101 | 0.325915592332051 |
| 30 | 0.851940121044033 | 0.296119757911935 | 0.148059878955967 |
| 31 | 0.813235523535133 | 0.373528952929733 | 0.186764476464867 |
| 32 | 0.803790093947487 | 0.392419812105027 | 0.196209906052513 |
| 33 | 0.729203596280934 | 0.541592807438133 | 0.270796403719066 |
| 34 | 0.7155454023228 | 0.568909195354399 | 0.284454597677199 |
| 35 | 0.698693243288173 | 0.602613513423654 | 0.301306756711827 |
| 36 | 0.611577624308671 | 0.776844751382659 | 0.388422375691329 |
| 37 | 0.558245627152926 | 0.883508745694147 | 0.441754372847074 |
| 38 | 0.495608556092782 | 0.991217112185565 | 0.504391443907218 |
| 39 | 0.43767433348393 | 0.87534866696786 | 0.56232566651607 |
| 40 | 0.693203304440348 | 0.613593391119304 | 0.306796695559652 |
| 41 | 0.739854124654332 | 0.520291750691336 | 0.260145875345668 |
| 42 | 0.70781319933602 | 0.58437360132796 | 0.29218680066398 |
| 43 | 0.674127004739975 | 0.651745990520049 | 0.325872995260025 |
| 44 | 0.613829990890536 | 0.772340018218927 | 0.386170009109464 |
| 45 | 0.535793591148136 | 0.928412817703727 | 0.464206408851864 |
| 46 | 0.440996186435053 | 0.881992372870106 | 0.559003813564947 |
| 47 | 0.714764429436041 | 0.570471141127917 | 0.285235570563959 |
| 48 | 0.586626461343611 | 0.826747077312779 | 0.413373538656389 |
| 49 | 0.822608135569515 | 0.354783728860970 | 0.177391864430485 |
| 50 | 0.696464716105798 | 0.607070567788404 | 0.303535283894202 |
| Meta Analysis of Goldfeld-Quandt test for Heteroskedasticity | |||
| Description | # significant tests | % significant tests | OK/NOK |
| 1% type I error level | 0 | 0 | OK |
| 5% type I error level | 0 | 0 | OK |
| 10% type I error level | 0 | 0 | OK |