Free Statistics

of Irreproducible Research!

Author's title

Author*The author of this computation has been verified*
R Software Modulerwasp_multipleregression.wasp
Title produced by softwareMultiple Regression
Date of computationThu, 09 Dec 2010 16:57:35 +0000
Cite this page as followsStatistical Computations at FreeStatistics.org, Office for Research Development and Education, URL https://freestatistics.org/blog/index.php?v=date/2010/Dec/09/t12919138632qnmy8qr841rlx2.htm/, Retrieved Sun, 28 Apr 2024 19:40:21 +0000
Statistical Computations at FreeStatistics.org, Office for Research Development and Education, URL https://freestatistics.org/blog/index.php?pk=107277, Retrieved Sun, 28 Apr 2024 19:40:21 +0000
QR Codes:

Original text written by user:
IsPrivate?No (this computation is public)
User-defined keywords
Estimated Impact134
Family? (F = Feedback message, R = changed R code, M = changed R Module, P = changed Parameters, D = changed Data)
-     [Multiple Regression] [Q1 The Seatbeltlaw] [2007-11-14 19:27:43] [8cd6641b921d30ebe00b648d1481bba0]
-  MPD    [Multiple Regression] [MR monthly dummie...] [2010-12-09 16:57:35] [be9b1effb945c5b0652fb49bcca5faef] [Current]
Feedback Forum

Post a new message
Dataseries X:
31514
27071
29462
26105
22397
23843
21705
18089
20764
25316
17704
15548
28029
29383
36438
32034
22679
24319
18004
17537
20366
22782
19169
13807
29743
25591
29096
26482
22405
27044
17970
18730
19684
19785
18479
10698
31956
29506
34506
27165
26736
23691
18157
17328
18205
20995
17382
9367
31124
26551
30651
25859
25100
25778
20418
18688
20424
24776
19814
12738
31566
30111
30019
31934
25826
26835
20205
17789
20520
22518
15572
11509
25447
24090
27786
26195
20516
22759
19028
16971
20036
22485
18730
14538


Summary of computational transaction
Raw Inputview raw input (R code)
Raw Outputview raw output of R engine
Computing time7 seconds
R Server'George Udny Yule' @ 72.249.76.132

\begin{tabular}{lllllllll}
\hline
Summary of computational transaction \tabularnewline
Raw Input & view raw input (R code)  \tabularnewline
Raw Output & view raw output of R engine  \tabularnewline
Computing time & 7 seconds \tabularnewline
R Server & 'George Udny Yule' @ 72.249.76.132 \tabularnewline
\hline
\end{tabular}
%Source: https://freestatistics.org/blog/index.php?pk=107277&T=0

[TABLE]
[ROW][C]Summary of computational transaction[/C][/ROW]
[ROW][C]Raw Input[/C][C]view raw input (R code) [/C][/ROW]
[ROW][C]Raw Output[/C][C]view raw output of R engine [/C][/ROW]
[ROW][C]Computing time[/C][C]7 seconds[/C][/ROW]
[ROW][C]R Server[/C][C]'George Udny Yule' @ 72.249.76.132[/C][/ROW]
[/TABLE]
Source: https://freestatistics.org/blog/index.php?pk=107277&T=0

Globally Unique Identifier (entire table): ba.freestatistics.org/blog/index.php?pk=107277&T=0

As an alternative you can also use a QR Code:  

The GUIDs for individual cells are displayed in the table below:

Summary of computational transaction
Raw Inputview raw input (R code)
Raw Outputview raw output of R engine
Computing time7 seconds
R Server'George Udny Yule' @ 72.249.76.132


Multiple Linear Regression - Estimated Regression Equation
y[t] = + 12600.7142857143 + 17310.5714285714M1[t] + 14871.1428571429M2[t] + 18536.1428571428M3[t] + 15367M4[t] + 11064.8571428571M5[t] + 12294.8571428572M6[t] + 6754.57142857143M7[t] + 5275.28571428572M8[t] + 7399.14285714286M9[t] + 10064.5714285714M10[t] + 5520.71428571429M11[t] + e[t]

\begin{tabular}{lllllllll}
\hline
Multiple Linear Regression - Estimated Regression Equation \tabularnewline
y[t] =  +  12600.7142857143 +  17310.5714285714M1[t] +  14871.1428571429M2[t] +  18536.1428571428M3[t] +  15367M4[t] +  11064.8571428571M5[t] +  12294.8571428572M6[t] +  6754.57142857143M7[t] +  5275.28571428572M8[t] +  7399.14285714286M9[t] +  10064.5714285714M10[t] +  5520.71428571429M11[t]  + e[t] \tabularnewline
\hline
\end{tabular}
%Source: https://freestatistics.org/blog/index.php?pk=107277&T=1

[TABLE]
[ROW][C]Multiple Linear Regression - Estimated Regression Equation[/C][/ROW]
[ROW][C]y[t] =  +  12600.7142857143 +  17310.5714285714M1[t] +  14871.1428571429M2[t] +  18536.1428571428M3[t] +  15367M4[t] +  11064.8571428571M5[t] +  12294.8571428572M6[t] +  6754.57142857143M7[t] +  5275.28571428572M8[t] +  7399.14285714286M9[t] +  10064.5714285714M10[t] +  5520.71428571429M11[t]  + e[t][/C][/ROW]
[/TABLE]
Source: https://freestatistics.org/blog/index.php?pk=107277&T=1

Globally Unique Identifier (entire table): ba.freestatistics.org/blog/index.php?pk=107277&T=1

As an alternative you can also use a QR Code:  

The GUIDs for individual cells are displayed in the table below:

Multiple Linear Regression - Estimated Regression Equation
y[t] = + 12600.7142857143 + 17310.5714285714M1[t] + 14871.1428571429M2[t] + 18536.1428571428M3[t] + 15367M4[t] + 11064.8571428571M5[t] + 12294.8571428572M6[t] + 6754.57142857143M7[t] + 5275.28571428572M8[t] + 7399.14285714286M9[t] + 10064.5714285714M10[t] + 5520.71428571429M11[t] + e[t]


Multiple Linear Regression - Ordinary Least Squares
VariableParameterS.D.T-STATH0: parameter = 02-tail p-value1-tail p-value
(Intercept)12600.7142857143772.40898816.313500
M117310.57142857141092.35126615.847100
M214871.14285714291092.35126613.613900
M318536.14285714281092.35126616.96900
M4153671092.35126614.067800
M511064.85714285711092.35126610.129400
M612294.85714285721092.35126611.255400
M76754.571428571431092.3512666.183500
M85275.285714285721092.3512664.82937e-064e-06
M97399.142857142861092.3512666.773600
M1010064.57142857141092.3512669.213700
M115520.714285714291092.3512665.0543e-062e-06

\begin{tabular}{lllllllll}
\hline
Multiple Linear Regression - Ordinary Least Squares \tabularnewline
Variable & Parameter & S.D. & T-STATH0: parameter = 0 & 2-tail p-value & 1-tail p-value \tabularnewline
(Intercept) & 12600.7142857143 & 772.408988 & 16.3135 & 0 & 0 \tabularnewline
M1 & 17310.5714285714 & 1092.351266 & 15.8471 & 0 & 0 \tabularnewline
M2 & 14871.1428571429 & 1092.351266 & 13.6139 & 0 & 0 \tabularnewline
M3 & 18536.1428571428 & 1092.351266 & 16.969 & 0 & 0 \tabularnewline
M4 & 15367 & 1092.351266 & 14.0678 & 0 & 0 \tabularnewline
M5 & 11064.8571428571 & 1092.351266 & 10.1294 & 0 & 0 \tabularnewline
M6 & 12294.8571428572 & 1092.351266 & 11.2554 & 0 & 0 \tabularnewline
M7 & 6754.57142857143 & 1092.351266 & 6.1835 & 0 & 0 \tabularnewline
M8 & 5275.28571428572 & 1092.351266 & 4.8293 & 7e-06 & 4e-06 \tabularnewline
M9 & 7399.14285714286 & 1092.351266 & 6.7736 & 0 & 0 \tabularnewline
M10 & 10064.5714285714 & 1092.351266 & 9.2137 & 0 & 0 \tabularnewline
M11 & 5520.71428571429 & 1092.351266 & 5.054 & 3e-06 & 2e-06 \tabularnewline
\hline
\end{tabular}
%Source: https://freestatistics.org/blog/index.php?pk=107277&T=2

[TABLE]
[ROW][C]Multiple Linear Regression - Ordinary Least Squares[/C][/ROW]
[ROW][C]Variable[/C][C]Parameter[/C][C]S.D.[/C][C]T-STATH0: parameter = 0[/C][C]2-tail p-value[/C][C]1-tail p-value[/C][/ROW]
[ROW][C](Intercept)[/C][C]12600.7142857143[/C][C]772.408988[/C][C]16.3135[/C][C]0[/C][C]0[/C][/ROW]
[ROW][C]M1[/C][C]17310.5714285714[/C][C]1092.351266[/C][C]15.8471[/C][C]0[/C][C]0[/C][/ROW]
[ROW][C]M2[/C][C]14871.1428571429[/C][C]1092.351266[/C][C]13.6139[/C][C]0[/C][C]0[/C][/ROW]
[ROW][C]M3[/C][C]18536.1428571428[/C][C]1092.351266[/C][C]16.969[/C][C]0[/C][C]0[/C][/ROW]
[ROW][C]M4[/C][C]15367[/C][C]1092.351266[/C][C]14.0678[/C][C]0[/C][C]0[/C][/ROW]
[ROW][C]M5[/C][C]11064.8571428571[/C][C]1092.351266[/C][C]10.1294[/C][C]0[/C][C]0[/C][/ROW]
[ROW][C]M6[/C][C]12294.8571428572[/C][C]1092.351266[/C][C]11.2554[/C][C]0[/C][C]0[/C][/ROW]
[ROW][C]M7[/C][C]6754.57142857143[/C][C]1092.351266[/C][C]6.1835[/C][C]0[/C][C]0[/C][/ROW]
[ROW][C]M8[/C][C]5275.28571428572[/C][C]1092.351266[/C][C]4.8293[/C][C]7e-06[/C][C]4e-06[/C][/ROW]
[ROW][C]M9[/C][C]7399.14285714286[/C][C]1092.351266[/C][C]6.7736[/C][C]0[/C][C]0[/C][/ROW]
[ROW][C]M10[/C][C]10064.5714285714[/C][C]1092.351266[/C][C]9.2137[/C][C]0[/C][C]0[/C][/ROW]
[ROW][C]M11[/C][C]5520.71428571429[/C][C]1092.351266[/C][C]5.054[/C][C]3e-06[/C][C]2e-06[/C][/ROW]
[/TABLE]
Source: https://freestatistics.org/blog/index.php?pk=107277&T=2

Globally Unique Identifier (entire table): ba.freestatistics.org/blog/index.php?pk=107277&T=2

As an alternative you can also use a QR Code:  

The GUIDs for individual cells are displayed in the table below:

Multiple Linear Regression - Ordinary Least Squares
VariableParameterS.D.T-STATH0: parameter = 02-tail p-value1-tail p-value
(Intercept)12600.7142857143772.40898816.313500
M117310.57142857141092.35126615.847100
M214871.14285714291092.35126613.613900
M318536.14285714281092.35126616.96900
M4153671092.35126614.067800
M511064.85714285711092.35126610.129400
M612294.85714285721092.35126611.255400
M76754.571428571431092.3512666.183500
M85275.285714285721092.3512664.82937e-064e-06
M97399.142857142861092.3512666.773600
M1010064.57142857141092.3512669.213700
M115520.714285714291092.3512665.0543e-062e-06


Multiple Linear Regression - Regression Statistics
Multiple R0.942751700457095
R-squared0.888780768714744
Adjusted R-squared0.87178894171283
F-TEST (value)52.3063687391958
F-TEST (DF numerator)11
F-TEST (DF denominator)72
p-value0
Multiple Linear Regression - Residual Statistics
Residual Standard Deviation2043.60209236161
Sum Squared Residuals300694284.857143

\begin{tabular}{lllllllll}
\hline
Multiple Linear Regression - Regression Statistics \tabularnewline
Multiple R & 0.942751700457095 \tabularnewline
R-squared & 0.888780768714744 \tabularnewline
Adjusted R-squared & 0.87178894171283 \tabularnewline
F-TEST (value) & 52.3063687391958 \tabularnewline
F-TEST (DF numerator) & 11 \tabularnewline
F-TEST (DF denominator) & 72 \tabularnewline
p-value & 0 \tabularnewline
Multiple Linear Regression - Residual Statistics \tabularnewline
Residual Standard Deviation & 2043.60209236161 \tabularnewline
Sum Squared Residuals & 300694284.857143 \tabularnewline
\hline
\end{tabular}
%Source: https://freestatistics.org/blog/index.php?pk=107277&T=3

[TABLE]
[ROW][C]Multiple Linear Regression - Regression Statistics[/C][/ROW]
[ROW][C]Multiple R[/C][C]0.942751700457095[/C][/ROW]
[ROW][C]R-squared[/C][C]0.888780768714744[/C][/ROW]
[ROW][C]Adjusted R-squared[/C][C]0.87178894171283[/C][/ROW]
[ROW][C]F-TEST (value)[/C][C]52.3063687391958[/C][/ROW]
[ROW][C]F-TEST (DF numerator)[/C][C]11[/C][/ROW]
[ROW][C]F-TEST (DF denominator)[/C][C]72[/C][/ROW]
[ROW][C]p-value[/C][C]0[/C][/ROW]
[ROW][C]Multiple Linear Regression - Residual Statistics[/C][/ROW]
[ROW][C]Residual Standard Deviation[/C][C]2043.60209236161[/C][/ROW]
[ROW][C]Sum Squared Residuals[/C][C]300694284.857143[/C][/ROW]
[/TABLE]
Source: https://freestatistics.org/blog/index.php?pk=107277&T=3

Globally Unique Identifier (entire table): ba.freestatistics.org/blog/index.php?pk=107277&T=3

As an alternative you can also use a QR Code:  

The GUIDs for individual cells are displayed in the table below:

Multiple Linear Regression - Regression Statistics
Multiple R0.942751700457095
R-squared0.888780768714744
Adjusted R-squared0.87178894171283
F-TEST (value)52.3063687391958
F-TEST (DF numerator)11
F-TEST (DF denominator)72
p-value0
Multiple Linear Regression - Residual Statistics
Residual Standard Deviation2043.60209236161
Sum Squared Residuals300694284.857143


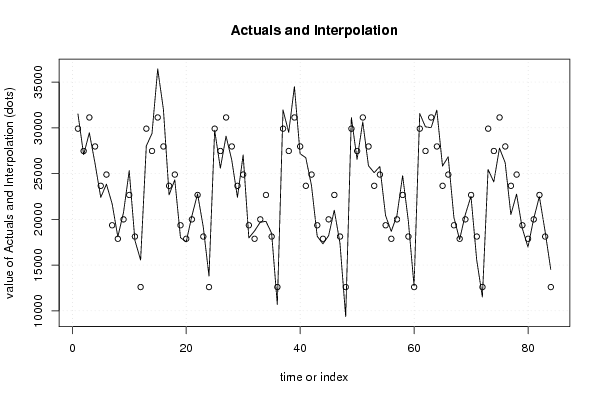
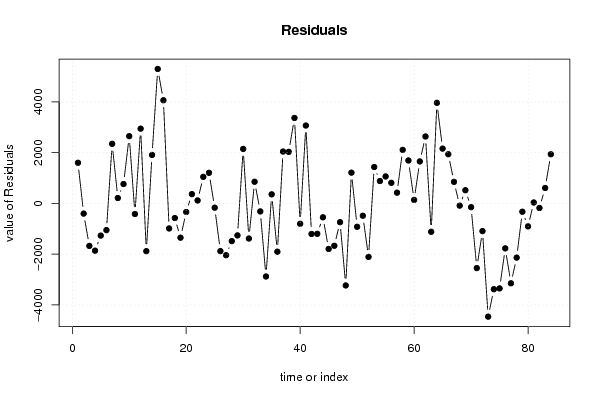
Multiple Linear Regression - Actuals, Interpolation, and Residuals
Time or IndexActualsInterpolationForecastResidualsPrediction Error
13151429911.28571428571602.71428571434
22707127471.8571428571-400.85714285711
32946231136.8571428572-1674.85714285722
42610527967.7142857143-1862.71428571426
52239723665.5714285714-1268.57142857144
62384324895.5714285714-1052.57142857141
72170519355.28571428572349.71428571426
81808917876213.000000000005
92076419999.8571428571764.142857142866
102531622665.28571428572650.71428571428
111770418121.4285714286-417.428571428569
121554812600.71428571432947.28571428571
132802929911.2857142857-1882.28571428572
142938327471.85714285711911.14285714285
153643831136.85714285715301.14285714287
163203427967.71428571434066.28571428571
172267923665.5714285714-986.571428571426
182431924895.5714285714-576.571428571433
191800419355.2857142857-1351.28571428571
201753717876-339.000000000001
212036619999.8571428571366.142857142856
222278222665.2857142857116.714285714287
231916918121.42857142861047.57142857143
241380712600.71428571431206.28571428572
252974329911.2857142857-168.285714285723
262559127471.8571428571-1880.85714285715
272909631136.8571428571-2040.85714285713
282648227967.7142857143-1485.71428571429
292240523665.5714285714-1260.57142857143
302704424895.57142857142148.42857142857
311797019355.2857142857-1385.28571428571
321873017876854
331968419999.8571428571-315.857142857144
341978522665.2857142857-2880.28571428571
351847918121.4285714286357.571428571428
361069812600.7142857143-1902.71428571428
373195629911.28571428572044.71428571428
382950627471.85714285712034.14285714285
393450631136.85714285713369.14285714287
402716527967.7142857143-802.71428571429
412673623665.57142857143070.42857142857
422369124895.5714285714-1204.57142857143
431815719355.2857142857-1198.28571428571
441732817876-548.000000000001
451820519999.8571428571-1794.85714285714
462099522665.2857142857-1670.28571428571
471738218121.4285714286-739.428571428572
48936712600.7142857143-3233.71428571428
493112429911.28571428571212.71428571428
502655127471.8571428571-920.857142857148
513065131136.8571428571-485.857142857129
522585927967.7142857143-2108.71428571429
532510023665.57142857141434.42857142857
542577824895.5714285714882.428571428567
552041819355.28571428571062.71428571429
561868817876812
572042419999.8571428571424.142857142856
582477622665.28571428572110.71428571429
591981418121.42857142861692.57142857143
601273812600.7142857143137.285714285716
613156629911.28571428571654.71428571428
623011127471.85714285712639.14285714285
633001931136.8571428571-1117.85714285713
643193427967.71428571433966.28571428571
652582623665.57142857142160.42857142857
662683524895.57142857141939.42857142857
672020519355.2857142857849.714285714289
681778917876-87.0000000000007
692052019999.8571428571520.142857142856
702251822665.2857142857-147.285714285713
711557218121.4285714286-2549.42857142857
721150912600.7142857143-1091.71428571428
732544729911.2857142857-4464.28571428572
742409027471.8571428571-3381.85714285715
752778631136.8571428571-3350.85714285713
762619527967.7142857143-1772.71428571429
772051623665.5714285714-3149.57142857143
782275924895.5714285714-2136.57142857143
791902819355.2857142857-327.285714285711
801697117876-905.000000000001
812003619999.857142857136.1428571428556
822248522665.2857142857-180.285714285713
831873018121.4285714286608.571428571428
841453812600.71428571431937.28571428572

\begin{tabular}{lllllllll}
\hline
Multiple Linear Regression - Actuals, Interpolation, and Residuals \tabularnewline
Time or Index & Actuals & InterpolationForecast & ResidualsPrediction Error \tabularnewline
1 & 31514 & 29911.2857142857 & 1602.71428571434 \tabularnewline
2 & 27071 & 27471.8571428571 & -400.85714285711 \tabularnewline
3 & 29462 & 31136.8571428572 & -1674.85714285722 \tabularnewline
4 & 26105 & 27967.7142857143 & -1862.71428571426 \tabularnewline
5 & 22397 & 23665.5714285714 & -1268.57142857144 \tabularnewline
6 & 23843 & 24895.5714285714 & -1052.57142857141 \tabularnewline
7 & 21705 & 19355.2857142857 & 2349.71428571426 \tabularnewline
8 & 18089 & 17876 & 213.000000000005 \tabularnewline
9 & 20764 & 19999.8571428571 & 764.142857142866 \tabularnewline
10 & 25316 & 22665.2857142857 & 2650.71428571428 \tabularnewline
11 & 17704 & 18121.4285714286 & -417.428571428569 \tabularnewline
12 & 15548 & 12600.7142857143 & 2947.28571428571 \tabularnewline
13 & 28029 & 29911.2857142857 & -1882.28571428572 \tabularnewline
14 & 29383 & 27471.8571428571 & 1911.14285714285 \tabularnewline
15 & 36438 & 31136.8571428571 & 5301.14285714287 \tabularnewline
16 & 32034 & 27967.7142857143 & 4066.28571428571 \tabularnewline
17 & 22679 & 23665.5714285714 & -986.571428571426 \tabularnewline
18 & 24319 & 24895.5714285714 & -576.571428571433 \tabularnewline
19 & 18004 & 19355.2857142857 & -1351.28571428571 \tabularnewline
20 & 17537 & 17876 & -339.000000000001 \tabularnewline
21 & 20366 & 19999.8571428571 & 366.142857142856 \tabularnewline
22 & 22782 & 22665.2857142857 & 116.714285714287 \tabularnewline
23 & 19169 & 18121.4285714286 & 1047.57142857143 \tabularnewline
24 & 13807 & 12600.7142857143 & 1206.28571428572 \tabularnewline
25 & 29743 & 29911.2857142857 & -168.285714285723 \tabularnewline
26 & 25591 & 27471.8571428571 & -1880.85714285715 \tabularnewline
27 & 29096 & 31136.8571428571 & -2040.85714285713 \tabularnewline
28 & 26482 & 27967.7142857143 & -1485.71428571429 \tabularnewline
29 & 22405 & 23665.5714285714 & -1260.57142857143 \tabularnewline
30 & 27044 & 24895.5714285714 & 2148.42857142857 \tabularnewline
31 & 17970 & 19355.2857142857 & -1385.28571428571 \tabularnewline
32 & 18730 & 17876 & 854 \tabularnewline
33 & 19684 & 19999.8571428571 & -315.857142857144 \tabularnewline
34 & 19785 & 22665.2857142857 & -2880.28571428571 \tabularnewline
35 & 18479 & 18121.4285714286 & 357.571428571428 \tabularnewline
36 & 10698 & 12600.7142857143 & -1902.71428571428 \tabularnewline
37 & 31956 & 29911.2857142857 & 2044.71428571428 \tabularnewline
38 & 29506 & 27471.8571428571 & 2034.14285714285 \tabularnewline
39 & 34506 & 31136.8571428571 & 3369.14285714287 \tabularnewline
40 & 27165 & 27967.7142857143 & -802.71428571429 \tabularnewline
41 & 26736 & 23665.5714285714 & 3070.42857142857 \tabularnewline
42 & 23691 & 24895.5714285714 & -1204.57142857143 \tabularnewline
43 & 18157 & 19355.2857142857 & -1198.28571428571 \tabularnewline
44 & 17328 & 17876 & -548.000000000001 \tabularnewline
45 & 18205 & 19999.8571428571 & -1794.85714285714 \tabularnewline
46 & 20995 & 22665.2857142857 & -1670.28571428571 \tabularnewline
47 & 17382 & 18121.4285714286 & -739.428571428572 \tabularnewline
48 & 9367 & 12600.7142857143 & -3233.71428571428 \tabularnewline
49 & 31124 & 29911.2857142857 & 1212.71428571428 \tabularnewline
50 & 26551 & 27471.8571428571 & -920.857142857148 \tabularnewline
51 & 30651 & 31136.8571428571 & -485.857142857129 \tabularnewline
52 & 25859 & 27967.7142857143 & -2108.71428571429 \tabularnewline
53 & 25100 & 23665.5714285714 & 1434.42857142857 \tabularnewline
54 & 25778 & 24895.5714285714 & 882.428571428567 \tabularnewline
55 & 20418 & 19355.2857142857 & 1062.71428571429 \tabularnewline
56 & 18688 & 17876 & 812 \tabularnewline
57 & 20424 & 19999.8571428571 & 424.142857142856 \tabularnewline
58 & 24776 & 22665.2857142857 & 2110.71428571429 \tabularnewline
59 & 19814 & 18121.4285714286 & 1692.57142857143 \tabularnewline
60 & 12738 & 12600.7142857143 & 137.285714285716 \tabularnewline
61 & 31566 & 29911.2857142857 & 1654.71428571428 \tabularnewline
62 & 30111 & 27471.8571428571 & 2639.14285714285 \tabularnewline
63 & 30019 & 31136.8571428571 & -1117.85714285713 \tabularnewline
64 & 31934 & 27967.7142857143 & 3966.28571428571 \tabularnewline
65 & 25826 & 23665.5714285714 & 2160.42857142857 \tabularnewline
66 & 26835 & 24895.5714285714 & 1939.42857142857 \tabularnewline
67 & 20205 & 19355.2857142857 & 849.714285714289 \tabularnewline
68 & 17789 & 17876 & -87.0000000000007 \tabularnewline
69 & 20520 & 19999.8571428571 & 520.142857142856 \tabularnewline
70 & 22518 & 22665.2857142857 & -147.285714285713 \tabularnewline
71 & 15572 & 18121.4285714286 & -2549.42857142857 \tabularnewline
72 & 11509 & 12600.7142857143 & -1091.71428571428 \tabularnewline
73 & 25447 & 29911.2857142857 & -4464.28571428572 \tabularnewline
74 & 24090 & 27471.8571428571 & -3381.85714285715 \tabularnewline
75 & 27786 & 31136.8571428571 & -3350.85714285713 \tabularnewline
76 & 26195 & 27967.7142857143 & -1772.71428571429 \tabularnewline
77 & 20516 & 23665.5714285714 & -3149.57142857143 \tabularnewline
78 & 22759 & 24895.5714285714 & -2136.57142857143 \tabularnewline
79 & 19028 & 19355.2857142857 & -327.285714285711 \tabularnewline
80 & 16971 & 17876 & -905.000000000001 \tabularnewline
81 & 20036 & 19999.8571428571 & 36.1428571428556 \tabularnewline
82 & 22485 & 22665.2857142857 & -180.285714285713 \tabularnewline
83 & 18730 & 18121.4285714286 & 608.571428571428 \tabularnewline
84 & 14538 & 12600.7142857143 & 1937.28571428572 \tabularnewline
\hline
\end{tabular}
%Source: https://freestatistics.org/blog/index.php?pk=107277&T=4

[TABLE]
[ROW][C]Multiple Linear Regression - Actuals, Interpolation, and Residuals[/C][/ROW]
[ROW][C]Time or Index[/C][C]Actuals[/C][C]InterpolationForecast[/C][C]ResidualsPrediction Error[/C][/ROW]
[ROW][C]1[/C][C]31514[/C][C]29911.2857142857[/C][C]1602.71428571434[/C][/ROW]
[ROW][C]2[/C][C]27071[/C][C]27471.8571428571[/C][C]-400.85714285711[/C][/ROW]
[ROW][C]3[/C][C]29462[/C][C]31136.8571428572[/C][C]-1674.85714285722[/C][/ROW]
[ROW][C]4[/C][C]26105[/C][C]27967.7142857143[/C][C]-1862.71428571426[/C][/ROW]
[ROW][C]5[/C][C]22397[/C][C]23665.5714285714[/C][C]-1268.57142857144[/C][/ROW]
[ROW][C]6[/C][C]23843[/C][C]24895.5714285714[/C][C]-1052.57142857141[/C][/ROW]
[ROW][C]7[/C][C]21705[/C][C]19355.2857142857[/C][C]2349.71428571426[/C][/ROW]
[ROW][C]8[/C][C]18089[/C][C]17876[/C][C]213.000000000005[/C][/ROW]
[ROW][C]9[/C][C]20764[/C][C]19999.8571428571[/C][C]764.142857142866[/C][/ROW]
[ROW][C]10[/C][C]25316[/C][C]22665.2857142857[/C][C]2650.71428571428[/C][/ROW]
[ROW][C]11[/C][C]17704[/C][C]18121.4285714286[/C][C]-417.428571428569[/C][/ROW]
[ROW][C]12[/C][C]15548[/C][C]12600.7142857143[/C][C]2947.28571428571[/C][/ROW]
[ROW][C]13[/C][C]28029[/C][C]29911.2857142857[/C][C]-1882.28571428572[/C][/ROW]
[ROW][C]14[/C][C]29383[/C][C]27471.8571428571[/C][C]1911.14285714285[/C][/ROW]
[ROW][C]15[/C][C]36438[/C][C]31136.8571428571[/C][C]5301.14285714287[/C][/ROW]
[ROW][C]16[/C][C]32034[/C][C]27967.7142857143[/C][C]4066.28571428571[/C][/ROW]
[ROW][C]17[/C][C]22679[/C][C]23665.5714285714[/C][C]-986.571428571426[/C][/ROW]
[ROW][C]18[/C][C]24319[/C][C]24895.5714285714[/C][C]-576.571428571433[/C][/ROW]
[ROW][C]19[/C][C]18004[/C][C]19355.2857142857[/C][C]-1351.28571428571[/C][/ROW]
[ROW][C]20[/C][C]17537[/C][C]17876[/C][C]-339.000000000001[/C][/ROW]
[ROW][C]21[/C][C]20366[/C][C]19999.8571428571[/C][C]366.142857142856[/C][/ROW]
[ROW][C]22[/C][C]22782[/C][C]22665.2857142857[/C][C]116.714285714287[/C][/ROW]
[ROW][C]23[/C][C]19169[/C][C]18121.4285714286[/C][C]1047.57142857143[/C][/ROW]
[ROW][C]24[/C][C]13807[/C][C]12600.7142857143[/C][C]1206.28571428572[/C][/ROW]
[ROW][C]25[/C][C]29743[/C][C]29911.2857142857[/C][C]-168.285714285723[/C][/ROW]
[ROW][C]26[/C][C]25591[/C][C]27471.8571428571[/C][C]-1880.85714285715[/C][/ROW]
[ROW][C]27[/C][C]29096[/C][C]31136.8571428571[/C][C]-2040.85714285713[/C][/ROW]
[ROW][C]28[/C][C]26482[/C][C]27967.7142857143[/C][C]-1485.71428571429[/C][/ROW]
[ROW][C]29[/C][C]22405[/C][C]23665.5714285714[/C][C]-1260.57142857143[/C][/ROW]
[ROW][C]30[/C][C]27044[/C][C]24895.5714285714[/C][C]2148.42857142857[/C][/ROW]
[ROW][C]31[/C][C]17970[/C][C]19355.2857142857[/C][C]-1385.28571428571[/C][/ROW]
[ROW][C]32[/C][C]18730[/C][C]17876[/C][C]854[/C][/ROW]
[ROW][C]33[/C][C]19684[/C][C]19999.8571428571[/C][C]-315.857142857144[/C][/ROW]
[ROW][C]34[/C][C]19785[/C][C]22665.2857142857[/C][C]-2880.28571428571[/C][/ROW]
[ROW][C]35[/C][C]18479[/C][C]18121.4285714286[/C][C]357.571428571428[/C][/ROW]
[ROW][C]36[/C][C]10698[/C][C]12600.7142857143[/C][C]-1902.71428571428[/C][/ROW]
[ROW][C]37[/C][C]31956[/C][C]29911.2857142857[/C][C]2044.71428571428[/C][/ROW]
[ROW][C]38[/C][C]29506[/C][C]27471.8571428571[/C][C]2034.14285714285[/C][/ROW]
[ROW][C]39[/C][C]34506[/C][C]31136.8571428571[/C][C]3369.14285714287[/C][/ROW]
[ROW][C]40[/C][C]27165[/C][C]27967.7142857143[/C][C]-802.71428571429[/C][/ROW]
[ROW][C]41[/C][C]26736[/C][C]23665.5714285714[/C][C]3070.42857142857[/C][/ROW]
[ROW][C]42[/C][C]23691[/C][C]24895.5714285714[/C][C]-1204.57142857143[/C][/ROW]
[ROW][C]43[/C][C]18157[/C][C]19355.2857142857[/C][C]-1198.28571428571[/C][/ROW]
[ROW][C]44[/C][C]17328[/C][C]17876[/C][C]-548.000000000001[/C][/ROW]
[ROW][C]45[/C][C]18205[/C][C]19999.8571428571[/C][C]-1794.85714285714[/C][/ROW]
[ROW][C]46[/C][C]20995[/C][C]22665.2857142857[/C][C]-1670.28571428571[/C][/ROW]
[ROW][C]47[/C][C]17382[/C][C]18121.4285714286[/C][C]-739.428571428572[/C][/ROW]
[ROW][C]48[/C][C]9367[/C][C]12600.7142857143[/C][C]-3233.71428571428[/C][/ROW]
[ROW][C]49[/C][C]31124[/C][C]29911.2857142857[/C][C]1212.71428571428[/C][/ROW]
[ROW][C]50[/C][C]26551[/C][C]27471.8571428571[/C][C]-920.857142857148[/C][/ROW]
[ROW][C]51[/C][C]30651[/C][C]31136.8571428571[/C][C]-485.857142857129[/C][/ROW]
[ROW][C]52[/C][C]25859[/C][C]27967.7142857143[/C][C]-2108.71428571429[/C][/ROW]
[ROW][C]53[/C][C]25100[/C][C]23665.5714285714[/C][C]1434.42857142857[/C][/ROW]
[ROW][C]54[/C][C]25778[/C][C]24895.5714285714[/C][C]882.428571428567[/C][/ROW]
[ROW][C]55[/C][C]20418[/C][C]19355.2857142857[/C][C]1062.71428571429[/C][/ROW]
[ROW][C]56[/C][C]18688[/C][C]17876[/C][C]812[/C][/ROW]
[ROW][C]57[/C][C]20424[/C][C]19999.8571428571[/C][C]424.142857142856[/C][/ROW]
[ROW][C]58[/C][C]24776[/C][C]22665.2857142857[/C][C]2110.71428571429[/C][/ROW]
[ROW][C]59[/C][C]19814[/C][C]18121.4285714286[/C][C]1692.57142857143[/C][/ROW]
[ROW][C]60[/C][C]12738[/C][C]12600.7142857143[/C][C]137.285714285716[/C][/ROW]
[ROW][C]61[/C][C]31566[/C][C]29911.2857142857[/C][C]1654.71428571428[/C][/ROW]
[ROW][C]62[/C][C]30111[/C][C]27471.8571428571[/C][C]2639.14285714285[/C][/ROW]
[ROW][C]63[/C][C]30019[/C][C]31136.8571428571[/C][C]-1117.85714285713[/C][/ROW]
[ROW][C]64[/C][C]31934[/C][C]27967.7142857143[/C][C]3966.28571428571[/C][/ROW]
[ROW][C]65[/C][C]25826[/C][C]23665.5714285714[/C][C]2160.42857142857[/C][/ROW]
[ROW][C]66[/C][C]26835[/C][C]24895.5714285714[/C][C]1939.42857142857[/C][/ROW]
[ROW][C]67[/C][C]20205[/C][C]19355.2857142857[/C][C]849.714285714289[/C][/ROW]
[ROW][C]68[/C][C]17789[/C][C]17876[/C][C]-87.0000000000007[/C][/ROW]
[ROW][C]69[/C][C]20520[/C][C]19999.8571428571[/C][C]520.142857142856[/C][/ROW]
[ROW][C]70[/C][C]22518[/C][C]22665.2857142857[/C][C]-147.285714285713[/C][/ROW]
[ROW][C]71[/C][C]15572[/C][C]18121.4285714286[/C][C]-2549.42857142857[/C][/ROW]
[ROW][C]72[/C][C]11509[/C][C]12600.7142857143[/C][C]-1091.71428571428[/C][/ROW]
[ROW][C]73[/C][C]25447[/C][C]29911.2857142857[/C][C]-4464.28571428572[/C][/ROW]
[ROW][C]74[/C][C]24090[/C][C]27471.8571428571[/C][C]-3381.85714285715[/C][/ROW]
[ROW][C]75[/C][C]27786[/C][C]31136.8571428571[/C][C]-3350.85714285713[/C][/ROW]
[ROW][C]76[/C][C]26195[/C][C]27967.7142857143[/C][C]-1772.71428571429[/C][/ROW]
[ROW][C]77[/C][C]20516[/C][C]23665.5714285714[/C][C]-3149.57142857143[/C][/ROW]
[ROW][C]78[/C][C]22759[/C][C]24895.5714285714[/C][C]-2136.57142857143[/C][/ROW]
[ROW][C]79[/C][C]19028[/C][C]19355.2857142857[/C][C]-327.285714285711[/C][/ROW]
[ROW][C]80[/C][C]16971[/C][C]17876[/C][C]-905.000000000001[/C][/ROW]
[ROW][C]81[/C][C]20036[/C][C]19999.8571428571[/C][C]36.1428571428556[/C][/ROW]
[ROW][C]82[/C][C]22485[/C][C]22665.2857142857[/C][C]-180.285714285713[/C][/ROW]
[ROW][C]83[/C][C]18730[/C][C]18121.4285714286[/C][C]608.571428571428[/C][/ROW]
[ROW][C]84[/C][C]14538[/C][C]12600.7142857143[/C][C]1937.28571428572[/C][/ROW]
[/TABLE]
Source: https://freestatistics.org/blog/index.php?pk=107277&T=4

Globally Unique Identifier (entire table): ba.freestatistics.org/blog/index.php?pk=107277&T=4

As an alternative you can also use a QR Code:  

The GUIDs for individual cells are displayed in the table below:

Multiple Linear Regression - Actuals, Interpolation, and Residuals
Time or IndexActualsInterpolationForecastResidualsPrediction Error
13151429911.28571428571602.71428571434
22707127471.8571428571-400.85714285711
32946231136.8571428572-1674.85714285722
42610527967.7142857143-1862.71428571426
52239723665.5714285714-1268.57142857144
62384324895.5714285714-1052.57142857141
72170519355.28571428572349.71428571426
81808917876213.000000000005
92076419999.8571428571764.142857142866
102531622665.28571428572650.71428571428
111770418121.4285714286-417.428571428569
121554812600.71428571432947.28571428571
132802929911.2857142857-1882.28571428572
142938327471.85714285711911.14285714285
153643831136.85714285715301.14285714287
163203427967.71428571434066.28571428571
172267923665.5714285714-986.571428571426
182431924895.5714285714-576.571428571433
191800419355.2857142857-1351.28571428571
201753717876-339.000000000001
212036619999.8571428571366.142857142856
222278222665.2857142857116.714285714287
231916918121.42857142861047.57142857143
241380712600.71428571431206.28571428572
252974329911.2857142857-168.285714285723
262559127471.8571428571-1880.85714285715
272909631136.8571428571-2040.85714285713
282648227967.7142857143-1485.71428571429
292240523665.5714285714-1260.57142857143
302704424895.57142857142148.42857142857
311797019355.2857142857-1385.28571428571
321873017876854
331968419999.8571428571-315.857142857144
341978522665.2857142857-2880.28571428571
351847918121.4285714286357.571428571428
361069812600.7142857143-1902.71428571428
373195629911.28571428572044.71428571428
382950627471.85714285712034.14285714285
393450631136.85714285713369.14285714287
402716527967.7142857143-802.71428571429
412673623665.57142857143070.42857142857
422369124895.5714285714-1204.57142857143
431815719355.2857142857-1198.28571428571
441732817876-548.000000000001
451820519999.8571428571-1794.85714285714
462099522665.2857142857-1670.28571428571
471738218121.4285714286-739.428571428572
48936712600.7142857143-3233.71428571428
493112429911.28571428571212.71428571428
502655127471.8571428571-920.857142857148
513065131136.8571428571-485.857142857129
522585927967.7142857143-2108.71428571429
532510023665.57142857141434.42857142857
542577824895.5714285714882.428571428567
552041819355.28571428571062.71428571429
561868817876812
572042419999.8571428571424.142857142856
582477622665.28571428572110.71428571429
591981418121.42857142861692.57142857143
601273812600.7142857143137.285714285716
613156629911.28571428571654.71428571428
623011127471.85714285712639.14285714285
633001931136.8571428571-1117.85714285713
643193427967.71428571433966.28571428571
652582623665.57142857142160.42857142857
662683524895.57142857141939.42857142857
672020519355.2857142857849.714285714289
681778917876-87.0000000000007
692052019999.8571428571520.142857142856
702251822665.2857142857-147.285714285713
711557218121.4285714286-2549.42857142857
721150912600.7142857143-1091.71428571428
732544729911.2857142857-4464.28571428572
742409027471.8571428571-3381.85714285715
752778631136.8571428571-3350.85714285713
762619527967.7142857143-1772.71428571429
772051623665.5714285714-3149.57142857143
782275924895.5714285714-2136.57142857143
791902819355.2857142857-327.285714285711
801697117876-905.000000000001
812003619999.857142857136.1428571428556
822248522665.2857142857-180.285714285713
831873018121.4285714286608.571428571428
841453812600.71428571431937.28571428572


Parameters (Session):
par1 = 1 ; par2 = Include Monthly Dummies ; par3 = No Linear Trend ;
Parameters (R input):
par1 = 1 ; par2 = Include Monthly Dummies ; par3 = No Linear Trend ;
R code (references can be found in the software module):
library(lattice)
par1 <- as.numeric(par1)
x <- t(y)
k <- length(x[1,])
n <- length(x[,1])
x1 <- cbind(x[,par1], x[,1:k!=par1])
mycolnames <- c(colnames(x)[par1], colnames(x)[1:k!=par1])
colnames(x1) <- mycolnames #colnames(x)[par1]
x <- x1
if (par3 == 'First Differences'){
x2 <- array(0, dim=c(n-1,k), dimnames=list(1:(n-1), paste('(1-B)',colnames(x),sep='')))
for (i in 1:n-1) {
for (j in 1:k) {
x2[i,j] <- x[i+1,j] - x[i,j]
}
}
x <- x2
}
if (par2 == 'Include Monthly Dummies'){
x2 <- array(0, dim=c(n,11), dimnames=list(1:n, paste('M', seq(1:11), sep ='')))
for (i in 1:11){
x2[seq(i,n,12),i] <- 1
}
x <- cbind(x, x2)
}
if (par2 == 'Include Quarterly Dummies'){
x2 <- array(0, dim=c(n,3), dimnames=list(1:n, paste('Q', seq(1:3), sep ='')))
for (i in 1:3){
x2[seq(i,n,4),i] <- 1
}
x <- cbind(x, x2)
}
k <- length(x[1,])
if (par3 == 'Linear Trend'){
x <- cbind(x, c(1:n))
colnames(x)[k+1] <- 't'
}
x
k <- length(x[1,])
df <- as.data.frame(x)
(mylm <- lm(df))
(mysum <- summary(mylm))
bitmap(file='test0.png')
plot(x[,1], type='l', main='Actuals and Interpolation', ylab='value of Actuals and Interpolation (dots)', xlab='time or index')
points(x[,1]-mysum$resid)
grid()
dev.off()
bitmap(file='test1.png')
plot(mysum$resid, type='b', pch=19, main='Residuals', ylab='value of Residuals', xlab='time or index')
grid()
dev.off()
bitmap(file='test2.png')
hist(mysum$resid, main='Residual Histogram', xlab='values of Residuals')
grid()
dev.off()
bitmap(file='test3.png')
densityplot(~mysum$resid,col='black',main='Residual Density Plot', xlab='values of Residuals')
dev.off()
bitmap(file='test4.png')
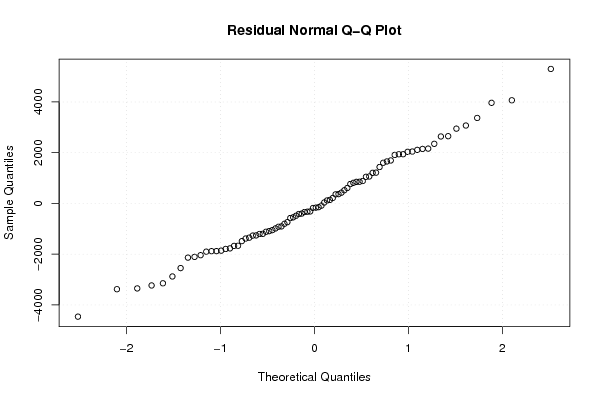
qqnorm(mysum$resid, main='Residual Normal Q-Q Plot')
grid()
dev.off()
(myerror <- as.ts(mysum$resid))
bitmap(file='test5.png')
dum <- cbind(lag(myerror,k=1),myerror)
dum
dum1 <- dum[2:length(myerror),]
dum1
z <- as.data.frame(dum1)
z
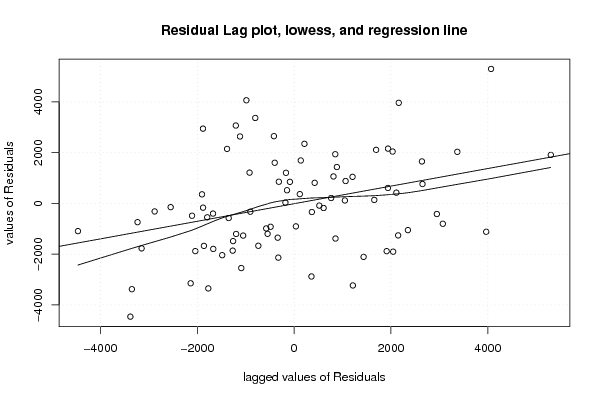
plot(z,main=paste('Residual Lag plot, lowess, and regression line'), ylab='values of Residuals', xlab='lagged values of Residuals')
lines(lowess(z))
abline(lm(z))
grid()
dev.off()
bitmap(file='test6.png')
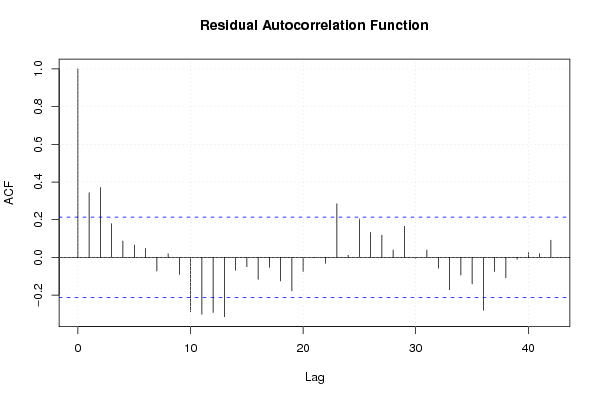
acf(mysum$resid, lag.max=length(mysum$resid)/2, main='Residual Autocorrelation Function')
grid()
dev.off()
bitmap(file='test7.png')
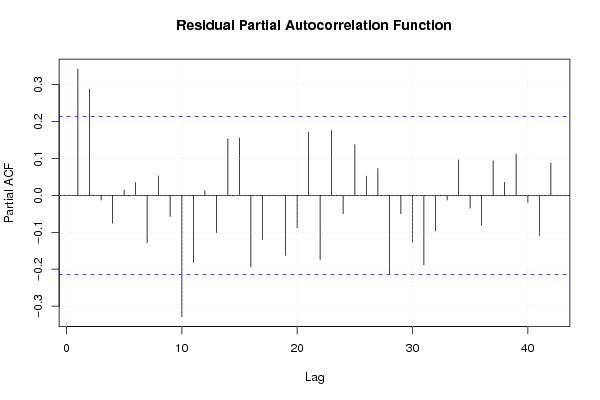
pacf(mysum$resid, lag.max=length(mysum$resid)/2, main='Residual Partial Autocorrelation Function')
grid()
dev.off()
bitmap(file='test8.png')
opar <- par(mfrow = c(2,2), oma = c(0, 0, 1.1, 0))
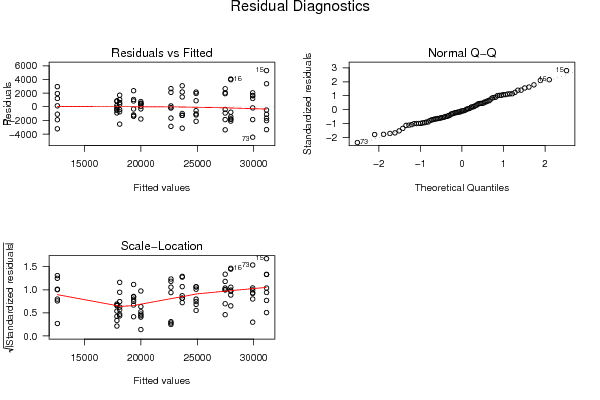
plot(mylm, las = 1, sub='Residual Diagnostics')
par(opar)
dev.off()
load(file='createtable')
a<-table.start()
a<-table.row.start(a)
a<-table.element(a, 'Multiple Linear Regression - Estimated Regression Equation', 1, TRUE)
a<-table.row.end(a)
myeq <- colnames(x)[1]
myeq <- paste(myeq, '[t] = ', sep='')
for (i in 1:k){
if (mysum$coefficients[i,1] > 0) myeq <- paste(myeq, '+', '')
myeq <- paste(myeq, mysum$coefficients[i,1], sep=' ')
if (rownames(mysum$coefficients)[i] != '(Intercept)') {
myeq <- paste(myeq, rownames(mysum$coefficients)[i], sep='')
if (rownames(mysum$coefficients)[i] != 't') myeq <- paste(myeq, '[t]', sep='')
}
}
myeq <- paste(myeq, ' + e[t]')
a<-table.row.start(a)
a<-table.element(a, myeq)
a<-table.row.end(a)
a<-table.end(a)
table.save(a,file='mytable1.tab')
a<-table.start()
a<-table.row.start(a)
a<-table.element(a,hyperlink('ols1.htm','Multiple Linear Regression - Ordinary Least Squares',''), 6, TRUE)
a<-table.row.end(a)
a<-table.row.start(a)
a<-table.element(a,'Variable',header=TRUE)
a<-table.element(a,'Parameter',header=TRUE)
a<-table.element(a,'S.D.',header=TRUE)
a<-table.element(a,'T-STAT
H0: parameter = 0',header=TRUE)
a<-table.element(a,'2-tail p-value',header=TRUE)
a<-table.element(a,'1-tail p-value',header=TRUE)
a<-table.row.end(a)
for (i in 1:k){
a<-table.row.start(a)
a<-table.element(a,rownames(mysum$coefficients)[i],header=TRUE)
a<-table.element(a,mysum$coefficients[i,1])
a<-table.element(a, round(mysum$coefficients[i,2],6))
a<-table.element(a, round(mysum$coefficients[i,3],4))
a<-table.element(a, round(mysum$coefficients[i,4],6))
a<-table.element(a, round(mysum$coefficients[i,4]/2,6))
a<-table.row.end(a)
}
a<-table.end(a)
table.save(a,file='mytable2.tab')
a<-table.start()
a<-table.row.start(a)
a<-table.element(a, 'Multiple Linear Regression - Regression Statistics', 2, TRUE)
a<-table.row.end(a)
a<-table.row.start(a)
a<-table.element(a, 'Multiple R',1,TRUE)
a<-table.element(a, sqrt(mysum$r.squared))
a<-table.row.end(a)
a<-table.row.start(a)
a<-table.element(a, 'R-squared',1,TRUE)
a<-table.element(a, mysum$r.squared)
a<-table.row.end(a)
a<-table.row.start(a)
a<-table.element(a, 'Adjusted R-squared',1,TRUE)
a<-table.element(a, mysum$adj.r.squared)
a<-table.row.end(a)
a<-table.row.start(a)
a<-table.element(a, 'F-TEST (value)',1,TRUE)
a<-table.element(a, mysum$fstatistic[1])
a<-table.row.end(a)
a<-table.row.start(a)
a<-table.element(a, 'F-TEST (DF numerator)',1,TRUE)
a<-table.element(a, mysum$fstatistic[2])
a<-table.row.end(a)
a<-table.row.start(a)
a<-table.element(a, 'F-TEST (DF denominator)',1,TRUE)
a<-table.element(a, mysum$fstatistic[3])
a<-table.row.end(a)
a<-table.row.start(a)
a<-table.element(a, 'p-value',1,TRUE)
a<-table.element(a, 1-pf(mysum$fstatistic[1],mysum$fstatistic[2],mysum$fstatistic[3]))
a<-table.row.end(a)
a<-table.row.start(a)
a<-table.element(a, 'Multiple Linear Regression - Residual Statistics', 2, TRUE)
a<-table.row.end(a)
a<-table.row.start(a)
a<-table.element(a, 'Residual Standard Deviation',1,TRUE)
a<-table.element(a, mysum$sigma)
a<-table.row.end(a)
a<-table.row.start(a)
a<-table.element(a, 'Sum Squared Residuals',1,TRUE)
a<-table.element(a, sum(myerror*myerror))
a<-table.row.end(a)
a<-table.end(a)
table.save(a,file='mytable3.tab')
a<-table.start()
a<-table.row.start(a)
a<-table.element(a, 'Multiple Linear Regression - Actuals, Interpolation, and Residuals', 4, TRUE)
a<-table.row.end(a)
a<-table.row.start(a)
a<-table.element(a, 'Time or Index', 1, TRUE)
a<-table.element(a, 'Actuals', 1, TRUE)
a<-table.element(a, 'Interpolation
Forecast', 1, TRUE)
a<-table.element(a, 'Residuals
Prediction Error', 1, TRUE)
a<-table.row.end(a)
for (i in 1:n) {
a<-table.row.start(a)
a<-table.element(a,i, 1, TRUE)
a<-table.element(a,x[i])
a<-table.element(a,x[i]-mysum$resid[i])
a<-table.element(a,mysum$resid[i])
a<-table.row.end(a)
}
a<-table.end(a)
table.save(a,file='mytable4.tab')