| Multiple Linear Regression - Estimated Regression Equation |
| SWS[t] = + 11.6991087210001 -1.81485814734191Wb[t] -0.80621691930904D[t] + e[t] |
| Multiple Linear Regression - Ordinary Least Squares | |||||
| Variable | Parameter | S.D. | T-STAT H0: parameter = 0 | 2-tail p-value | 1-tail p-value |
| (Intercept) | 11.6991087210001 | 0.941095 | 12.4314 | 0 | 0 |
| Wb | -1.81485814734191 | 0.37295 | -4.8662 | 2.3e-05 | 1.1e-05 |
| D | -0.80621691930904 | 0.336956 | -2.3927 | 0.022068 | 0.011034 |
| Multiple Linear Regression - Regression Statistics | |
| Multiple R | 0.757704457897525 |
| R-squared | 0.574116045517782 |
| Adjusted R-squared | 0.550455825824325 |
| F-TEST (value) | 24.2650344314664 |
| F-TEST (DF numerator) | 2 |
| F-TEST (DF denominator) | 36 |
| p-value | 2.12443282854302e-07 |
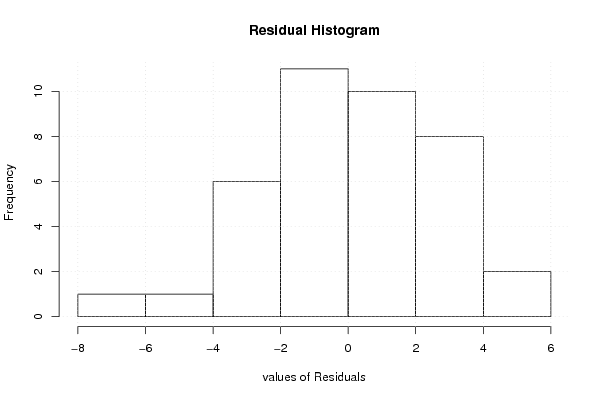
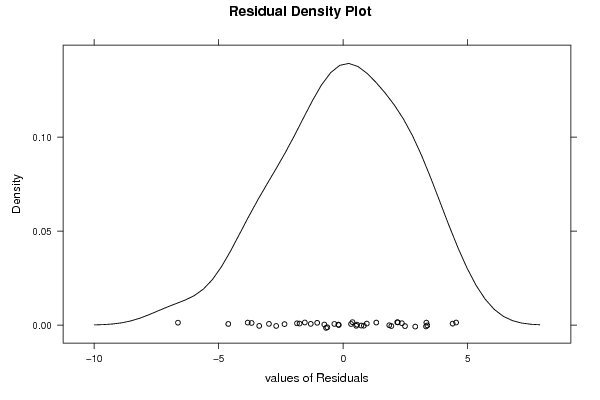
| Multiple Linear Regression - Residual Statistics | |
| Residual Standard Deviation | 2.66067288469349 |
| Sum Squared Residuals | 254.850487176355 |
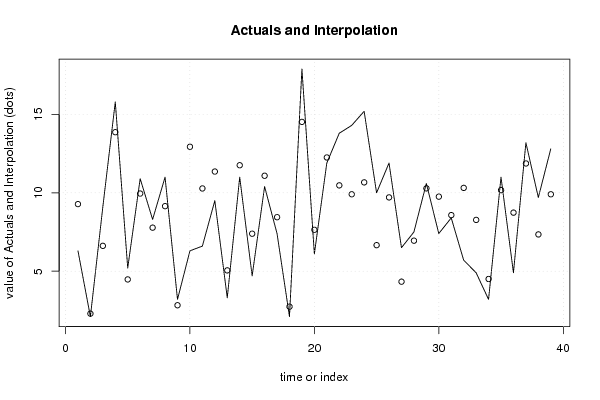
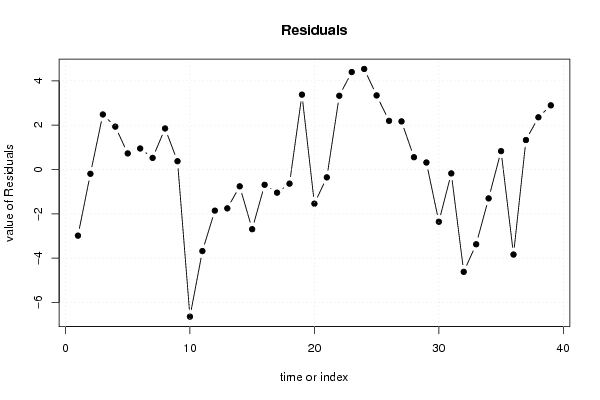
| Multiple Linear Regression - Actuals, Interpolation, and Residuals | |||
| Time or Index | Actuals | Interpolation Forecast | Residuals Prediction Error |
| 1 | 6.3 | 9.280457963073 | -2.980457963073 |
| 2 | 2.1 | 2.29278166284831 | -0.192781662848308 |
| 3 | 9.1 | 6.61718297994529 | 2.48281702005471 |
| 4 | 15.8 | 13.8661233860899 | 1.93387661391007 |
| 5 | 5.2 | 4.47407593489727 | 0.725924065102727 |
| 6 | 10.9 | 9.9518625531717 | 0.948137446828292 |
| 7 | 8.3 | 7.77616769744705 | 0.523832302552956 |
| 8 | 11 | 9.14866242179589 | 1.85133757820411 |
| 9 | 3.2 | 2.82697540005161 | 0.373024599948394 |
| 10 | 6.3 | 12.9344960337960 | -6.63449603379604 |
| 11 | 6.6 | 10.2774715419084 | -3.67747154190842 |
| 12 | 9.5 | 11.3552062888890 | -1.85520628888903 |
| 13 | 3.3 | 5.05126695557864 | -1.75126695557864 |
| 14 | 11 | 11.7578303003042 | -0.757830300304154 |
| 15 | 4.7 | 7.39127014420428 | -2.69127014420428 |
| 16 | 10.4 | 11.0874734296033 | -0.687473429603286 |
| 17 | 7.4 | 8.44332794970336 | -1.04332794970336 |
| 18 | 2.1 | 2.7373490478625 | -0.637349047862501 |
| 19 | 17.9 | 14.5226080963749 | 3.37739190362511 |
| 20 | 6.1 | 7.63995514168148 | -1.53995514168148 |
| 21 | 11.9 | 12.2536895474719 | -0.353689547471852 |
| 22 | 13.8 | 10.4746596998681 | 3.32534030013194 |
| 23 | 14.3 | 9.90548547932929 | 4.39451452067071 |
| 24 | 15.2 | 10.6651768204492 | 4.5348231795508 |
| 25 | 10 | 6.65938289642203 | 3.34061710357797 |
| 26 | 11.9 | 9.70643485041881 | 2.19356514958119 |
| 27 | 6.5 | 4.33037320547749 | 2.16962679452251 |
| 28 | 7.5 | 6.94581945696794 | 0.554180543032061 |
| 29 | 10.6 | 10.2837877147052 | 0.316212285294820 |
| 30 | 7.4 | 9.75524177428921 | -2.35524177428921 |
| 31 | 8.4 | 8.57578929888921 | -0.175789298889214 |
| 32 | 5.7 | 10.3134209671451 | -4.61342096714508 |
| 33 | 4.9 | 8.27084783674645 | -3.37084783674645 |
| 34 | 3.2 | 4.50237979290602 | -1.30237979290602 |
| 35 | 11 | 10.1697182377253 | 0.830281762274701 |
| 36 | 4.9 | 8.73413122223808 | -3.83413122223808 |
| 37 | 13.2 | 11.8706199356634 | 1.32938006433665 |
| 38 | 9.7 | 7.345010854732 | 2.35498914526799 |
| 39 | 12.8 | 9.90548547932929 | 2.89451452067071 |
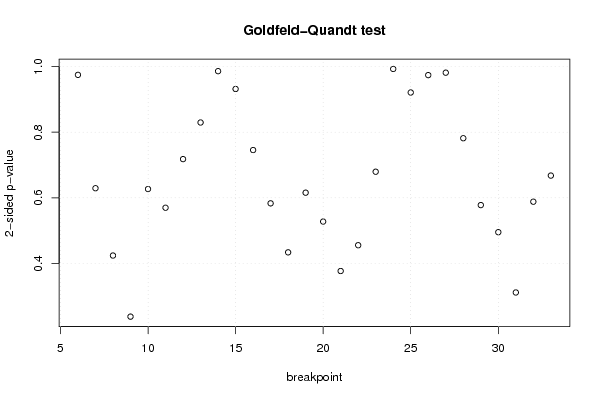
| Goldfeld-Quandt test for Heteroskedasticity | |||
| p-values | Alternative Hypothesis | ||
| breakpoint index | greater | 2-sided | less |
| 6 | 0.487417597649921 | 0.974835195299841 | 0.512582402350079 |
| 7 | 0.314522282893245 | 0.62904456578649 | 0.685477717106755 |
| 8 | 0.211851612883127 | 0.423703225766254 | 0.788148387116873 |
| 9 | 0.118643493199263 | 0.237286986398526 | 0.881356506800737 |
| 10 | 0.686698345546378 | 0.626603308907243 | 0.313301654453622 |
| 11 | 0.715221570884302 | 0.569556858231395 | 0.284778429115698 |
| 12 | 0.641026045963906 | 0.717947908072189 | 0.358973954036094 |
| 13 | 0.585207279062048 | 0.829585441875904 | 0.414792720937952 |
| 14 | 0.49311010642694 | 0.98622021285388 | 0.50688989357306 |
| 15 | 0.465954652074004 | 0.931909304148009 | 0.534045347925996 |
| 16 | 0.372759378149236 | 0.745518756298472 | 0.627240621850764 |
| 17 | 0.29149238895492 | 0.58298477790984 | 0.70850761104508 |
| 18 | 0.216744707303669 | 0.433489414607338 | 0.783255292696331 |
| 19 | 0.30773842255763 | 0.61547684511526 | 0.69226157744237 |
| 20 | 0.263694886433524 | 0.527389772867048 | 0.736305113566476 |
| 21 | 0.188260257526209 | 0.376520515052418 | 0.811739742473791 |
| 22 | 0.227590098784001 | 0.455180197568003 | 0.772409901215999 |
| 23 | 0.339693210554081 | 0.679386421108161 | 0.660306789445919 |
| 24 | 0.503527566311853 | 0.992944867376294 | 0.496472433688147 |
| 25 | 0.539432557528064 | 0.921134884943872 | 0.460567442471936 |
| 26 | 0.512943955242645 | 0.97411208951471 | 0.487056044757355 |
| 27 | 0.490764542230057 | 0.981529084460115 | 0.509235457769943 |
| 28 | 0.390812133990897 | 0.781624267981794 | 0.609187866009103 |
| 29 | 0.288806827575485 | 0.57761365515097 | 0.711193172424515 |
| 30 | 0.247480363954633 | 0.494960727909266 | 0.752519636045367 |
| 31 | 0.155512041409485 | 0.311024082818971 | 0.844487958590515 |
| 32 | 0.293987458773328 | 0.587974917546655 | 0.706012541226672 |
| 33 | 0.33381705360305 | 0.6676341072061 | 0.66618294639695 |
| Meta Analysis of Goldfeld-Quandt test for Heteroskedasticity | |||
| Description | # significant tests | % significant tests | OK/NOK |
| 1% type I error level | 0 | 0 | OK |
| 5% type I error level | 0 | 0 | OK |
| 10% type I error level | 0 | 0 | OK |