Free Statistics

of Irreproducible Research!

Author's title

Author*The author of this computation has been verified*
R Software Modulerwasp_centraltendency.wasp
Title produced by softwareCentral Tendency
Date of computationThu, 09 Dec 2010 12:29:38 +0000
Cite this page as followsStatistical Computations at FreeStatistics.org, Office for Research Development and Education, URL https://freestatistics.org/blog/index.php?v=date/2010/Dec/09/t129189766894uv01rvh5440sl.htm/, Retrieved Sun, 28 Apr 2024 23:47:13 +0000
Statistical Computations at FreeStatistics.org, Office for Research Development and Education, URL https://freestatistics.org/blog/index.php?pk=107190, Retrieved Sun, 28 Apr 2024 23:47:13 +0000
QR Codes:

Original text written by user:
IsPrivate?No (this computation is public)
User-defined keywords
Estimated Impact182
Family? (F = Feedback message, R = changed R code, M = changed R Module, P = changed Parameters, D = changed Data)
-     [Bivariate Data Series] [Bivariate dataset] [2008-01-05 23:51:08] [74be16979710d4c4e7c6647856088456]
F RMPD  [Univariate Explorative Data Analysis] [Colombia Coffee] [2008-01-07 14:21:11] [74be16979710d4c4e7c6647856088456]
F RMPD    [Univariate Data Series] [] [2009-10-14 08:30:28] [74be16979710d4c4e7c6647856088456]
- RMP       [Central Tendency] [WS 3: Part 1: Cen...] [2009-10-18 15:24:12] [8cf9233b7464ea02e32be3b30fdac052]
-  M D        [Central Tendency] [Paper: Central Te...] [2009-12-13 16:14:14] [8cf9233b7464ea02e32be3b30fdac052]
-    D            [Central Tendency] [Faillissementen W...] [2010-12-09 12:29:38] [9003764b6a75599accb6eea9154ba195] [Current]
Feedback Forum

Post a new message
Dataseries X:
182
213
227
209
219
221
114
97
205
215
224
189
182
201
198
173
238
258
122
101
259
243
188
173
224
215
196
159
187
208
131
93
210
228
176
195
188
188
190
188
176
225
93
79
235
247
195
197
211
156
209
180
185
303
129
85
249
231
212
240
234
217
287
221
208
241
156
96
320
242
227
200


Summary of computational transaction
Raw Inputview raw input (R code)
Raw Outputview raw output of R engine
Computing time2 seconds
R Server'Gwilym Jenkins' @ 72.249.127.135

\begin{tabular}{lllllllll}
\hline
Summary of computational transaction \tabularnewline
Raw Input & view raw input (R code)  \tabularnewline
Raw Output & view raw output of R engine  \tabularnewline
Computing time & 2 seconds \tabularnewline
R Server & 'Gwilym Jenkins' @ 72.249.127.135 \tabularnewline
\hline
\end{tabular}
%Source: https://freestatistics.org/blog/index.php?pk=107190&T=0

[TABLE]
[ROW][C]Summary of computational transaction[/C][/ROW]
[ROW][C]Raw Input[/C][C]view raw input (R code) [/C][/ROW]
[ROW][C]Raw Output[/C][C]view raw output of R engine [/C][/ROW]
[ROW][C]Computing time[/C][C]2 seconds[/C][/ROW]
[ROW][C]R Server[/C][C]'Gwilym Jenkins' @ 72.249.127.135[/C][/ROW]
[/TABLE]
Source: https://freestatistics.org/blog/index.php?pk=107190&T=0

Globally Unique Identifier (entire table): ba.freestatistics.org/blog/index.php?pk=107190&T=0

As an alternative you can also use a QR Code:  

The GUIDs for individual cells are displayed in the table below:

Summary of computational transaction
Raw Inputview raw input (R code)
Raw Outputview raw output of R engine
Computing time2 seconds
R Server'Gwilym Jenkins' @ 72.249.127.135


Central Tendency - Ungrouped Data
MeasureValueS.E.Value/S.E.
Arithmetic Mean196.0138888888895.8871259855003333.2953446845983
Geometric Mean188.426710567266
Harmonic Mean179.131913955438
Quadratic Mean202.193423620937
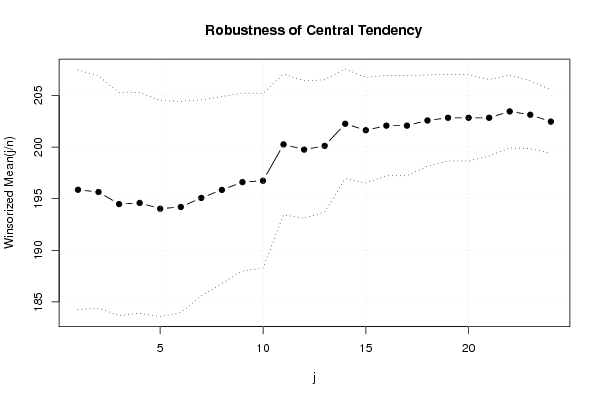
Winsorized Mean ( 1 / 24 )195.8611111111115.7984640442212433.7781022038597
Winsorized Mean ( 2 / 24 )195.6388888888895.6312864560472234.7414201738574
Winsorized Mean ( 3 / 24 )194.4722222222225.3990584954973536.0196546091149
Winsorized Mean ( 4 / 24 )194.5833333333335.3460364414959636.3976818083350
Winsorized Mean ( 5 / 24 )194.0277777777785.2294000133941737.1032579800379
Winsorized Mean ( 6 / 24 )194.1944444444445.1186485467918937.9386165448214
Winsorized Mean ( 7 / 24 )195.0694444444444.7483349519262341.0816520779167
Winsorized Mean ( 8 / 24 )195.8472222222224.5232688144407943.297719029426
Winsorized Mean ( 9 / 24 )196.5972222222224.3078275973010145.6372075673123
Winsorized Mean ( 10 / 24 )196.7361111111114.2266107325664846.5470145133638
Winsorized Mean ( 11 / 24 )200.253.4057135781691758.7982504705078
Winsorized Mean ( 12 / 24 )199.753.3293843979756359.9960761879746
Winsorized Mean ( 13 / 24 )200.1111111111113.2033674791379962.4689837848263
Winsorized Mean ( 14 / 24 )202.252.6550325733540876.1760899017894
Winsorized Mean ( 15 / 24 )201.6252.5620192590769278.6976910051192
Winsorized Mean ( 16 / 24 )202.0694444444442.4268908209241383.2626843788131
Winsorized Mean ( 17 / 24 )202.0694444444442.4268908209241383.2626843788131
Winsorized Mean ( 18 / 24 )202.5694444444442.2070829916693691.781525755508
Winsorized Mean ( 19 / 24 )202.8333333333332.0944071884541796.8452240096823
Winsorized Mean ( 20 / 24 )202.8333333333332.0944071884541796.8452240096823
Winsorized Mean ( 21 / 24 )202.8333333333331.85074954151412109.595236299447
Winsorized Mean ( 22 / 24 )203.4444444444441.76924792480876114.989223156181
Winsorized Mean ( 23 / 24 )203.1251.63932234129049123.907906873335
Winsorized Mean ( 24 / 24 )202.4583333333331.54976618712043130.637985920647
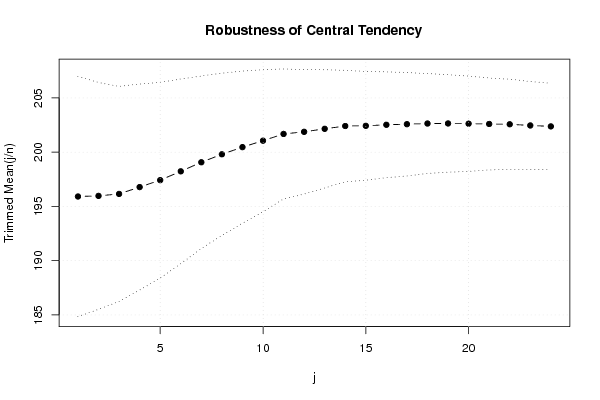
Trimmed Mean ( 1 / 24 )195.9142857142865.5375153017615635.3794572182875
Trimmed Mean ( 2 / 24 )195.9705882352945.2240819159826537.5129240672391
Trimmed Mean ( 3 / 24 )196.1515151515154.9577817819849639.5643704739625
Trimmed Mean ( 4 / 24 )196.781254.7463158618988641.4597881231768
Trimmed Mean ( 5 / 24 )197.4193548387104.5092623629837143.780853484888
Trimmed Mean ( 6 / 24 )198.2333333333334.2558279527124346.5792639025716
Trimmed Mean ( 7 / 24 )199.0689655172413.9752609192686650.0769558426532
Trimmed Mean ( 8 / 24 )199.8035714285713.7384818471320453.4451094317469
Trimmed Mean ( 9 / 24 )200.4629629629633.5064792740504257.1692992587984
Trimmed Mean ( 10 / 24 )201.0576923076923.2736450988825561.4170706459056
Trimmed Mean ( 11 / 24 )201.682.995021719794567.3384098242326
Trimmed Mean ( 12 / 24 )201.8752.8689807479163970.3647105846258
Trimmed Mean ( 13 / 24 )202.1521739130432.7243697833143174.2014447345384
Trimmed Mean ( 14 / 24 )202.4090909090912.5687827881105178.795720621429
Trimmed Mean ( 15 / 24 )202.4285714285712.5046166101215480.8221787759958
Trimmed Mean ( 16 / 24 )202.5252.4392588985917483.0272670592385
Trimmed Mean ( 17 / 24 )202.5789473684212.3822576699214485.0365390470551
Trimmed Mean ( 18 / 24 )202.6388888888892.3018807968315588.0318777444137
Trimmed Mean ( 19 / 24 )202.6470588235292.2467573595503690.1953466234932
Trimmed Mean ( 20 / 24 )202.6252.1954636147909692.292579405509
Trimmed Mean ( 21 / 24 )202.62.1170354461982495.69986197625
Trimmed Mean ( 22 / 24 )202.5714285714292.0736623606049997.68775882701
Trimmed Mean ( 23 / 24 )202.4615384615382.0261602710020299.923753001737
Trimmed Mean ( 24 / 24 )202.3751.98984059153243101.704126883925
Median203
Midrange199.5
Midmean - Weighted Average at Xnp201.236842105263
Midmean - Weighted Average at X(n+1)p202.638888888889
Midmean - Empirical Distribution Function201.236842105263
Midmean - Empirical Distribution Function - Averaging202.638888888889
Midmean - Empirical Distribution Function - Interpolation202.638888888889
Midmean - Closest Observation201.236842105263
Midmean - True Basic - Statistics Graphics Toolkit202.638888888889
Midmean - MS Excel (old versions)202.525
Number of observations72

\begin{tabular}{lllllllll}
\hline
Central Tendency - Ungrouped Data \tabularnewline
Measure & Value & S.E. & Value/S.E. \tabularnewline
Arithmetic Mean & 196.013888888889 & 5.88712598550033 & 33.2953446845983 \tabularnewline
Geometric Mean & 188.426710567266 &  &  \tabularnewline
Harmonic Mean & 179.131913955438 &  &  \tabularnewline
Quadratic Mean & 202.193423620937 &  &  \tabularnewline
Winsorized Mean ( 1 / 24 ) & 195.861111111111 & 5.79846404422124 & 33.7781022038597 \tabularnewline
Winsorized Mean ( 2 / 24 ) & 195.638888888889 & 5.63128645604722 & 34.7414201738574 \tabularnewline
Winsorized Mean ( 3 / 24 ) & 194.472222222222 & 5.39905849549735 & 36.0196546091149 \tabularnewline
Winsorized Mean ( 4 / 24 ) & 194.583333333333 & 5.34603644149596 & 36.3976818083350 \tabularnewline
Winsorized Mean ( 5 / 24 ) & 194.027777777778 & 5.22940001339417 & 37.1032579800379 \tabularnewline
Winsorized Mean ( 6 / 24 ) & 194.194444444444 & 5.11864854679189 & 37.9386165448214 \tabularnewline
Winsorized Mean ( 7 / 24 ) & 195.069444444444 & 4.74833495192623 & 41.0816520779167 \tabularnewline
Winsorized Mean ( 8 / 24 ) & 195.847222222222 & 4.52326881444079 & 43.297719029426 \tabularnewline
Winsorized Mean ( 9 / 24 ) & 196.597222222222 & 4.30782759730101 & 45.6372075673123 \tabularnewline
Winsorized Mean ( 10 / 24 ) & 196.736111111111 & 4.22661073256648 & 46.5470145133638 \tabularnewline
Winsorized Mean ( 11 / 24 ) & 200.25 & 3.40571357816917 & 58.7982504705078 \tabularnewline
Winsorized Mean ( 12 / 24 ) & 199.75 & 3.32938439797563 & 59.9960761879746 \tabularnewline
Winsorized Mean ( 13 / 24 ) & 200.111111111111 & 3.20336747913799 & 62.4689837848263 \tabularnewline
Winsorized Mean ( 14 / 24 ) & 202.25 & 2.65503257335408 & 76.1760899017894 \tabularnewline
Winsorized Mean ( 15 / 24 ) & 201.625 & 2.56201925907692 & 78.6976910051192 \tabularnewline
Winsorized Mean ( 16 / 24 ) & 202.069444444444 & 2.42689082092413 & 83.2626843788131 \tabularnewline
Winsorized Mean ( 17 / 24 ) & 202.069444444444 & 2.42689082092413 & 83.2626843788131 \tabularnewline
Winsorized Mean ( 18 / 24 ) & 202.569444444444 & 2.20708299166936 & 91.781525755508 \tabularnewline
Winsorized Mean ( 19 / 24 ) & 202.833333333333 & 2.09440718845417 & 96.8452240096823 \tabularnewline
Winsorized Mean ( 20 / 24 ) & 202.833333333333 & 2.09440718845417 & 96.8452240096823 \tabularnewline
Winsorized Mean ( 21 / 24 ) & 202.833333333333 & 1.85074954151412 & 109.595236299447 \tabularnewline
Winsorized Mean ( 22 / 24 ) & 203.444444444444 & 1.76924792480876 & 114.989223156181 \tabularnewline
Winsorized Mean ( 23 / 24 ) & 203.125 & 1.63932234129049 & 123.907906873335 \tabularnewline
Winsorized Mean ( 24 / 24 ) & 202.458333333333 & 1.54976618712043 & 130.637985920647 \tabularnewline
Trimmed Mean ( 1 / 24 ) & 195.914285714286 & 5.53751530176156 & 35.3794572182875 \tabularnewline
Trimmed Mean ( 2 / 24 ) & 195.970588235294 & 5.22408191598265 & 37.5129240672391 \tabularnewline
Trimmed Mean ( 3 / 24 ) & 196.151515151515 & 4.95778178198496 & 39.5643704739625 \tabularnewline
Trimmed Mean ( 4 / 24 ) & 196.78125 & 4.74631586189886 & 41.4597881231768 \tabularnewline
Trimmed Mean ( 5 / 24 ) & 197.419354838710 & 4.50926236298371 & 43.780853484888 \tabularnewline
Trimmed Mean ( 6 / 24 ) & 198.233333333333 & 4.25582795271243 & 46.5792639025716 \tabularnewline
Trimmed Mean ( 7 / 24 ) & 199.068965517241 & 3.97526091926866 & 50.0769558426532 \tabularnewline
Trimmed Mean ( 8 / 24 ) & 199.803571428571 & 3.73848184713204 & 53.4451094317469 \tabularnewline
Trimmed Mean ( 9 / 24 ) & 200.462962962963 & 3.50647927405042 & 57.1692992587984 \tabularnewline
Trimmed Mean ( 10 / 24 ) & 201.057692307692 & 3.27364509888255 & 61.4170706459056 \tabularnewline
Trimmed Mean ( 11 / 24 ) & 201.68 & 2.9950217197945 & 67.3384098242326 \tabularnewline
Trimmed Mean ( 12 / 24 ) & 201.875 & 2.86898074791639 & 70.3647105846258 \tabularnewline
Trimmed Mean ( 13 / 24 ) & 202.152173913043 & 2.72436978331431 & 74.2014447345384 \tabularnewline
Trimmed Mean ( 14 / 24 ) & 202.409090909091 & 2.56878278811051 & 78.795720621429 \tabularnewline
Trimmed Mean ( 15 / 24 ) & 202.428571428571 & 2.50461661012154 & 80.8221787759958 \tabularnewline
Trimmed Mean ( 16 / 24 ) & 202.525 & 2.43925889859174 & 83.0272670592385 \tabularnewline
Trimmed Mean ( 17 / 24 ) & 202.578947368421 & 2.38225766992144 & 85.0365390470551 \tabularnewline
Trimmed Mean ( 18 / 24 ) & 202.638888888889 & 2.30188079683155 & 88.0318777444137 \tabularnewline
Trimmed Mean ( 19 / 24 ) & 202.647058823529 & 2.24675735955036 & 90.1953466234932 \tabularnewline
Trimmed Mean ( 20 / 24 ) & 202.625 & 2.19546361479096 & 92.292579405509 \tabularnewline
Trimmed Mean ( 21 / 24 ) & 202.6 & 2.11703544619824 & 95.69986197625 \tabularnewline
Trimmed Mean ( 22 / 24 ) & 202.571428571429 & 2.07366236060499 & 97.68775882701 \tabularnewline
Trimmed Mean ( 23 / 24 ) & 202.461538461538 & 2.02616027100202 & 99.923753001737 \tabularnewline
Trimmed Mean ( 24 / 24 ) & 202.375 & 1.98984059153243 & 101.704126883925 \tabularnewline
Median & 203 &  &  \tabularnewline
Midrange & 199.5 &  &  \tabularnewline
Midmean - Weighted Average at Xnp & 201.236842105263 &  &  \tabularnewline
Midmean - Weighted Average at X(n+1)p & 202.638888888889 &  &  \tabularnewline
Midmean - Empirical Distribution Function & 201.236842105263 &  &  \tabularnewline
Midmean - Empirical Distribution Function - Averaging & 202.638888888889 &  &  \tabularnewline
Midmean - Empirical Distribution Function - Interpolation & 202.638888888889 &  &  \tabularnewline
Midmean - Closest Observation & 201.236842105263 &  &  \tabularnewline
Midmean - True Basic - Statistics Graphics Toolkit & 202.638888888889 &  &  \tabularnewline
Midmean - MS Excel (old versions) & 202.525 &  &  \tabularnewline
Number of observations & 72 &  &  \tabularnewline
\hline
\end{tabular}
%Source: https://freestatistics.org/blog/index.php?pk=107190&T=1

[TABLE]
[ROW][C]Central Tendency - Ungrouped Data[/C][/ROW]
[ROW][C]Measure[/C][C]Value[/C][C]S.E.[/C][C]Value/S.E.[/C][/ROW]
[ROW][C]Arithmetic Mean[/C][C]196.013888888889[/C][C]5.88712598550033[/C][C]33.2953446845983[/C][/ROW]
[ROW][C]Geometric Mean[/C][C]188.426710567266[/C][C][/C][C][/C][/ROW]
[ROW][C]Harmonic Mean[/C][C]179.131913955438[/C][C][/C][C][/C][/ROW]
[ROW][C]Quadratic Mean[/C][C]202.193423620937[/C][C][/C][C][/C][/ROW]
[ROW][C]Winsorized Mean ( 1 / 24 )[/C][C]195.861111111111[/C][C]5.79846404422124[/C][C]33.7781022038597[/C][/ROW]
[ROW][C]Winsorized Mean ( 2 / 24 )[/C][C]195.638888888889[/C][C]5.63128645604722[/C][C]34.7414201738574[/C][/ROW]
[ROW][C]Winsorized Mean ( 3 / 24 )[/C][C]194.472222222222[/C][C]5.39905849549735[/C][C]36.0196546091149[/C][/ROW]
[ROW][C]Winsorized Mean ( 4 / 24 )[/C][C]194.583333333333[/C][C]5.34603644149596[/C][C]36.3976818083350[/C][/ROW]
[ROW][C]Winsorized Mean ( 5 / 24 )[/C][C]194.027777777778[/C][C]5.22940001339417[/C][C]37.1032579800379[/C][/ROW]
[ROW][C]Winsorized Mean ( 6 / 24 )[/C][C]194.194444444444[/C][C]5.11864854679189[/C][C]37.9386165448214[/C][/ROW]
[ROW][C]Winsorized Mean ( 7 / 24 )[/C][C]195.069444444444[/C][C]4.74833495192623[/C][C]41.0816520779167[/C][/ROW]
[ROW][C]Winsorized Mean ( 8 / 24 )[/C][C]195.847222222222[/C][C]4.52326881444079[/C][C]43.297719029426[/C][/ROW]
[ROW][C]Winsorized Mean ( 9 / 24 )[/C][C]196.597222222222[/C][C]4.30782759730101[/C][C]45.6372075673123[/C][/ROW]
[ROW][C]Winsorized Mean ( 10 / 24 )[/C][C]196.736111111111[/C][C]4.22661073256648[/C][C]46.5470145133638[/C][/ROW]
[ROW][C]Winsorized Mean ( 11 / 24 )[/C][C]200.25[/C][C]3.40571357816917[/C][C]58.7982504705078[/C][/ROW]
[ROW][C]Winsorized Mean ( 12 / 24 )[/C][C]199.75[/C][C]3.32938439797563[/C][C]59.9960761879746[/C][/ROW]
[ROW][C]Winsorized Mean ( 13 / 24 )[/C][C]200.111111111111[/C][C]3.20336747913799[/C][C]62.4689837848263[/C][/ROW]
[ROW][C]Winsorized Mean ( 14 / 24 )[/C][C]202.25[/C][C]2.65503257335408[/C][C]76.1760899017894[/C][/ROW]
[ROW][C]Winsorized Mean ( 15 / 24 )[/C][C]201.625[/C][C]2.56201925907692[/C][C]78.6976910051192[/C][/ROW]
[ROW][C]Winsorized Mean ( 16 / 24 )[/C][C]202.069444444444[/C][C]2.42689082092413[/C][C]83.2626843788131[/C][/ROW]
[ROW][C]Winsorized Mean ( 17 / 24 )[/C][C]202.069444444444[/C][C]2.42689082092413[/C][C]83.2626843788131[/C][/ROW]
[ROW][C]Winsorized Mean ( 18 / 24 )[/C][C]202.569444444444[/C][C]2.20708299166936[/C][C]91.781525755508[/C][/ROW]
[ROW][C]Winsorized Mean ( 19 / 24 )[/C][C]202.833333333333[/C][C]2.09440718845417[/C][C]96.8452240096823[/C][/ROW]
[ROW][C]Winsorized Mean ( 20 / 24 )[/C][C]202.833333333333[/C][C]2.09440718845417[/C][C]96.8452240096823[/C][/ROW]
[ROW][C]Winsorized Mean ( 21 / 24 )[/C][C]202.833333333333[/C][C]1.85074954151412[/C][C]109.595236299447[/C][/ROW]
[ROW][C]Winsorized Mean ( 22 / 24 )[/C][C]203.444444444444[/C][C]1.76924792480876[/C][C]114.989223156181[/C][/ROW]
[ROW][C]Winsorized Mean ( 23 / 24 )[/C][C]203.125[/C][C]1.63932234129049[/C][C]123.907906873335[/C][/ROW]
[ROW][C]Winsorized Mean ( 24 / 24 )[/C][C]202.458333333333[/C][C]1.54976618712043[/C][C]130.637985920647[/C][/ROW]
[ROW][C]Trimmed Mean ( 1 / 24 )[/C][C]195.914285714286[/C][C]5.53751530176156[/C][C]35.3794572182875[/C][/ROW]
[ROW][C]Trimmed Mean ( 2 / 24 )[/C][C]195.970588235294[/C][C]5.22408191598265[/C][C]37.5129240672391[/C][/ROW]
[ROW][C]Trimmed Mean ( 3 / 24 )[/C][C]196.151515151515[/C][C]4.95778178198496[/C][C]39.5643704739625[/C][/ROW]
[ROW][C]Trimmed Mean ( 4 / 24 )[/C][C]196.78125[/C][C]4.74631586189886[/C][C]41.4597881231768[/C][/ROW]
[ROW][C]Trimmed Mean ( 5 / 24 )[/C][C]197.419354838710[/C][C]4.50926236298371[/C][C]43.780853484888[/C][/ROW]
[ROW][C]Trimmed Mean ( 6 / 24 )[/C][C]198.233333333333[/C][C]4.25582795271243[/C][C]46.5792639025716[/C][/ROW]
[ROW][C]Trimmed Mean ( 7 / 24 )[/C][C]199.068965517241[/C][C]3.97526091926866[/C][C]50.0769558426532[/C][/ROW]
[ROW][C]Trimmed Mean ( 8 / 24 )[/C][C]199.803571428571[/C][C]3.73848184713204[/C][C]53.4451094317469[/C][/ROW]
[ROW][C]Trimmed Mean ( 9 / 24 )[/C][C]200.462962962963[/C][C]3.50647927405042[/C][C]57.1692992587984[/C][/ROW]
[ROW][C]Trimmed Mean ( 10 / 24 )[/C][C]201.057692307692[/C][C]3.27364509888255[/C][C]61.4170706459056[/C][/ROW]
[ROW][C]Trimmed Mean ( 11 / 24 )[/C][C]201.68[/C][C]2.9950217197945[/C][C]67.3384098242326[/C][/ROW]
[ROW][C]Trimmed Mean ( 12 / 24 )[/C][C]201.875[/C][C]2.86898074791639[/C][C]70.3647105846258[/C][/ROW]
[ROW][C]Trimmed Mean ( 13 / 24 )[/C][C]202.152173913043[/C][C]2.72436978331431[/C][C]74.2014447345384[/C][/ROW]
[ROW][C]Trimmed Mean ( 14 / 24 )[/C][C]202.409090909091[/C][C]2.56878278811051[/C][C]78.795720621429[/C][/ROW]
[ROW][C]Trimmed Mean ( 15 / 24 )[/C][C]202.428571428571[/C][C]2.50461661012154[/C][C]80.8221787759958[/C][/ROW]
[ROW][C]Trimmed Mean ( 16 / 24 )[/C][C]202.525[/C][C]2.43925889859174[/C][C]83.0272670592385[/C][/ROW]
[ROW][C]Trimmed Mean ( 17 / 24 )[/C][C]202.578947368421[/C][C]2.38225766992144[/C][C]85.0365390470551[/C][/ROW]
[ROW][C]Trimmed Mean ( 18 / 24 )[/C][C]202.638888888889[/C][C]2.30188079683155[/C][C]88.0318777444137[/C][/ROW]
[ROW][C]Trimmed Mean ( 19 / 24 )[/C][C]202.647058823529[/C][C]2.24675735955036[/C][C]90.1953466234932[/C][/ROW]
[ROW][C]Trimmed Mean ( 20 / 24 )[/C][C]202.625[/C][C]2.19546361479096[/C][C]92.292579405509[/C][/ROW]
[ROW][C]Trimmed Mean ( 21 / 24 )[/C][C]202.6[/C][C]2.11703544619824[/C][C]95.69986197625[/C][/ROW]
[ROW][C]Trimmed Mean ( 22 / 24 )[/C][C]202.571428571429[/C][C]2.07366236060499[/C][C]97.68775882701[/C][/ROW]
[ROW][C]Trimmed Mean ( 23 / 24 )[/C][C]202.461538461538[/C][C]2.02616027100202[/C][C]99.923753001737[/C][/ROW]
[ROW][C]Trimmed Mean ( 24 / 24 )[/C][C]202.375[/C][C]1.98984059153243[/C][C]101.704126883925[/C][/ROW]
[ROW][C]Median[/C][C]203[/C][C][/C][C][/C][/ROW]
[ROW][C]Midrange[/C][C]199.5[/C][C][/C][C][/C][/ROW]
[ROW][C]Midmean - Weighted Average at Xnp[/C][C]201.236842105263[/C][C][/C][C][/C][/ROW]
[ROW][C]Midmean - Weighted Average at X(n+1)p[/C][C]202.638888888889[/C][C][/C][C][/C][/ROW]
[ROW][C]Midmean - Empirical Distribution Function[/C][C]201.236842105263[/C][C][/C][C][/C][/ROW]
[ROW][C]Midmean - Empirical Distribution Function - Averaging[/C][C]202.638888888889[/C][C][/C][C][/C][/ROW]
[ROW][C]Midmean - Empirical Distribution Function - Interpolation[/C][C]202.638888888889[/C][C][/C][C][/C][/ROW]
[ROW][C]Midmean - Closest Observation[/C][C]201.236842105263[/C][C][/C][C][/C][/ROW]
[ROW][C]Midmean - True Basic - Statistics Graphics Toolkit[/C][C]202.638888888889[/C][C][/C][C][/C][/ROW]
[ROW][C]Midmean - MS Excel (old versions)[/C][C]202.525[/C][C][/C][C][/C][/ROW]
[ROW][C]Number of observations[/C][C]72[/C][C][/C][C][/C][/ROW]
[/TABLE]
Source: https://freestatistics.org/blog/index.php?pk=107190&T=1

Globally Unique Identifier (entire table): ba.freestatistics.org/blog/index.php?pk=107190&T=1

As an alternative you can also use a QR Code:  

The GUIDs for individual cells are displayed in the table below:

Central Tendency - Ungrouped Data
MeasureValueS.E.Value/S.E.
Arithmetic Mean196.0138888888895.8871259855003333.2953446845983
Geometric Mean188.426710567266
Harmonic Mean179.131913955438
Quadratic Mean202.193423620937
Winsorized Mean ( 1 / 24 )195.8611111111115.7984640442212433.7781022038597
Winsorized Mean ( 2 / 24 )195.6388888888895.6312864560472234.7414201738574
Winsorized Mean ( 3 / 24 )194.4722222222225.3990584954973536.0196546091149
Winsorized Mean ( 4 / 24 )194.5833333333335.3460364414959636.3976818083350
Winsorized Mean ( 5 / 24 )194.0277777777785.2294000133941737.1032579800379
Winsorized Mean ( 6 / 24 )194.1944444444445.1186485467918937.9386165448214
Winsorized Mean ( 7 / 24 )195.0694444444444.7483349519262341.0816520779167
Winsorized Mean ( 8 / 24 )195.8472222222224.5232688144407943.297719029426
Winsorized Mean ( 9 / 24 )196.5972222222224.3078275973010145.6372075673123
Winsorized Mean ( 10 / 24 )196.7361111111114.2266107325664846.5470145133638
Winsorized Mean ( 11 / 24 )200.253.4057135781691758.7982504705078
Winsorized Mean ( 12 / 24 )199.753.3293843979756359.9960761879746
Winsorized Mean ( 13 / 24 )200.1111111111113.2033674791379962.4689837848263
Winsorized Mean ( 14 / 24 )202.252.6550325733540876.1760899017894
Winsorized Mean ( 15 / 24 )201.6252.5620192590769278.6976910051192
Winsorized Mean ( 16 / 24 )202.0694444444442.4268908209241383.2626843788131
Winsorized Mean ( 17 / 24 )202.0694444444442.4268908209241383.2626843788131
Winsorized Mean ( 18 / 24 )202.5694444444442.2070829916693691.781525755508
Winsorized Mean ( 19 / 24 )202.8333333333332.0944071884541796.8452240096823
Winsorized Mean ( 20 / 24 )202.8333333333332.0944071884541796.8452240096823
Winsorized Mean ( 21 / 24 )202.8333333333331.85074954151412109.595236299447
Winsorized Mean ( 22 / 24 )203.4444444444441.76924792480876114.989223156181
Winsorized Mean ( 23 / 24 )203.1251.63932234129049123.907906873335
Winsorized Mean ( 24 / 24 )202.4583333333331.54976618712043130.637985920647
Trimmed Mean ( 1 / 24 )195.9142857142865.5375153017615635.3794572182875
Trimmed Mean ( 2 / 24 )195.9705882352945.2240819159826537.5129240672391
Trimmed Mean ( 3 / 24 )196.1515151515154.9577817819849639.5643704739625
Trimmed Mean ( 4 / 24 )196.781254.7463158618988641.4597881231768
Trimmed Mean ( 5 / 24 )197.4193548387104.5092623629837143.780853484888
Trimmed Mean ( 6 / 24 )198.2333333333334.2558279527124346.5792639025716
Trimmed Mean ( 7 / 24 )199.0689655172413.9752609192686650.0769558426532
Trimmed Mean ( 8 / 24 )199.8035714285713.7384818471320453.4451094317469
Trimmed Mean ( 9 / 24 )200.4629629629633.5064792740504257.1692992587984
Trimmed Mean ( 10 / 24 )201.0576923076923.2736450988825561.4170706459056
Trimmed Mean ( 11 / 24 )201.682.995021719794567.3384098242326
Trimmed Mean ( 12 / 24 )201.8752.8689807479163970.3647105846258
Trimmed Mean ( 13 / 24 )202.1521739130432.7243697833143174.2014447345384
Trimmed Mean ( 14 / 24 )202.4090909090912.5687827881105178.795720621429
Trimmed Mean ( 15 / 24 )202.4285714285712.5046166101215480.8221787759958
Trimmed Mean ( 16 / 24 )202.5252.4392588985917483.0272670592385
Trimmed Mean ( 17 / 24 )202.5789473684212.3822576699214485.0365390470551
Trimmed Mean ( 18 / 24 )202.6388888888892.3018807968315588.0318777444137
Trimmed Mean ( 19 / 24 )202.6470588235292.2467573595503690.1953466234932
Trimmed Mean ( 20 / 24 )202.6252.1954636147909692.292579405509
Trimmed Mean ( 21 / 24 )202.62.1170354461982495.69986197625
Trimmed Mean ( 22 / 24 )202.5714285714292.0736623606049997.68775882701
Trimmed Mean ( 23 / 24 )202.4615384615382.0261602710020299.923753001737
Trimmed Mean ( 24 / 24 )202.3751.98984059153243101.704126883925
Median203
Midrange199.5
Midmean - Weighted Average at Xnp201.236842105263
Midmean - Weighted Average at X(n+1)p202.638888888889
Midmean - Empirical Distribution Function201.236842105263
Midmean - Empirical Distribution Function - Averaging202.638888888889
Midmean - Empirical Distribution Function - Interpolation202.638888888889
Midmean - Closest Observation201.236842105263
Midmean - True Basic - Statistics Graphics Toolkit202.638888888889
Midmean - MS Excel (old versions)202.525
Number of observations72


Parameters (Session):
Parameters (R input):
R code (references can be found in the software module):
geomean <- function(x) {
return(exp(mean(log(x))))
}
harmean <- function(x) {
return(1/mean(1/x))
}
quamean <- function(x) {
return(sqrt(mean(x*x)))
}
winmean <- function(x) {
x <-sort(x[!is.na(x)])
n<-length(x)
denom <- 3
nodenom <- n/denom
if (nodenom>40) denom <- n/40
sqrtn = sqrt(n)
roundnodenom = floor(nodenom)
win <- array(NA,dim=c(roundnodenom,2))
for (j in 1:roundnodenom) {
win[j,1] <- (j*x[j+1]+sum(x[(j+1):(n-j)])+j*x[n-j])/n
win[j,2] <- sd(c(rep(x[j+1],j),x[(j+1):(n-j)],rep(x[n-j],j)))/sqrtn
}
return(win)
}
trimean <- function(x) {
x <-sort(x[!is.na(x)])
n<-length(x)
denom <- 3
nodenom <- n/denom
if (nodenom>40) denom <- n/40
sqrtn = sqrt(n)
roundnodenom = floor(nodenom)
tri <- array(NA,dim=c(roundnodenom,2))
for (j in 1:roundnodenom) {
tri[j,1] <- mean(x,trim=j/n)
tri[j,2] <- sd(x[(j+1):(n-j)]) / sqrt(n-j*2)
}
return(tri)
}
midrange <- function(x) {
return((max(x)+min(x))/2)
}
q1 <- function(data,n,p,i,f) {
np <- n*p;
i <<- floor(np)
f <<- np - i
qvalue <- (1-f)*data[i] + f*data[i+1]
}
q2 <- function(data,n,p,i,f) {
np <- (n+1)*p
i <<- floor(np)
f <<- np - i
qvalue <- (1-f)*data[i] + f*data[i+1]
}
q3 <- function(data,n,p,i,f) {
np <- n*p
i <<- floor(np)
f <<- np - i
if (f==0) {
qvalue <- data[i]
} else {
qvalue <- data[i+1]
}
}
q4 <- function(data,n,p,i,f) {
np <- n*p
i <<- floor(np)
f <<- np - i
if (f==0) {
qvalue <- (data[i]+data[i+1])/2
} else {
qvalue <- data[i+1]
}
}
q5 <- function(data,n,p,i,f) {
np <- (n-1)*p
i <<- floor(np)
f <<- np - i
if (f==0) {
qvalue <- data[i+1]
} else {
qvalue <- data[i+1] + f*(data[i+2]-data[i+1])
}
}
q6 <- function(data,n,p,i,f) {
np <- n*p+0.5
i <<- floor(np)
f <<- np - i
qvalue <- data[i]
}
q7 <- function(data,n,p,i,f) {
np <- (n+1)*p
i <<- floor(np)
f <<- np - i
if (f==0) {
qvalue <- data[i]
} else {
qvalue <- f*data[i] + (1-f)*data[i+1]
}
}
q8 <- function(data,n,p,i,f) {
np <- (n+1)*p
i <<- floor(np)
f <<- np - i
if (f==0) {
qvalue <- data[i]
} else {
if (f == 0.5) {
qvalue <- (data[i]+data[i+1])/2
} else {
if (f < 0.5) {
qvalue <- data[i]
} else {
qvalue <- data[i+1]
}
}
}
}
midmean <- function(x,def) {
x <-sort(x[!is.na(x)])
n<-length(x)
if (def==1) {
qvalue1 <- q1(x,n,0.25,i,f)
qvalue3 <- q1(x,n,0.75,i,f)
}
if (def==2) {
qvalue1 <- q2(x,n,0.25,i,f)
qvalue3 <- q2(x,n,0.75,i,f)
}
if (def==3) {
qvalue1 <- q3(x,n,0.25,i,f)
qvalue3 <- q3(x,n,0.75,i,f)
}
if (def==4) {
qvalue1 <- q4(x,n,0.25,i,f)
qvalue3 <- q4(x,n,0.75,i,f)
}
if (def==5) {
qvalue1 <- q5(x,n,0.25,i,f)
qvalue3 <- q5(x,n,0.75,i,f)
}
if (def==6) {
qvalue1 <- q6(x,n,0.25,i,f)
qvalue3 <- q6(x,n,0.75,i,f)
}
if (def==7) {
qvalue1 <- q7(x,n,0.25,i,f)
qvalue3 <- q7(x,n,0.75,i,f)
}
if (def==8) {
qvalue1 <- q8(x,n,0.25,i,f)
qvalue3 <- q8(x,n,0.75,i,f)
}
midm <- 0
myn <- 0
roundno4 <- round(n/4)
round3no4 <- round(3*n/4)
for (i in 1:n) {
if ((x[i]>=qvalue1) & (x[i]<=qvalue3)){
midm = midm + x[i]
myn = myn + 1
}
}
midm = midm / myn
return(midm)
}
(arm <- mean(x))
sqrtn <- sqrt(length(x))
(armse <- sd(x) / sqrtn)
(armose <- arm / armse)
(geo <- geomean(x))
(har <- harmean(x))
(qua <- quamean(x))
(win <- winmean(x))
(tri <- trimean(x))
(midr <- midrange(x))
midm <- array(NA,dim=8)
for (j in 1:8) midm[j] <- midmean(x,j)
midm
bitmap(file='test1.png')
lb <- win[,1] - 2*win[,2]
ub <- win[,1] + 2*win[,2]
if ((ylimmin == '') | (ylimmax == '')) plot(win[,1],type='b',main=main, xlab='j', pch=19, ylab='Winsorized Mean(j/n)', ylim=c(min(lb),max(ub))) else plot(win[,1],type='l',main=main, xlab='j', pch=19, ylab='Winsorized Mean(j/n)', ylim=c(ylimmin,ylimmax))
lines(ub,lty=3)
lines(lb,lty=3)
grid()
dev.off()
bitmap(file='test2.png')
lb <- tri[,1] - 2*tri[,2]
ub <- tri[,1] + 2*tri[,2]
if ((ylimmin == '') | (ylimmax == '')) plot(tri[,1],type='b',main=main, xlab='j', pch=19, ylab='Trimmed Mean(j/n)', ylim=c(min(lb),max(ub))) else plot(tri[,1],type='l',main=main, xlab='j', pch=19, ylab='Trimmed Mean(j/n)', ylim=c(ylimmin,ylimmax))
lines(ub,lty=3)
lines(lb,lty=3)
grid()
dev.off()
load(file='createtable')
a<-table.start()
a<-table.row.start(a)
a<-table.element(a,'Central Tendency - Ungrouped Data',4,TRUE)
a<-table.row.end(a)
a<-table.row.start(a)
a<-table.element(a,'Measure',header=TRUE)
a<-table.element(a,'Value',header=TRUE)
a<-table.element(a,'S.E.',header=TRUE)
a<-table.element(a,'Value/S.E.',header=TRUE)
a<-table.row.end(a)
a<-table.row.start(a)
a<-table.element(a,hyperlink('arithmetic_mean.htm', 'Arithmetic Mean', 'click to view the definition of the Arithmetic Mean'),header=TRUE)
a<-table.element(a,arm)
a<-table.element(a,hyperlink('arithmetic_mean_standard_error.htm', armse, 'click to view the definition of the Standard Error of the Arithmetic Mean'))
a<-table.element(a,armose)
a<-table.row.end(a)
a<-table.row.start(a)
a<-table.element(a,hyperlink('geometric_mean.htm', 'Geometric Mean', 'click to view the definition of the Geometric Mean'),header=TRUE)
a<-table.element(a,geo)
a<-table.element(a,'')
a<-table.row.end(a)
a<-table.row.start(a)
a<-table.element(a,hyperlink('harmonic_mean.htm', 'Harmonic Mean', 'click to view the definition of the Harmonic Mean'),header=TRUE)
a<-table.element(a,har)
a<-table.element(a,'')
a<-table.row.end(a)
a<-table.row.start(a)
a<-table.element(a,hyperlink('quadratic_mean.htm', 'Quadratic Mean', 'click to view the definition of the Quadratic Mean'),header=TRUE)
a<-table.element(a,qua)
a<-table.element(a,'')
a<-table.row.end(a)
for (j in 1:length(win[,1])) {
a<-table.row.start(a)
mylabel <- paste('Winsorized Mean (',j)
mylabel <- paste(mylabel,'/')
mylabel <- paste(mylabel,length(win[,1]))
mylabel <- paste(mylabel,')')
a<-table.element(a,hyperlink('winsorized_mean.htm', mylabel, 'click to view the definition of the Winsorized Mean'),header=TRUE)
a<-table.element(a,win[j,1])
a<-table.element(a,win[j,2])
a<-table.element(a,win[j,1]/win[j,2])
a<-table.row.end(a)
}
for (j in 1:length(tri[,1])) {
a<-table.row.start(a)
mylabel <- paste('Trimmed Mean (',j)
mylabel <- paste(mylabel,'/')
mylabel <- paste(mylabel,length(tri[,1]))
mylabel <- paste(mylabel,')')
a<-table.element(a,hyperlink('arithmetic_mean.htm', mylabel, 'click to view the definition of the Trimmed Mean'),header=TRUE)
a<-table.element(a,tri[j,1])
a<-table.element(a,tri[j,2])
a<-table.element(a,tri[j,1]/tri[j,2])
a<-table.row.end(a)
}
a<-table.row.start(a)
a<-table.element(a,hyperlink('median_1.htm', 'Median', 'click to view the definition of the Median'),header=TRUE)
a<-table.element(a,median(x))
a<-table.element(a,'')
a<-table.row.end(a)
a<-table.row.start(a)
a<-table.element(a,hyperlink('midrange.htm', 'Midrange', 'click to view the definition of the Midrange'),header=TRUE)
a<-table.element(a,midr)
a<-table.element(a,'')
a<-table.row.end(a)
a<-table.row.start(a)
mymid <- hyperlink('midmean.htm', 'Midmean', 'click to view the definition of the Midmean')
mylabel <- paste(mymid,hyperlink('method_1.htm','Weighted Average at Xnp',''),sep=' - ')
a<-table.element(a,mylabel,header=TRUE)
a<-table.element(a,midm[1])
a<-table.element(a,'')
a<-table.row.end(a)
a<-table.row.start(a)
mymid <- hyperlink('midmean.htm', 'Midmean', 'click to view the definition of the Midmean')
mylabel <- paste(mymid,hyperlink('method_2.htm','Weighted Average at X(n+1)p',''),sep=' - ')
a<-table.element(a,mylabel,header=TRUE)
a<-table.element(a,midm[2])
a<-table.element(a,'')
a<-table.row.end(a)
a<-table.row.start(a)
mymid <- hyperlink('midmean.htm', 'Midmean', 'click to view the definition of the Midmean')
mylabel <- paste(mymid,hyperlink('method_3.htm','Empirical Distribution Function',''),sep=' - ')
a<-table.element(a,mylabel,header=TRUE)
a<-table.element(a,midm[3])
a<-table.element(a,'')
a<-table.row.end(a)
a<-table.row.start(a)
mymid <- hyperlink('midmean.htm', 'Midmean', 'click to view the definition of the Midmean')
mylabel <- paste(mymid,hyperlink('method_4.htm','Empirical Distribution Function - Averaging',''),sep=' - ')
a<-table.element(a,mylabel,header=TRUE)
a<-table.element(a,midm[4])
a<-table.element(a,'')
a<-table.row.end(a)
a<-table.row.start(a)
mymid <- hyperlink('midmean.htm', 'Midmean', 'click to view the definition of the Midmean')
mylabel <- paste(mymid,hyperlink('method_5.htm','Empirical Distribution Function - Interpolation',''),sep=' - ')
a<-table.element(a,mylabel,header=TRUE)
a<-table.element(a,midm[5])
a<-table.element(a,'')
a<-table.row.end(a)
a<-table.row.start(a)
mymid <- hyperlink('midmean.htm', 'Midmean', 'click to view the definition of the Midmean')
mylabel <- paste(mymid,hyperlink('method_6.htm','Closest Observation',''),sep=' - ')
a<-table.element(a,mylabel,header=TRUE)
a<-table.element(a,midm[6])
a<-table.element(a,'')
a<-table.row.end(a)
a<-table.row.start(a)
mymid <- hyperlink('midmean.htm', 'Midmean', 'click to view the definition of the Midmean')
mylabel <- paste(mymid,hyperlink('method_7.htm','True Basic - Statistics Graphics Toolkit',''),sep=' - ')
a<-table.element(a,mylabel,header=TRUE)
a<-table.element(a,midm[7])
a<-table.element(a,'')
a<-table.row.end(a)
a<-table.row.start(a)
mymid <- hyperlink('midmean.htm', 'Midmean', 'click to view the definition of the Midmean')
mylabel <- paste(mymid,hyperlink('method_8.htm','MS Excel (old versions)',''),sep=' - ')
a<-table.element(a,mylabel,header=TRUE)
a<-table.element(a,midm[8])
a<-table.element(a,'')
a<-table.row.end(a)
a<-table.row.start(a)
a<-table.element(a,'Number of observations',header=TRUE)
a<-table.element(a,length(x))
a<-table.element(a,'')
a<-table.row.end(a)
a<-table.end(a)
table.save(a,file='mytable.tab')