Free Statistics

of Irreproducible Research!

Author's title

Author*The author of this computation has been verified*
R Software Modulerwasp_centraltendency.wasp
Title produced by softwareCentral Tendency
Date of computationThu, 09 Dec 2010 12:25:53 +0000
Cite this page as followsStatistical Computations at FreeStatistics.org, Office for Research Development and Education, URL https://freestatistics.org/blog/index.php?v=date/2010/Dec/09/t1291897452odo0uvp3tc26524.htm/, Retrieved Sun, 28 Apr 2024 21:27:50 +0000
Statistical Computations at FreeStatistics.org, Office for Research Development and Education, URL https://freestatistics.org/blog/index.php?pk=107188, Retrieved Sun, 28 Apr 2024 21:27:50 +0000
QR Codes:

Original text written by user:
IsPrivate?No (this computation is public)
User-defined keywords
Estimated Impact167
Family? (F = Feedback message, R = changed R code, M = changed R Module, P = changed Parameters, D = changed Data)
-     [Bivariate Data Series] [Bivariate dataset] [2008-01-05 23:51:08] [74be16979710d4c4e7c6647856088456]
F RMPD  [Univariate Explorative Data Analysis] [Colombia Coffee] [2008-01-07 14:21:11] [74be16979710d4c4e7c6647856088456]
F RMPD    [Univariate Data Series] [] [2009-10-14 08:30:28] [74be16979710d4c4e7c6647856088456]
- RMP       [Central Tendency] [WS 3: Part 1: Cen...] [2009-10-18 15:24:12] [8cf9233b7464ea02e32be3b30fdac052]
-  M D        [Central Tendency] [Paper: Central Te...] [2009-12-13 16:14:14] [8cf9233b7464ea02e32be3b30fdac052]
-    D            [Central Tendency] [Faillissementen V...] [2010-12-09 12:25:53] [8e16b01a5be2b3f7f3ad6418d9d6fd5b] [Current]
Feedback Forum

Post a new message
Dataseries X:
356
386
444
387
327
448
225
182
460
411
342
361
377
331
428
340
352
461
221
198
422
329
320
375
364
351
380
319
322
386
221
187
344
342
365
313
356
337
389
326
343
357
220
218
391
425
332
298
360
336
325
393
301
426
265
210
429
440
357
431
442
442
544
420
396
482
261
211
448
468
464
425


Summary of computational transaction
Raw Inputview raw input (R code)
Raw Outputview raw output of R engine
Computing time11 seconds
R Server'Gwilym Jenkins' @ 72.249.127.135

\begin{tabular}{lllllllll}
\hline
Summary of computational transaction \tabularnewline
Raw Input & view raw input (R code)  \tabularnewline
Raw Output & view raw output of R engine  \tabularnewline
Computing time & 11 seconds \tabularnewline
R Server & 'Gwilym Jenkins' @ 72.249.127.135 \tabularnewline
\hline
\end{tabular}
%Source: https://freestatistics.org/blog/index.php?pk=107188&T=0

[TABLE]
[ROW][C]Summary of computational transaction[/C][/ROW]
[ROW][C]Raw Input[/C][C]view raw input (R code) [/C][/ROW]
[ROW][C]Raw Output[/C][C]view raw output of R engine [/C][/ROW]
[ROW][C]Computing time[/C][C]11 seconds[/C][/ROW]
[ROW][C]R Server[/C][C]'Gwilym Jenkins' @ 72.249.127.135[/C][/ROW]
[/TABLE]
Source: https://freestatistics.org/blog/index.php?pk=107188&T=0

Globally Unique Identifier (entire table): ba.freestatistics.org/blog/index.php?pk=107188&T=0

As an alternative you can also use a QR Code:  

The GUIDs for individual cells are displayed in the table below:

Summary of computational transaction
Raw Inputview raw input (R code)
Raw Outputview raw output of R engine
Computing time11 seconds
R Server'Gwilym Jenkins' @ 72.249.127.135


Central Tendency - Ungrouped Data
MeasureValueS.E.Value/S.E.
Arithmetic Mean356.1805555555569.3665431630390738.0268952329249
Geometric Mean346.301555928549
Harmonic Mean335.132988739581
Quadratic Mean364.819913716952
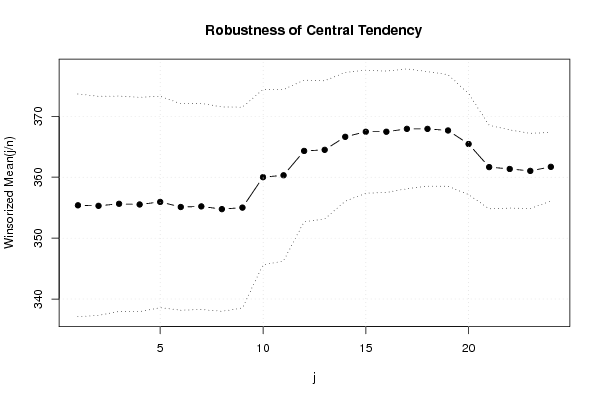
Winsorized Mean ( 1 / 24 )355.3888888888899.1424039883849538.8725863941690
Winsorized Mean ( 2 / 24 )355.3055555555568.9928383714658639.5098344792824
Winsorized Mean ( 3 / 24 )355.6388888888898.8441404692535740.2118091775293
Winsorized Mean ( 4 / 24 )355.5277777777788.8028300556326740.3878952031212
Winsorized Mean ( 5 / 24 )355.9444444444448.6804893581200541.0051127027166
Winsorized Mean ( 6 / 24 )355.1111111111118.4815125183660641.8688424195738
Winsorized Mean ( 7 / 24 )355.2083333333338.4597439791336641.9880712950026
Winsorized Mean ( 8 / 24 )354.7638888888898.3921281082029342.2734119778418
Winsorized Mean ( 9 / 24 )355.0138888888898.2431622219671643.0676819561811
Winsorized Mean ( 10 / 24 )360.0138888888897.1986808981057550.0110914742203
Winsorized Mean ( 11 / 24 )360.3194444444447.0322537272140551.2381177388478
Winsorized Mean ( 12 / 24 )364.3194444444445.8171413903191662.628603982489
Winsorized Mean ( 13 / 24 )364.55.6728770166752664.2531115919775
Winsorized Mean ( 14 / 24 )366.6388888888895.2902938241939869.3040691260186
Winsorized Mean ( 15 / 24 )367.4722222222225.0483566261985372.7904641909051
Winsorized Mean ( 16 / 24 )367.4722222222224.9822051191284573.7569436495832
Winsorized Mean ( 17 / 24 )367.9444444444444.9194564731236474.793718870088
Winsorized Mean ( 18 / 24 )367.9444444444444.6998272239115478.2889299786246
Winsorized Mean ( 19 / 24 )367.6805555555564.5807323558401480.2667623850118
Winsorized Mean ( 20 / 24 )365.4583333333334.150152131570688.0590209099222
Winsorized Mean ( 21 / 24 )361.6666666666673.42308740562397105.655107162167
Winsorized Mean ( 22 / 24 )361.3611111111113.21298626417628112.468924981151
Winsorized Mean ( 23 / 24 )361.0416666666673.08248862303028117.126682632081
Winsorized Mean ( 24 / 24 )361.7083333333332.81709219082028128.397762242922
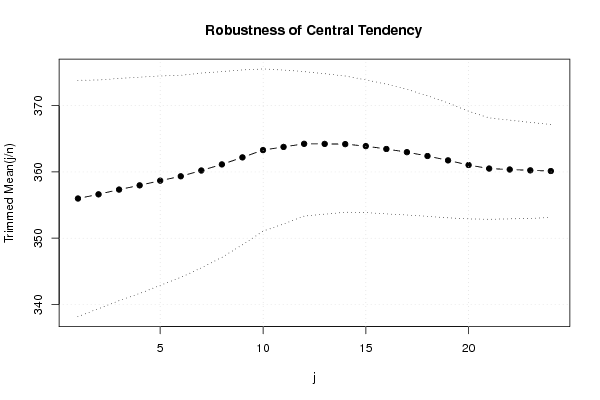
Trimmed Mean ( 1 / 24 )355.9857142857148.9033106843282839.9835215132192
Trimmed Mean ( 2 / 24 )356.6176470588248.6184111225522941.3785838233734
Trimmed Mean ( 3 / 24 )357.3333333333338.3736553617941642.6735180628177
Trimmed Mean ( 4 / 24 )357.968758.1481802656706843.9323552411043
Trimmed Mean ( 5 / 24 )358.6774193548397.8902028491888445.4585802431826
Trimmed Mean ( 6 / 24 )359.3333333333337.6166509043093747.1773405198377
Trimmed Mean ( 7 / 24 )360.2068965517247.3386560986157849.083495903244
Trimmed Mean ( 8 / 24 )361.1256.9998637509931251.5902898751086
Trimmed Mean ( 9 / 24 )362.1851851851856.5915619605989654.9467921791749
Trimmed Mean ( 10 / 24 )363.2884615384626.1128364641014959.4304237765766
Trimmed Mean ( 11 / 24 )363.765.8003208918972462.713771665315
Trimmed Mean ( 12 / 24 )364.2291666666675.4435562452457266.9101503240233
Trimmed Mean ( 13 / 24 )364.2173913043485.2935940726749368.8034228359908
Trimmed Mean ( 14 / 24 )364.1818181818185.1310801840809370.9756630410268
Trimmed Mean ( 15 / 24 )363.8809523809525.003854772023672.7201265742962
Trimmed Mean ( 16 / 24 )363.454.8856081163624574.3919674569815
Trimmed Mean ( 17 / 24 )362.9736842105264.7371127629328776.6233996055014
Trimmed Mean ( 18 / 24 )362.3888888888894.5436643099542579.7569679817605
Trimmed Mean ( 19 / 24 )361.7352941176474.3310652552403983.5210907247274
Trimmed Mean ( 20 / 24 )361.031254.0608984125854188.9042801172034
Trimmed Mean ( 21 / 24 )360.53.8200168501764794.3713114729706
Trimmed Mean ( 22 / 24 )360.3571428571433.7165489645090696.9601494015954
Trimmed Mean ( 23 / 24 )360.2307692307693.619310470797499.5302205039636
Trimmed Mean ( 24 / 24 )360.1253.50223143153048102.827299406260
Median357
Midrange363
Midmean - Weighted Average at Xnp361.297297297297
Midmean - Weighted Average at X(n+1)p362.388888888889
Midmean - Empirical Distribution Function361.297297297297
Midmean - Empirical Distribution Function - Averaging362.388888888889
Midmean - Empirical Distribution Function - Interpolation362.388888888889
Midmean - Closest Observation361.297297297297
Midmean - True Basic - Statistics Graphics Toolkit362.388888888889
Midmean - MS Excel (old versions)364.564102564103
Number of observations72

\begin{tabular}{lllllllll}
\hline
Central Tendency - Ungrouped Data \tabularnewline
Measure & Value & S.E. & Value/S.E. \tabularnewline
Arithmetic Mean & 356.180555555556 & 9.36654316303907 & 38.0268952329249 \tabularnewline
Geometric Mean & 346.301555928549 &  &  \tabularnewline
Harmonic Mean & 335.132988739581 &  &  \tabularnewline
Quadratic Mean & 364.819913716952 &  &  \tabularnewline
Winsorized Mean ( 1 / 24 ) & 355.388888888889 & 9.14240398838495 & 38.8725863941690 \tabularnewline
Winsorized Mean ( 2 / 24 ) & 355.305555555556 & 8.99283837146586 & 39.5098344792824 \tabularnewline
Winsorized Mean ( 3 / 24 ) & 355.638888888889 & 8.84414046925357 & 40.2118091775293 \tabularnewline
Winsorized Mean ( 4 / 24 ) & 355.527777777778 & 8.80283005563267 & 40.3878952031212 \tabularnewline
Winsorized Mean ( 5 / 24 ) & 355.944444444444 & 8.68048935812005 & 41.0051127027166 \tabularnewline
Winsorized Mean ( 6 / 24 ) & 355.111111111111 & 8.48151251836606 & 41.8688424195738 \tabularnewline
Winsorized Mean ( 7 / 24 ) & 355.208333333333 & 8.45974397913366 & 41.9880712950026 \tabularnewline
Winsorized Mean ( 8 / 24 ) & 354.763888888889 & 8.39212810820293 & 42.2734119778418 \tabularnewline
Winsorized Mean ( 9 / 24 ) & 355.013888888889 & 8.24316222196716 & 43.0676819561811 \tabularnewline
Winsorized Mean ( 10 / 24 ) & 360.013888888889 & 7.19868089810575 & 50.0110914742203 \tabularnewline
Winsorized Mean ( 11 / 24 ) & 360.319444444444 & 7.03225372721405 & 51.2381177388478 \tabularnewline
Winsorized Mean ( 12 / 24 ) & 364.319444444444 & 5.81714139031916 & 62.628603982489 \tabularnewline
Winsorized Mean ( 13 / 24 ) & 364.5 & 5.67287701667526 & 64.2531115919775 \tabularnewline
Winsorized Mean ( 14 / 24 ) & 366.638888888889 & 5.29029382419398 & 69.3040691260186 \tabularnewline
Winsorized Mean ( 15 / 24 ) & 367.472222222222 & 5.04835662619853 & 72.7904641909051 \tabularnewline
Winsorized Mean ( 16 / 24 ) & 367.472222222222 & 4.98220511912845 & 73.7569436495832 \tabularnewline
Winsorized Mean ( 17 / 24 ) & 367.944444444444 & 4.91945647312364 & 74.793718870088 \tabularnewline
Winsorized Mean ( 18 / 24 ) & 367.944444444444 & 4.69982722391154 & 78.2889299786246 \tabularnewline
Winsorized Mean ( 19 / 24 ) & 367.680555555556 & 4.58073235584014 & 80.2667623850118 \tabularnewline
Winsorized Mean ( 20 / 24 ) & 365.458333333333 & 4.1501521315706 & 88.0590209099222 \tabularnewline
Winsorized Mean ( 21 / 24 ) & 361.666666666667 & 3.42308740562397 & 105.655107162167 \tabularnewline
Winsorized Mean ( 22 / 24 ) & 361.361111111111 & 3.21298626417628 & 112.468924981151 \tabularnewline
Winsorized Mean ( 23 / 24 ) & 361.041666666667 & 3.08248862303028 & 117.126682632081 \tabularnewline
Winsorized Mean ( 24 / 24 ) & 361.708333333333 & 2.81709219082028 & 128.397762242922 \tabularnewline
Trimmed Mean ( 1 / 24 ) & 355.985714285714 & 8.90331068432828 & 39.9835215132192 \tabularnewline
Trimmed Mean ( 2 / 24 ) & 356.617647058824 & 8.61841112255229 & 41.3785838233734 \tabularnewline
Trimmed Mean ( 3 / 24 ) & 357.333333333333 & 8.37365536179416 & 42.6735180628177 \tabularnewline
Trimmed Mean ( 4 / 24 ) & 357.96875 & 8.14818026567068 & 43.9323552411043 \tabularnewline
Trimmed Mean ( 5 / 24 ) & 358.677419354839 & 7.89020284918884 & 45.4585802431826 \tabularnewline
Trimmed Mean ( 6 / 24 ) & 359.333333333333 & 7.61665090430937 & 47.1773405198377 \tabularnewline
Trimmed Mean ( 7 / 24 ) & 360.206896551724 & 7.33865609861578 & 49.083495903244 \tabularnewline
Trimmed Mean ( 8 / 24 ) & 361.125 & 6.99986375099312 & 51.5902898751086 \tabularnewline
Trimmed Mean ( 9 / 24 ) & 362.185185185185 & 6.59156196059896 & 54.9467921791749 \tabularnewline
Trimmed Mean ( 10 / 24 ) & 363.288461538462 & 6.11283646410149 & 59.4304237765766 \tabularnewline
Trimmed Mean ( 11 / 24 ) & 363.76 & 5.80032089189724 & 62.713771665315 \tabularnewline
Trimmed Mean ( 12 / 24 ) & 364.229166666667 & 5.44355624524572 & 66.9101503240233 \tabularnewline
Trimmed Mean ( 13 / 24 ) & 364.217391304348 & 5.29359407267493 & 68.8034228359908 \tabularnewline
Trimmed Mean ( 14 / 24 ) & 364.181818181818 & 5.13108018408093 & 70.9756630410268 \tabularnewline
Trimmed Mean ( 15 / 24 ) & 363.880952380952 & 5.0038547720236 & 72.7201265742962 \tabularnewline
Trimmed Mean ( 16 / 24 ) & 363.45 & 4.88560811636245 & 74.3919674569815 \tabularnewline
Trimmed Mean ( 17 / 24 ) & 362.973684210526 & 4.73711276293287 & 76.6233996055014 \tabularnewline
Trimmed Mean ( 18 / 24 ) & 362.388888888889 & 4.54366430995425 & 79.7569679817605 \tabularnewline
Trimmed Mean ( 19 / 24 ) & 361.735294117647 & 4.33106525524039 & 83.5210907247274 \tabularnewline
Trimmed Mean ( 20 / 24 ) & 361.03125 & 4.06089841258541 & 88.9042801172034 \tabularnewline
Trimmed Mean ( 21 / 24 ) & 360.5 & 3.82001685017647 & 94.3713114729706 \tabularnewline
Trimmed Mean ( 22 / 24 ) & 360.357142857143 & 3.71654896450906 & 96.9601494015954 \tabularnewline
Trimmed Mean ( 23 / 24 ) & 360.230769230769 & 3.6193104707974 & 99.5302205039636 \tabularnewline
Trimmed Mean ( 24 / 24 ) & 360.125 & 3.50223143153048 & 102.827299406260 \tabularnewline
Median & 357 &  &  \tabularnewline
Midrange & 363 &  &  \tabularnewline
Midmean - Weighted Average at Xnp & 361.297297297297 &  &  \tabularnewline
Midmean - Weighted Average at X(n+1)p & 362.388888888889 &  &  \tabularnewline
Midmean - Empirical Distribution Function & 361.297297297297 &  &  \tabularnewline
Midmean - Empirical Distribution Function - Averaging & 362.388888888889 &  &  \tabularnewline
Midmean - Empirical Distribution Function - Interpolation & 362.388888888889 &  &  \tabularnewline
Midmean - Closest Observation & 361.297297297297 &  &  \tabularnewline
Midmean - True Basic - Statistics Graphics Toolkit & 362.388888888889 &  &  \tabularnewline
Midmean - MS Excel (old versions) & 364.564102564103 &  &  \tabularnewline
Number of observations & 72 &  &  \tabularnewline
\hline
\end{tabular}
%Source: https://freestatistics.org/blog/index.php?pk=107188&T=1

[TABLE]
[ROW][C]Central Tendency - Ungrouped Data[/C][/ROW]
[ROW][C]Measure[/C][C]Value[/C][C]S.E.[/C][C]Value/S.E.[/C][/ROW]
[ROW][C]Arithmetic Mean[/C][C]356.180555555556[/C][C]9.36654316303907[/C][C]38.0268952329249[/C][/ROW]
[ROW][C]Geometric Mean[/C][C]346.301555928549[/C][C][/C][C][/C][/ROW]
[ROW][C]Harmonic Mean[/C][C]335.132988739581[/C][C][/C][C][/C][/ROW]
[ROW][C]Quadratic Mean[/C][C]364.819913716952[/C][C][/C][C][/C][/ROW]
[ROW][C]Winsorized Mean ( 1 / 24 )[/C][C]355.388888888889[/C][C]9.14240398838495[/C][C]38.8725863941690[/C][/ROW]
[ROW][C]Winsorized Mean ( 2 / 24 )[/C][C]355.305555555556[/C][C]8.99283837146586[/C][C]39.5098344792824[/C][/ROW]
[ROW][C]Winsorized Mean ( 3 / 24 )[/C][C]355.638888888889[/C][C]8.84414046925357[/C][C]40.2118091775293[/C][/ROW]
[ROW][C]Winsorized Mean ( 4 / 24 )[/C][C]355.527777777778[/C][C]8.80283005563267[/C][C]40.3878952031212[/C][/ROW]
[ROW][C]Winsorized Mean ( 5 / 24 )[/C][C]355.944444444444[/C][C]8.68048935812005[/C][C]41.0051127027166[/C][/ROW]
[ROW][C]Winsorized Mean ( 6 / 24 )[/C][C]355.111111111111[/C][C]8.48151251836606[/C][C]41.8688424195738[/C][/ROW]
[ROW][C]Winsorized Mean ( 7 / 24 )[/C][C]355.208333333333[/C][C]8.45974397913366[/C][C]41.9880712950026[/C][/ROW]
[ROW][C]Winsorized Mean ( 8 / 24 )[/C][C]354.763888888889[/C][C]8.39212810820293[/C][C]42.2734119778418[/C][/ROW]
[ROW][C]Winsorized Mean ( 9 / 24 )[/C][C]355.013888888889[/C][C]8.24316222196716[/C][C]43.0676819561811[/C][/ROW]
[ROW][C]Winsorized Mean ( 10 / 24 )[/C][C]360.013888888889[/C][C]7.19868089810575[/C][C]50.0110914742203[/C][/ROW]
[ROW][C]Winsorized Mean ( 11 / 24 )[/C][C]360.319444444444[/C][C]7.03225372721405[/C][C]51.2381177388478[/C][/ROW]
[ROW][C]Winsorized Mean ( 12 / 24 )[/C][C]364.319444444444[/C][C]5.81714139031916[/C][C]62.628603982489[/C][/ROW]
[ROW][C]Winsorized Mean ( 13 / 24 )[/C][C]364.5[/C][C]5.67287701667526[/C][C]64.2531115919775[/C][/ROW]
[ROW][C]Winsorized Mean ( 14 / 24 )[/C][C]366.638888888889[/C][C]5.29029382419398[/C][C]69.3040691260186[/C][/ROW]
[ROW][C]Winsorized Mean ( 15 / 24 )[/C][C]367.472222222222[/C][C]5.04835662619853[/C][C]72.7904641909051[/C][/ROW]
[ROW][C]Winsorized Mean ( 16 / 24 )[/C][C]367.472222222222[/C][C]4.98220511912845[/C][C]73.7569436495832[/C][/ROW]
[ROW][C]Winsorized Mean ( 17 / 24 )[/C][C]367.944444444444[/C][C]4.91945647312364[/C][C]74.793718870088[/C][/ROW]
[ROW][C]Winsorized Mean ( 18 / 24 )[/C][C]367.944444444444[/C][C]4.69982722391154[/C][C]78.2889299786246[/C][/ROW]
[ROW][C]Winsorized Mean ( 19 / 24 )[/C][C]367.680555555556[/C][C]4.58073235584014[/C][C]80.2667623850118[/C][/ROW]
[ROW][C]Winsorized Mean ( 20 / 24 )[/C][C]365.458333333333[/C][C]4.1501521315706[/C][C]88.0590209099222[/C][/ROW]
[ROW][C]Winsorized Mean ( 21 / 24 )[/C][C]361.666666666667[/C][C]3.42308740562397[/C][C]105.655107162167[/C][/ROW]
[ROW][C]Winsorized Mean ( 22 / 24 )[/C][C]361.361111111111[/C][C]3.21298626417628[/C][C]112.468924981151[/C][/ROW]
[ROW][C]Winsorized Mean ( 23 / 24 )[/C][C]361.041666666667[/C][C]3.08248862303028[/C][C]117.126682632081[/C][/ROW]
[ROW][C]Winsorized Mean ( 24 / 24 )[/C][C]361.708333333333[/C][C]2.81709219082028[/C][C]128.397762242922[/C][/ROW]
[ROW][C]Trimmed Mean ( 1 / 24 )[/C][C]355.985714285714[/C][C]8.90331068432828[/C][C]39.9835215132192[/C][/ROW]
[ROW][C]Trimmed Mean ( 2 / 24 )[/C][C]356.617647058824[/C][C]8.61841112255229[/C][C]41.3785838233734[/C][/ROW]
[ROW][C]Trimmed Mean ( 3 / 24 )[/C][C]357.333333333333[/C][C]8.37365536179416[/C][C]42.6735180628177[/C][/ROW]
[ROW][C]Trimmed Mean ( 4 / 24 )[/C][C]357.96875[/C][C]8.14818026567068[/C][C]43.9323552411043[/C][/ROW]
[ROW][C]Trimmed Mean ( 5 / 24 )[/C][C]358.677419354839[/C][C]7.89020284918884[/C][C]45.4585802431826[/C][/ROW]
[ROW][C]Trimmed Mean ( 6 / 24 )[/C][C]359.333333333333[/C][C]7.61665090430937[/C][C]47.1773405198377[/C][/ROW]
[ROW][C]Trimmed Mean ( 7 / 24 )[/C][C]360.206896551724[/C][C]7.33865609861578[/C][C]49.083495903244[/C][/ROW]
[ROW][C]Trimmed Mean ( 8 / 24 )[/C][C]361.125[/C][C]6.99986375099312[/C][C]51.5902898751086[/C][/ROW]
[ROW][C]Trimmed Mean ( 9 / 24 )[/C][C]362.185185185185[/C][C]6.59156196059896[/C][C]54.9467921791749[/C][/ROW]
[ROW][C]Trimmed Mean ( 10 / 24 )[/C][C]363.288461538462[/C][C]6.11283646410149[/C][C]59.4304237765766[/C][/ROW]
[ROW][C]Trimmed Mean ( 11 / 24 )[/C][C]363.76[/C][C]5.80032089189724[/C][C]62.713771665315[/C][/ROW]
[ROW][C]Trimmed Mean ( 12 / 24 )[/C][C]364.229166666667[/C][C]5.44355624524572[/C][C]66.9101503240233[/C][/ROW]
[ROW][C]Trimmed Mean ( 13 / 24 )[/C][C]364.217391304348[/C][C]5.29359407267493[/C][C]68.8034228359908[/C][/ROW]
[ROW][C]Trimmed Mean ( 14 / 24 )[/C][C]364.181818181818[/C][C]5.13108018408093[/C][C]70.9756630410268[/C][/ROW]
[ROW][C]Trimmed Mean ( 15 / 24 )[/C][C]363.880952380952[/C][C]5.0038547720236[/C][C]72.7201265742962[/C][/ROW]
[ROW][C]Trimmed Mean ( 16 / 24 )[/C][C]363.45[/C][C]4.88560811636245[/C][C]74.3919674569815[/C][/ROW]
[ROW][C]Trimmed Mean ( 17 / 24 )[/C][C]362.973684210526[/C][C]4.73711276293287[/C][C]76.6233996055014[/C][/ROW]
[ROW][C]Trimmed Mean ( 18 / 24 )[/C][C]362.388888888889[/C][C]4.54366430995425[/C][C]79.7569679817605[/C][/ROW]
[ROW][C]Trimmed Mean ( 19 / 24 )[/C][C]361.735294117647[/C][C]4.33106525524039[/C][C]83.5210907247274[/C][/ROW]
[ROW][C]Trimmed Mean ( 20 / 24 )[/C][C]361.03125[/C][C]4.06089841258541[/C][C]88.9042801172034[/C][/ROW]
[ROW][C]Trimmed Mean ( 21 / 24 )[/C][C]360.5[/C][C]3.82001685017647[/C][C]94.3713114729706[/C][/ROW]
[ROW][C]Trimmed Mean ( 22 / 24 )[/C][C]360.357142857143[/C][C]3.71654896450906[/C][C]96.9601494015954[/C][/ROW]
[ROW][C]Trimmed Mean ( 23 / 24 )[/C][C]360.230769230769[/C][C]3.6193104707974[/C][C]99.5302205039636[/C][/ROW]
[ROW][C]Trimmed Mean ( 24 / 24 )[/C][C]360.125[/C][C]3.50223143153048[/C][C]102.827299406260[/C][/ROW]
[ROW][C]Median[/C][C]357[/C][C][/C][C][/C][/ROW]
[ROW][C]Midrange[/C][C]363[/C][C][/C][C][/C][/ROW]
[ROW][C]Midmean - Weighted Average at Xnp[/C][C]361.297297297297[/C][C][/C][C][/C][/ROW]
[ROW][C]Midmean - Weighted Average at X(n+1)p[/C][C]362.388888888889[/C][C][/C][C][/C][/ROW]
[ROW][C]Midmean - Empirical Distribution Function[/C][C]361.297297297297[/C][C][/C][C][/C][/ROW]
[ROW][C]Midmean - Empirical Distribution Function - Averaging[/C][C]362.388888888889[/C][C][/C][C][/C][/ROW]
[ROW][C]Midmean - Empirical Distribution Function - Interpolation[/C][C]362.388888888889[/C][C][/C][C][/C][/ROW]
[ROW][C]Midmean - Closest Observation[/C][C]361.297297297297[/C][C][/C][C][/C][/ROW]
[ROW][C]Midmean - True Basic - Statistics Graphics Toolkit[/C][C]362.388888888889[/C][C][/C][C][/C][/ROW]
[ROW][C]Midmean - MS Excel (old versions)[/C][C]364.564102564103[/C][C][/C][C][/C][/ROW]
[ROW][C]Number of observations[/C][C]72[/C][C][/C][C][/C][/ROW]
[/TABLE]
Source: https://freestatistics.org/blog/index.php?pk=107188&T=1

Globally Unique Identifier (entire table): ba.freestatistics.org/blog/index.php?pk=107188&T=1

As an alternative you can also use a QR Code:  

The GUIDs for individual cells are displayed in the table below:

Central Tendency - Ungrouped Data
MeasureValueS.E.Value/S.E.
Arithmetic Mean356.1805555555569.3665431630390738.0268952329249
Geometric Mean346.301555928549
Harmonic Mean335.132988739581
Quadratic Mean364.819913716952
Winsorized Mean ( 1 / 24 )355.3888888888899.1424039883849538.8725863941690
Winsorized Mean ( 2 / 24 )355.3055555555568.9928383714658639.5098344792824
Winsorized Mean ( 3 / 24 )355.6388888888898.8441404692535740.2118091775293
Winsorized Mean ( 4 / 24 )355.5277777777788.8028300556326740.3878952031212
Winsorized Mean ( 5 / 24 )355.9444444444448.6804893581200541.0051127027166
Winsorized Mean ( 6 / 24 )355.1111111111118.4815125183660641.8688424195738
Winsorized Mean ( 7 / 24 )355.2083333333338.4597439791336641.9880712950026
Winsorized Mean ( 8 / 24 )354.7638888888898.3921281082029342.2734119778418
Winsorized Mean ( 9 / 24 )355.0138888888898.2431622219671643.0676819561811
Winsorized Mean ( 10 / 24 )360.0138888888897.1986808981057550.0110914742203
Winsorized Mean ( 11 / 24 )360.3194444444447.0322537272140551.2381177388478
Winsorized Mean ( 12 / 24 )364.3194444444445.8171413903191662.628603982489
Winsorized Mean ( 13 / 24 )364.55.6728770166752664.2531115919775
Winsorized Mean ( 14 / 24 )366.6388888888895.2902938241939869.3040691260186
Winsorized Mean ( 15 / 24 )367.4722222222225.0483566261985372.7904641909051
Winsorized Mean ( 16 / 24 )367.4722222222224.9822051191284573.7569436495832
Winsorized Mean ( 17 / 24 )367.9444444444444.9194564731236474.793718870088
Winsorized Mean ( 18 / 24 )367.9444444444444.6998272239115478.2889299786246
Winsorized Mean ( 19 / 24 )367.6805555555564.5807323558401480.2667623850118
Winsorized Mean ( 20 / 24 )365.4583333333334.150152131570688.0590209099222
Winsorized Mean ( 21 / 24 )361.6666666666673.42308740562397105.655107162167
Winsorized Mean ( 22 / 24 )361.3611111111113.21298626417628112.468924981151
Winsorized Mean ( 23 / 24 )361.0416666666673.08248862303028117.126682632081
Winsorized Mean ( 24 / 24 )361.7083333333332.81709219082028128.397762242922
Trimmed Mean ( 1 / 24 )355.9857142857148.9033106843282839.9835215132192
Trimmed Mean ( 2 / 24 )356.6176470588248.6184111225522941.3785838233734
Trimmed Mean ( 3 / 24 )357.3333333333338.3736553617941642.6735180628177
Trimmed Mean ( 4 / 24 )357.968758.1481802656706843.9323552411043
Trimmed Mean ( 5 / 24 )358.6774193548397.8902028491888445.4585802431826
Trimmed Mean ( 6 / 24 )359.3333333333337.6166509043093747.1773405198377
Trimmed Mean ( 7 / 24 )360.2068965517247.3386560986157849.083495903244
Trimmed Mean ( 8 / 24 )361.1256.9998637509931251.5902898751086
Trimmed Mean ( 9 / 24 )362.1851851851856.5915619605989654.9467921791749
Trimmed Mean ( 10 / 24 )363.2884615384626.1128364641014959.4304237765766
Trimmed Mean ( 11 / 24 )363.765.8003208918972462.713771665315
Trimmed Mean ( 12 / 24 )364.2291666666675.4435562452457266.9101503240233
Trimmed Mean ( 13 / 24 )364.2173913043485.2935940726749368.8034228359908
Trimmed Mean ( 14 / 24 )364.1818181818185.1310801840809370.9756630410268
Trimmed Mean ( 15 / 24 )363.8809523809525.003854772023672.7201265742962
Trimmed Mean ( 16 / 24 )363.454.8856081163624574.3919674569815
Trimmed Mean ( 17 / 24 )362.9736842105264.7371127629328776.6233996055014
Trimmed Mean ( 18 / 24 )362.3888888888894.5436643099542579.7569679817605
Trimmed Mean ( 19 / 24 )361.7352941176474.3310652552403983.5210907247274
Trimmed Mean ( 20 / 24 )361.031254.0608984125854188.9042801172034
Trimmed Mean ( 21 / 24 )360.53.8200168501764794.3713114729706
Trimmed Mean ( 22 / 24 )360.3571428571433.7165489645090696.9601494015954
Trimmed Mean ( 23 / 24 )360.2307692307693.619310470797499.5302205039636
Trimmed Mean ( 24 / 24 )360.1253.50223143153048102.827299406260
Median357
Midrange363
Midmean - Weighted Average at Xnp361.297297297297
Midmean - Weighted Average at X(n+1)p362.388888888889
Midmean - Empirical Distribution Function361.297297297297
Midmean - Empirical Distribution Function - Averaging362.388888888889
Midmean - Empirical Distribution Function - Interpolation362.388888888889
Midmean - Closest Observation361.297297297297
Midmean - True Basic - Statistics Graphics Toolkit362.388888888889
Midmean - MS Excel (old versions)364.564102564103
Number of observations72


Parameters (Session):
Parameters (R input):
R code (references can be found in the software module):
geomean <- function(x) {
return(exp(mean(log(x))))
}
harmean <- function(x) {
return(1/mean(1/x))
}
quamean <- function(x) {
return(sqrt(mean(x*x)))
}
winmean <- function(x) {
x <-sort(x[!is.na(x)])
n<-length(x)
denom <- 3
nodenom <- n/denom
if (nodenom>40) denom <- n/40
sqrtn = sqrt(n)
roundnodenom = floor(nodenom)
win <- array(NA,dim=c(roundnodenom,2))
for (j in 1:roundnodenom) {
win[j,1] <- (j*x[j+1]+sum(x[(j+1):(n-j)])+j*x[n-j])/n
win[j,2] <- sd(c(rep(x[j+1],j),x[(j+1):(n-j)],rep(x[n-j],j)))/sqrtn
}
return(win)
}
trimean <- function(x) {
x <-sort(x[!is.na(x)])
n<-length(x)
denom <- 3
nodenom <- n/denom
if (nodenom>40) denom <- n/40
sqrtn = sqrt(n)
roundnodenom = floor(nodenom)
tri <- array(NA,dim=c(roundnodenom,2))
for (j in 1:roundnodenom) {
tri[j,1] <- mean(x,trim=j/n)
tri[j,2] <- sd(x[(j+1):(n-j)]) / sqrt(n-j*2)
}
return(tri)
}
midrange <- function(x) {
return((max(x)+min(x))/2)
}
q1 <- function(data,n,p,i,f) {
np <- n*p;
i <<- floor(np)
f <<- np - i
qvalue <- (1-f)*data[i] + f*data[i+1]
}
q2 <- function(data,n,p,i,f) {
np <- (n+1)*p
i <<- floor(np)
f <<- np - i
qvalue <- (1-f)*data[i] + f*data[i+1]
}
q3 <- function(data,n,p,i,f) {
np <- n*p
i <<- floor(np)
f <<- np - i
if (f==0) {
qvalue <- data[i]
} else {
qvalue <- data[i+1]
}
}
q4 <- function(data,n,p,i,f) {
np <- n*p
i <<- floor(np)
f <<- np - i
if (f==0) {
qvalue <- (data[i]+data[i+1])/2
} else {
qvalue <- data[i+1]
}
}
q5 <- function(data,n,p,i,f) {
np <- (n-1)*p
i <<- floor(np)
f <<- np - i
if (f==0) {
qvalue <- data[i+1]
} else {
qvalue <- data[i+1] + f*(data[i+2]-data[i+1])
}
}
q6 <- function(data,n,p,i,f) {
np <- n*p+0.5
i <<- floor(np)
f <<- np - i
qvalue <- data[i]
}
q7 <- function(data,n,p,i,f) {
np <- (n+1)*p
i <<- floor(np)
f <<- np - i
if (f==0) {
qvalue <- data[i]
} else {
qvalue <- f*data[i] + (1-f)*data[i+1]
}
}
q8 <- function(data,n,p,i,f) {
np <- (n+1)*p
i <<- floor(np)
f <<- np - i
if (f==0) {
qvalue <- data[i]
} else {
if (f == 0.5) {
qvalue <- (data[i]+data[i+1])/2
} else {
if (f < 0.5) {
qvalue <- data[i]
} else {
qvalue <- data[i+1]
}
}
}
}
midmean <- function(x,def) {
x <-sort(x[!is.na(x)])
n<-length(x)
if (def==1) {
qvalue1 <- q1(x,n,0.25,i,f)
qvalue3 <- q1(x,n,0.75,i,f)
}
if (def==2) {
qvalue1 <- q2(x,n,0.25,i,f)
qvalue3 <- q2(x,n,0.75,i,f)
}
if (def==3) {
qvalue1 <- q3(x,n,0.25,i,f)
qvalue3 <- q3(x,n,0.75,i,f)
}
if (def==4) {
qvalue1 <- q4(x,n,0.25,i,f)
qvalue3 <- q4(x,n,0.75,i,f)
}
if (def==5) {
qvalue1 <- q5(x,n,0.25,i,f)
qvalue3 <- q5(x,n,0.75,i,f)
}
if (def==6) {
qvalue1 <- q6(x,n,0.25,i,f)
qvalue3 <- q6(x,n,0.75,i,f)
}
if (def==7) {
qvalue1 <- q7(x,n,0.25,i,f)
qvalue3 <- q7(x,n,0.75,i,f)
}
if (def==8) {
qvalue1 <- q8(x,n,0.25,i,f)
qvalue3 <- q8(x,n,0.75,i,f)
}
midm <- 0
myn <- 0
roundno4 <- round(n/4)
round3no4 <- round(3*n/4)
for (i in 1:n) {
if ((x[i]>=qvalue1) & (x[i]<=qvalue3)){
midm = midm + x[i]
myn = myn + 1
}
}
midm = midm / myn
return(midm)
}
(arm <- mean(x))
sqrtn <- sqrt(length(x))
(armse <- sd(x) / sqrtn)
(armose <- arm / armse)
(geo <- geomean(x))
(har <- harmean(x))
(qua <- quamean(x))
(win <- winmean(x))
(tri <- trimean(x))
(midr <- midrange(x))
midm <- array(NA,dim=8)
for (j in 1:8) midm[j] <- midmean(x,j)
midm
bitmap(file='test1.png')
lb <- win[,1] - 2*win[,2]
ub <- win[,1] + 2*win[,2]
if ((ylimmin == '') | (ylimmax == '')) plot(win[,1],type='b',main=main, xlab='j', pch=19, ylab='Winsorized Mean(j/n)', ylim=c(min(lb),max(ub))) else plot(win[,1],type='l',main=main, xlab='j', pch=19, ylab='Winsorized Mean(j/n)', ylim=c(ylimmin,ylimmax))
lines(ub,lty=3)
lines(lb,lty=3)
grid()
dev.off()
bitmap(file='test2.png')
lb <- tri[,1] - 2*tri[,2]
ub <- tri[,1] + 2*tri[,2]
if ((ylimmin == '') | (ylimmax == '')) plot(tri[,1],type='b',main=main, xlab='j', pch=19, ylab='Trimmed Mean(j/n)', ylim=c(min(lb),max(ub))) else plot(tri[,1],type='l',main=main, xlab='j', pch=19, ylab='Trimmed Mean(j/n)', ylim=c(ylimmin,ylimmax))
lines(ub,lty=3)
lines(lb,lty=3)
grid()
dev.off()
load(file='createtable')
a<-table.start()
a<-table.row.start(a)
a<-table.element(a,'Central Tendency - Ungrouped Data',4,TRUE)
a<-table.row.end(a)
a<-table.row.start(a)
a<-table.element(a,'Measure',header=TRUE)
a<-table.element(a,'Value',header=TRUE)
a<-table.element(a,'S.E.',header=TRUE)
a<-table.element(a,'Value/S.E.',header=TRUE)
a<-table.row.end(a)
a<-table.row.start(a)
a<-table.element(a,hyperlink('arithmetic_mean.htm', 'Arithmetic Mean', 'click to view the definition of the Arithmetic Mean'),header=TRUE)
a<-table.element(a,arm)
a<-table.element(a,hyperlink('arithmetic_mean_standard_error.htm', armse, 'click to view the definition of the Standard Error of the Arithmetic Mean'))
a<-table.element(a,armose)
a<-table.row.end(a)
a<-table.row.start(a)
a<-table.element(a,hyperlink('geometric_mean.htm', 'Geometric Mean', 'click to view the definition of the Geometric Mean'),header=TRUE)
a<-table.element(a,geo)
a<-table.element(a,'')
a<-table.row.end(a)
a<-table.row.start(a)
a<-table.element(a,hyperlink('harmonic_mean.htm', 'Harmonic Mean', 'click to view the definition of the Harmonic Mean'),header=TRUE)
a<-table.element(a,har)
a<-table.element(a,'')
a<-table.row.end(a)
a<-table.row.start(a)
a<-table.element(a,hyperlink('quadratic_mean.htm', 'Quadratic Mean', 'click to view the definition of the Quadratic Mean'),header=TRUE)
a<-table.element(a,qua)
a<-table.element(a,'')
a<-table.row.end(a)
for (j in 1:length(win[,1])) {
a<-table.row.start(a)
mylabel <- paste('Winsorized Mean (',j)
mylabel <- paste(mylabel,'/')
mylabel <- paste(mylabel,length(win[,1]))
mylabel <- paste(mylabel,')')
a<-table.element(a,hyperlink('winsorized_mean.htm', mylabel, 'click to view the definition of the Winsorized Mean'),header=TRUE)
a<-table.element(a,win[j,1])
a<-table.element(a,win[j,2])
a<-table.element(a,win[j,1]/win[j,2])
a<-table.row.end(a)
}
for (j in 1:length(tri[,1])) {
a<-table.row.start(a)
mylabel <- paste('Trimmed Mean (',j)
mylabel <- paste(mylabel,'/')
mylabel <- paste(mylabel,length(tri[,1]))
mylabel <- paste(mylabel,')')
a<-table.element(a,hyperlink('arithmetic_mean.htm', mylabel, 'click to view the definition of the Trimmed Mean'),header=TRUE)
a<-table.element(a,tri[j,1])
a<-table.element(a,tri[j,2])
a<-table.element(a,tri[j,1]/tri[j,2])
a<-table.row.end(a)
}
a<-table.row.start(a)
a<-table.element(a,hyperlink('median_1.htm', 'Median', 'click to view the definition of the Median'),header=TRUE)
a<-table.element(a,median(x))
a<-table.element(a,'')
a<-table.row.end(a)
a<-table.row.start(a)
a<-table.element(a,hyperlink('midrange.htm', 'Midrange', 'click to view the definition of the Midrange'),header=TRUE)
a<-table.element(a,midr)
a<-table.element(a,'')
a<-table.row.end(a)
a<-table.row.start(a)
mymid <- hyperlink('midmean.htm', 'Midmean', 'click to view the definition of the Midmean')
mylabel <- paste(mymid,hyperlink('method_1.htm','Weighted Average at Xnp',''),sep=' - ')
a<-table.element(a,mylabel,header=TRUE)
a<-table.element(a,midm[1])
a<-table.element(a,'')
a<-table.row.end(a)
a<-table.row.start(a)
mymid <- hyperlink('midmean.htm', 'Midmean', 'click to view the definition of the Midmean')
mylabel <- paste(mymid,hyperlink('method_2.htm','Weighted Average at X(n+1)p',''),sep=' - ')
a<-table.element(a,mylabel,header=TRUE)
a<-table.element(a,midm[2])
a<-table.element(a,'')
a<-table.row.end(a)
a<-table.row.start(a)
mymid <- hyperlink('midmean.htm', 'Midmean', 'click to view the definition of the Midmean')
mylabel <- paste(mymid,hyperlink('method_3.htm','Empirical Distribution Function',''),sep=' - ')
a<-table.element(a,mylabel,header=TRUE)
a<-table.element(a,midm[3])
a<-table.element(a,'')
a<-table.row.end(a)
a<-table.row.start(a)
mymid <- hyperlink('midmean.htm', 'Midmean', 'click to view the definition of the Midmean')
mylabel <- paste(mymid,hyperlink('method_4.htm','Empirical Distribution Function - Averaging',''),sep=' - ')
a<-table.element(a,mylabel,header=TRUE)
a<-table.element(a,midm[4])
a<-table.element(a,'')
a<-table.row.end(a)
a<-table.row.start(a)
mymid <- hyperlink('midmean.htm', 'Midmean', 'click to view the definition of the Midmean')
mylabel <- paste(mymid,hyperlink('method_5.htm','Empirical Distribution Function - Interpolation',''),sep=' - ')
a<-table.element(a,mylabel,header=TRUE)
a<-table.element(a,midm[5])
a<-table.element(a,'')
a<-table.row.end(a)
a<-table.row.start(a)
mymid <- hyperlink('midmean.htm', 'Midmean', 'click to view the definition of the Midmean')
mylabel <- paste(mymid,hyperlink('method_6.htm','Closest Observation',''),sep=' - ')
a<-table.element(a,mylabel,header=TRUE)
a<-table.element(a,midm[6])
a<-table.element(a,'')
a<-table.row.end(a)
a<-table.row.start(a)
mymid <- hyperlink('midmean.htm', 'Midmean', 'click to view the definition of the Midmean')
mylabel <- paste(mymid,hyperlink('method_7.htm','True Basic - Statistics Graphics Toolkit',''),sep=' - ')
a<-table.element(a,mylabel,header=TRUE)
a<-table.element(a,midm[7])
a<-table.element(a,'')
a<-table.row.end(a)
a<-table.row.start(a)
mymid <- hyperlink('midmean.htm', 'Midmean', 'click to view the definition of the Midmean')
mylabel <- paste(mymid,hyperlink('method_8.htm','MS Excel (old versions)',''),sep=' - ')
a<-table.element(a,mylabel,header=TRUE)
a<-table.element(a,midm[8])
a<-table.element(a,'')
a<-table.row.end(a)
a<-table.row.start(a)
a<-table.element(a,'Number of observations',header=TRUE)
a<-table.element(a,length(x))
a<-table.element(a,'')
a<-table.row.end(a)
a<-table.end(a)
table.save(a,file='mytable.tab')