| Multiple Linear Regression - Estimated Regression Equation |
| SWS[t] = + 11.6991087210001 -1.81485814734191BW[t] -0.80621691930904D[t] + e[t] |
| Multiple Linear Regression - Ordinary Least Squares | |||||
| Variable | Parameter | S.D. | T-STAT H0: parameter = 0 | 2-tail p-value | 1-tail p-value |
| (Intercept) | 11.6991087210001 | 0.941095 | 12.4314 | 0 | 0 |
| BW | -1.81485814734191 | 0.37295 | -4.8662 | 2.3e-05 | 1.1e-05 |
| D | -0.80621691930904 | 0.336956 | -2.3927 | 0.022068 | 0.011034 |
| Multiple Linear Regression - Regression Statistics | |
| Multiple R | 0.757704457897525 |
| R-squared | 0.574116045517782 |
| Adjusted R-squared | 0.550455825824325 |
| F-TEST (value) | 24.2650344314663 |
| F-TEST (DF numerator) | 2 |
| F-TEST (DF denominator) | 36 |
| p-value | 2.12443282854302e-07 |
| Multiple Linear Regression - Residual Statistics | |
| Residual Standard Deviation | 2.66067288469349 |
| Sum Squared Residuals | 254.850487176355 |
| Multiple Linear Regression - Actuals, Interpolation, and Residuals | |||
| Time or Index | Actuals | Interpolation Forecast | Residuals Prediction Error |
| 1 | 6.3 | 9.280457963073 | -2.98045796307300 |
| 2 | 4.9 | 8.7341312222381 | -3.83413122223809 |
| 3 | 10 | 6.65938289642203 | 3.34061710357797 |
| 4 | 6.1 | 7.63995514168148 | -1.53995514168148 |
| 5 | 4.7 | 7.39127014420428 | -2.69127014420428 |
| 6 | 5.2 | 4.47407593489727 | 0.725924065102726 |
| 7 | 6.5 | 4.33037320547749 | 2.16962679452251 |
| 8 | 3.2 | 2.82697540005161 | 0.373024599948394 |
| 9 | 2.1 | 2.7373490478625 | -0.6373490478625 |
| 10 | 2.1 | 2.29278166284831 | -0.192781662848311 |
| 11 | 17.9 | 14.5226080963749 | 3.37739190362511 |
| 12 | 11.9 | 12.2536895474719 | -0.353689547471851 |
| 13 | 15.8 | 13.8661233860899 | 1.93387661391007 |
| 14 | 6.3 | 12.9344960337960 | -6.63449603379604 |
| 15 | 10.4 | 11.0874734296033 | -0.687473429603286 |
| 16 | 13.2 | 11.8706199356634 | 1.32938006433665 |
| 17 | 11 | 11.7578303003042 | -0.757830300304154 |
| 18 | 9.5 | 11.3552062888890 | -1.85520628888903 |
| 19 | 10.6 | 10.2837877147052 | 0.31621228529482 |
| 20 | 11 | 9.14866242179589 | 1.85133757820411 |
| 21 | 15.2 | 10.6651768204492 | 4.5348231795508 |
| 22 | 5.7 | 10.3134209671451 | -4.61342096714508 |
| 23 | 6.6 | 10.2774715419084 | -3.67747154190842 |
| 24 | 11 | 10.1697182377253 | 0.830281762274702 |
| 25 | 7.4 | 8.44332794970336 | -1.04332794970336 |
| 26 | 11.9 | 9.70643485041881 | 2.19356514958119 |
| 27 | 13.8 | 10.4746596998681 | 3.32534030013194 |
| 28 | 9.1 | 6.61718297994529 | 2.48281702005471 |
| 29 | 7.5 | 6.94581945696794 | 0.554180543032061 |
| 30 | 3.3 | 5.05126695557864 | -1.75126695557864 |
| 31 | 10.9 | 9.9518625531717 | 0.948137446828292 |
| 32 | 14.3 | 9.90548547932929 | 4.39451452067071 |
| 33 | 12.8 | 9.90548547932929 | 2.89451452067071 |
| 34 | 4.9 | 8.27084783674645 | -3.37084783674645 |
| 35 | 9.7 | 7.345010854732 | 2.35498914526799 |
| 36 | 7.4 | 9.75524177428921 | -2.35524177428921 |
| 37 | 8.3 | 7.77616769744705 | 0.523832302552956 |
| 38 | 3.2 | 4.50237979290602 | -1.30237979290602 |
| 39 | 8.4 | 8.57578929888921 | -0.175789298889214 |
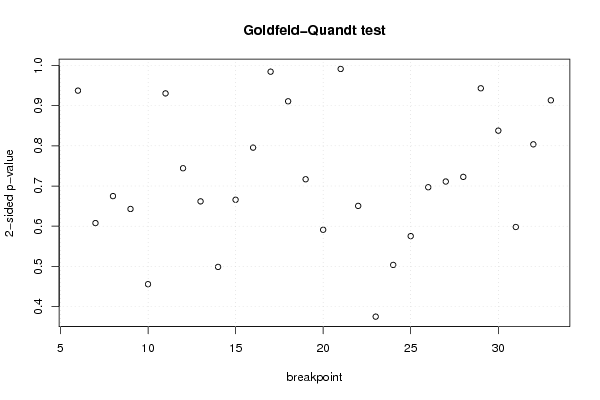
| Goldfeld-Quandt test for Heteroskedasticity | |||
| p-values | Alternative Hypothesis | ||
| breakpoint index | greater | 2-sided | less |
| 6 | 0.468590949597431 | 0.937181899194862 | 0.531409050402569 |
| 7 | 0.303932984956831 | 0.607865969913662 | 0.696067015043169 |
| 8 | 0.337476985561686 | 0.674953971123372 | 0.662523014438314 |
| 9 | 0.321431598326381 | 0.642863196652763 | 0.678568401673619 |
| 10 | 0.227979229399231 | 0.455958458798462 | 0.772020770600769 |
| 11 | 0.465193098444392 | 0.930386196888783 | 0.534806901555609 |
| 12 | 0.372106910199527 | 0.744213820399053 | 0.627893089800473 |
| 13 | 0.330925048087422 | 0.661850096174845 | 0.669074951912578 |
| 14 | 0.750603380947998 | 0.498793238104003 | 0.249396619052002 |
| 15 | 0.667080415189609 | 0.665839169620782 | 0.332919584810391 |
| 16 | 0.602281687116713 | 0.795436625766573 | 0.397718312883287 |
| 17 | 0.507840422998648 | 0.984319154002704 | 0.492159577001352 |
| 18 | 0.455322529943835 | 0.91064505988767 | 0.544677470056165 |
| 19 | 0.358395000507613 | 0.716790001015226 | 0.641604999492387 |
| 20 | 0.295596727730650 | 0.591193455461301 | 0.70440327226935 |
| 21 | 0.495551511813156 | 0.991103023626312 | 0.504448488186844 |
| 22 | 0.674717897598807 | 0.650564204802386 | 0.325282102401193 |
| 23 | 0.812424356314595 | 0.375151287370811 | 0.187575643685405 |
| 24 | 0.748120191058354 | 0.503759617883292 | 0.251879808941646 |
| 25 | 0.712284212541769 | 0.575431574916463 | 0.287715787458232 |
| 26 | 0.65152315771237 | 0.69695368457526 | 0.34847684228763 |
| 27 | 0.644405842182712 | 0.711188315634576 | 0.355594157817288 |
| 28 | 0.638644578608933 | 0.722710842782134 | 0.361355421391067 |
| 29 | 0.528502735980754 | 0.942994528038492 | 0.471497264019246 |
| 30 | 0.418818668973063 | 0.837637337946125 | 0.581181331026937 |
| 31 | 0.299038224795522 | 0.598076449591043 | 0.700961775204479 |
| 32 | 0.401847935067706 | 0.803695870135411 | 0.598152064932294 |
| 33 | 0.456583694142227 | 0.913167388284455 | 0.543416305857773 |
| Meta Analysis of Goldfeld-Quandt test for Heteroskedasticity | |||
| Description | # significant tests | % significant tests | OK/NOK |
| 1% type I error level | 0 | 0 | OK |
| 5% type I error level | 0 | 0 | OK |
| 10% type I error level | 0 | 0 | OK |