Free Statistics

of Irreproducible Research!

Author's title

Author*The author of this computation has been verified*
R Software Modulerwasp_smp.wasp
Title produced by softwareStandard Deviation-Mean Plot
Date of computationWed, 08 Dec 2010 15:59:27 +0000
Cite this page as followsStatistical Computations at FreeStatistics.org, Office for Research Development and Education, URL https://freestatistics.org/blog/index.php?v=date/2010/Dec/08/t12918238993o68cedo0kj7aiw.htm/, Retrieved Fri, 03 May 2024 08:18:31 +0000
Statistical Computations at FreeStatistics.org, Office for Research Development and Education, URL https://freestatistics.org/blog/index.php?pk=106973, Retrieved Fri, 03 May 2024 08:18:31 +0000
QR Codes:

Original text written by user:
IsPrivate?No (this computation is public)
User-defined keywords
Estimated Impact131
Family? (F = Feedback message, R = changed R code, M = changed R Module, P = changed Parameters, D = changed Data)
-     [Univariate Data Series] [data set] [2008-12-01 19:54:57] [b98453cac15ba1066b407e146608df68]
- RMP   [Standard Deviation-Mean Plot] [Unemployment] [2010-11-29 10:34:47] [b98453cac15ba1066b407e146608df68]
-   PD      [Standard Deviation-Mean Plot] [WS 9 : Standard D...] [2010-12-08 15:59:27] [fea2623c21d84eea50328c29ea7301e7] [Current]
Feedback Forum

Post a new message
Dataseries X:
627
696
825
677
656
785
412
352
839
729
696
641
695
638
762
635
721
854
418
367
824
687
601
676
740
691
683
594
729
731
386
331
707
715
657
653
642
643
718
654
632
731
392
344
792
852
649
629
685
617
715
715
629
916
531
357
917
828
708
858
775
785
1006
789
734
906
532
387
991
841
892
782


Summary of computational transaction
Raw Inputview raw input (R code)
Raw Outputview raw output of R engine
Computing time5 seconds
R Server'Sir Ronald Aylmer Fisher' @ 193.190.124.24

\begin{tabular}{lllllllll}
\hline
Summary of computational transaction \tabularnewline
Raw Input & view raw input (R code)  \tabularnewline
Raw Output & view raw output of R engine  \tabularnewline
Computing time & 5 seconds \tabularnewline
R Server & 'Sir Ronald Aylmer Fisher' @ 193.190.124.24 \tabularnewline
\hline
\end{tabular}
%Source: https://freestatistics.org/blog/index.php?pk=106973&T=0

[TABLE]
[ROW][C]Summary of computational transaction[/C][/ROW]
[ROW][C]Raw Input[/C][C]view raw input (R code) [/C][/ROW]
[ROW][C]Raw Output[/C][C]view raw output of R engine [/C][/ROW]
[ROW][C]Computing time[/C][C]5 seconds[/C][/ROW]
[ROW][C]R Server[/C][C]'Sir Ronald Aylmer Fisher' @ 193.190.124.24[/C][/ROW]
[/TABLE]
Source: https://freestatistics.org/blog/index.php?pk=106973&T=0

Globally Unique Identifier (entire table): ba.freestatistics.org/blog/index.php?pk=106973&T=0

As an alternative you can also use a QR Code:  

The GUIDs for individual cells are displayed in the table below:

Summary of computational transaction
Raw Inputview raw input (R code)
Raw Outputview raw output of R engine
Computing time5 seconds
R Server'Sir Ronald Aylmer Fisher' @ 193.190.124.24


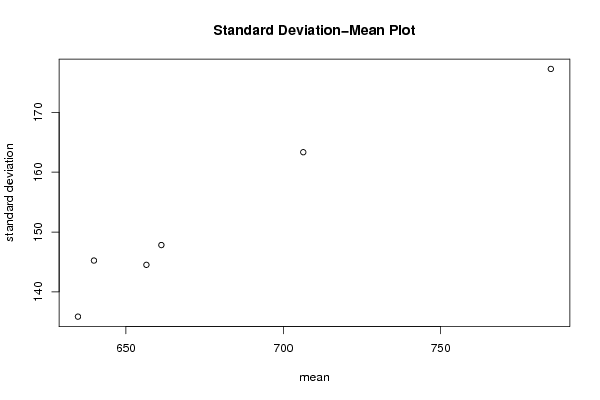
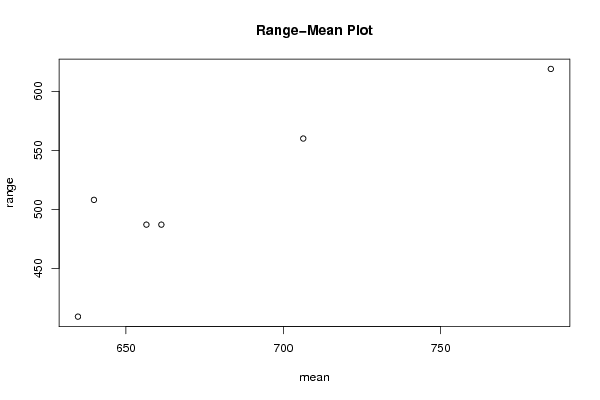
Standard Deviation-Mean Plot
SectionMeanStandard DeviationRange
1661.25147.816916856938487
2656.5144.512660659574487
3634.75135.84959932353409
4639.833333333333145.229494458275508
5706.333333333333163.343104222277560
6785177.262517188491619

\begin{tabular}{lllllllll}
\hline
Standard Deviation-Mean Plot \tabularnewline
Section & Mean & Standard Deviation & Range \tabularnewline
1 & 661.25 & 147.816916856938 & 487 \tabularnewline
2 & 656.5 & 144.512660659574 & 487 \tabularnewline
3 & 634.75 & 135.84959932353 & 409 \tabularnewline
4 & 639.833333333333 & 145.229494458275 & 508 \tabularnewline
5 & 706.333333333333 & 163.343104222277 & 560 \tabularnewline
6 & 785 & 177.262517188491 & 619 \tabularnewline
\hline
\end{tabular}
%Source: https://freestatistics.org/blog/index.php?pk=106973&T=1

[TABLE]
[ROW][C]Standard Deviation-Mean Plot[/C][/ROW]
[ROW][C]Section[/C][C]Mean[/C][C]Standard Deviation[/C][C]Range[/C][/ROW]
[ROW][C]1[/C][C]661.25[/C][C]147.816916856938[/C][C]487[/C][/ROW]
[ROW][C]2[/C][C]656.5[/C][C]144.512660659574[/C][C]487[/C][/ROW]
[ROW][C]3[/C][C]634.75[/C][C]135.84959932353[/C][C]409[/C][/ROW]
[ROW][C]4[/C][C]639.833333333333[/C][C]145.229494458275[/C][C]508[/C][/ROW]
[ROW][C]5[/C][C]706.333333333333[/C][C]163.343104222277[/C][C]560[/C][/ROW]
[ROW][C]6[/C][C]785[/C][C]177.262517188491[/C][C]619[/C][/ROW]
[/TABLE]
Source: https://freestatistics.org/blog/index.php?pk=106973&T=1

Globally Unique Identifier (entire table): ba.freestatistics.org/blog/index.php?pk=106973&T=1

As an alternative you can also use a QR Code:  

The GUIDs for individual cells are displayed in the table below:

Standard Deviation-Mean Plot
SectionMeanStandard DeviationRange
1661.25147.816916856938487
2656.5144.512660659574487
3634.75135.84959932353409
4639.833333333333145.229494458275508
5706.333333333333163.343104222277560
6785177.262517188491619


Regression: S.E.(k) = alpha + beta * Mean(k)
alpha-23.5417119570894
beta0.258411043453993
S.D.0.0301598860425617
T-STAT8.56803779329013
p-value0.00101901549271376

\begin{tabular}{lllllllll}
\hline
Regression: S.E.(k) = alpha + beta * Mean(k) \tabularnewline
alpha & -23.5417119570894 \tabularnewline
beta & 0.258411043453993 \tabularnewline
S.D. & 0.0301598860425617 \tabularnewline
T-STAT & 8.56803779329013 \tabularnewline
p-value & 0.00101901549271376 \tabularnewline
\hline
\end{tabular}
%Source: https://freestatistics.org/blog/index.php?pk=106973&T=2

[TABLE]
[ROW][C]Regression: S.E.(k) = alpha + beta * Mean(k)[/C][/ROW]
[ROW][C]alpha[/C][C]-23.5417119570894[/C][/ROW]
[ROW][C]beta[/C][C]0.258411043453993[/C][/ROW]
[ROW][C]S.D.[/C][C]0.0301598860425617[/C][/ROW]
[ROW][C]T-STAT[/C][C]8.56803779329013[/C][/ROW]
[ROW][C]p-value[/C][C]0.00101901549271376[/C][/ROW]
[/TABLE]
Source: https://freestatistics.org/blog/index.php?pk=106973&T=2

Globally Unique Identifier (entire table): ba.freestatistics.org/blog/index.php?pk=106973&T=2

As an alternative you can also use a QR Code:  

The GUIDs for individual cells are displayed in the table below:

Regression: S.E.(k) = alpha + beta * Mean(k)
alpha-23.5417119570894
beta0.258411043453993
S.D.0.0301598860425617
T-STAT8.56803779329013
p-value0.00101901549271376


Regression: ln S.E.(k) = alpha + beta * ln Mean(k)
alpha-2.57115214933841
beta1.16457387643743
S.D.0.145080338877560
T-STAT8.02709647252938
p-value0.00130697697726522
Lambda-0.164573876437431

\begin{tabular}{lllllllll}
\hline
Regression: ln S.E.(k) = alpha + beta * ln Mean(k) \tabularnewline
alpha & -2.57115214933841 \tabularnewline
beta & 1.16457387643743 \tabularnewline
S.D. & 0.145080338877560 \tabularnewline
T-STAT & 8.02709647252938 \tabularnewline
p-value & 0.00130697697726522 \tabularnewline
Lambda & -0.164573876437431 \tabularnewline
\hline
\end{tabular}
%Source: https://freestatistics.org/blog/index.php?pk=106973&T=3

[TABLE]
[ROW][C]Regression: ln S.E.(k) = alpha + beta * ln Mean(k)[/C][/ROW]
[ROW][C]alpha[/C][C]-2.57115214933841[/C][/ROW]
[ROW][C]beta[/C][C]1.16457387643743[/C][/ROW]
[ROW][C]S.D.[/C][C]0.145080338877560[/C][/ROW]
[ROW][C]T-STAT[/C][C]8.02709647252938[/C][/ROW]
[ROW][C]p-value[/C][C]0.00130697697726522[/C][/ROW]
[ROW][C]Lambda[/C][C]-0.164573876437431[/C][/ROW]
[/TABLE]
Source: https://freestatistics.org/blog/index.php?pk=106973&T=3

Globally Unique Identifier (entire table): ba.freestatistics.org/blog/index.php?pk=106973&T=3

As an alternative you can also use a QR Code:  

The GUIDs for individual cells are displayed in the table below:

Regression: ln S.E.(k) = alpha + beta * ln Mean(k)
alpha-2.57115214933841
beta1.16457387643743
S.D.0.145080338877560
T-STAT8.02709647252938
p-value0.00130697697726522
Lambda-0.164573876437431


Parameters (Session):
par1 = 1 ; par2 = 0 ; par3 = 1 ; par4 = 12 ;
Parameters (R input):
par1 = 12 ;
R code (references can be found in the software module):
par1 <- as.numeric(par1)
(n <- length(x))
(np <- floor(n / par1))
arr <- array(NA,dim=c(par1,np))
j <- 0
k <- 1
for (i in 1:(np*par1))
{
j = j + 1
arr[j,k] <- x[i]
if (j == par1) {
j = 0
k=k+1
}
}
arr
arr.mean <- array(NA,dim=np)
arr.sd <- array(NA,dim=np)
arr.range <- array(NA,dim=np)
for (j in 1:np)
{
arr.mean[j] <- mean(arr[,j],na.rm=TRUE)
arr.sd[j] <- sd(arr[,j],na.rm=TRUE)
arr.range[j] <- max(arr[,j],na.rm=TRUE) - min(arr[,j],na.rm=TRUE)
}
arr.mean
arr.sd
arr.range
(lm1 <- lm(arr.sd~arr.mean))
(lnlm1 <- lm(log(arr.sd)~log(arr.mean)))
(lm2 <- lm(arr.range~arr.mean))
bitmap(file='test1.png')
plot(arr.mean,arr.sd,main='Standard Deviation-Mean Plot',xlab='mean',ylab='standard deviation')
dev.off()
bitmap(file='test2.png')
plot(arr.mean,arr.range,main='Range-Mean Plot',xlab='mean',ylab='range')
dev.off()
load(file='createtable')
a<-table.start()
a<-table.row.start(a)
a<-table.element(a,'Standard Deviation-Mean Plot',4,TRUE)
a<-table.row.end(a)
a<-table.row.start(a)
a<-table.element(a,'Section',header=TRUE)
a<-table.element(a,'Mean',header=TRUE)
a<-table.element(a,'Standard Deviation',header=TRUE)
a<-table.element(a,'Range',header=TRUE)
a<-table.row.end(a)
for (j in 1:np) {
a<-table.row.start(a)
a<-table.element(a,j,header=TRUE)
a<-table.element(a,arr.mean[j])
a<-table.element(a,arr.sd[j] )
a<-table.element(a,arr.range[j] )
a<-table.row.end(a)
}
a<-table.end(a)
table.save(a,file='mytable.tab')
a<-table.start()
a<-table.row.start(a)
a<-table.element(a,'Regression: S.E.(k) = alpha + beta * Mean(k)',2,TRUE)
a<-table.row.end(a)
a<-table.row.start(a)
a<-table.element(a,'alpha',header=TRUE)
a<-table.element(a,lm1$coefficients[[1]])
a<-table.row.end(a)
a<-table.row.start(a)
a<-table.element(a,'beta',header=TRUE)
a<-table.element(a,lm1$coefficients[[2]])
a<-table.row.end(a)
a<-table.row.start(a)
a<-table.element(a,'S.D.',header=TRUE)
a<-table.element(a,summary(lm1)$coefficients[2,2])
a<-table.row.end(a)
a<-table.row.start(a)
a<-table.element(a,'T-STAT',header=TRUE)
a<-table.element(a,summary(lm1)$coefficients[2,3])
a<-table.row.end(a)
a<-table.row.start(a)
a<-table.element(a,'p-value',header=TRUE)
a<-table.element(a,summary(lm1)$coefficients[2,4])
a<-table.row.end(a)
a<-table.end(a)
table.save(a,file='mytable1.tab')
a<-table.start()
a<-table.row.start(a)
a<-table.element(a,'Regression: ln S.E.(k) = alpha + beta * ln Mean(k)',2,TRUE)
a<-table.row.end(a)
a<-table.row.start(a)
a<-table.element(a,'alpha',header=TRUE)
a<-table.element(a,lnlm1$coefficients[[1]])
a<-table.row.end(a)
a<-table.row.start(a)
a<-table.element(a,'beta',header=TRUE)
a<-table.element(a,lnlm1$coefficients[[2]])
a<-table.row.end(a)
a<-table.row.start(a)
a<-table.element(a,'S.D.',header=TRUE)
a<-table.element(a,summary(lnlm1)$coefficients[2,2])
a<-table.row.end(a)
a<-table.row.start(a)
a<-table.element(a,'T-STAT',header=TRUE)
a<-table.element(a,summary(lnlm1)$coefficients[2,3])
a<-table.row.end(a)
a<-table.row.start(a)
a<-table.element(a,'p-value',header=TRUE)
a<-table.element(a,summary(lnlm1)$coefficients[2,4])
a<-table.row.end(a)
a<-table.row.start(a)
a<-table.element(a,'Lambda',header=TRUE)
a<-table.element(a,1-lnlm1$coefficients[[2]])
a<-table.row.end(a)
a<-table.end(a)
table.save(a,file='mytable2.tab')