Free Statistics

of Irreproducible Research!

Author's title

Author*The author of this computation has been verified*
R Software Modulerwasp_arimabackwardselection.wasp
Title produced by softwareARIMA Backward Selection
Date of computationTue, 07 Dec 2010 20:43:37 +0000
Cite this page as followsStatistical Computations at FreeStatistics.org, Office for Research Development and Education, URL https://freestatistics.org/blog/index.php?v=date/2010/Dec/07/t1291754514regu3r8z3m68k58.htm/, Retrieved Fri, 03 May 2024 18:43:03 +0000
Statistical Computations at FreeStatistics.org, Office for Research Development and Education, URL https://freestatistics.org/blog/index.php?pk=106731, Retrieved Fri, 03 May 2024 18:43:03 +0000
QR Codes:

Original text written by user:
IsPrivate?No (this computation is public)
User-defined keywords
Estimated Impact109
Family? (F = Feedback message, R = changed R code, M = changed R Module, P = changed Parameters, D = changed Data)
-     [Univariate Data Series] [data set] [2008-12-01 19:54:57] [b98453cac15ba1066b407e146608df68]
- RMP   [Standard Deviation-Mean Plot] [Unemployment] [2010-11-29 10:34:47] [b98453cac15ba1066b407e146608df68]
- RMP     [ARIMA Backward Selection] [Unemployment] [2010-11-29 17:10:28] [b98453cac15ba1066b407e146608df68]
-   PD      [ARIMA Backward Selection] [ARIMA openstaande...] [2010-12-07 19:57:58] [b11c112f8986de933f8b95cd30e75cc2]
-   P           [ARIMA Backward Selection] [ARIMA openstaande...] [2010-12-07 20:43:37] [be034431ba35f7eb1ce695fc7ca4deb9] [Current]
Feedback Forum

Post a new message
Dataseries X:
27951
29781
32914
33488
35652
36488
35387
35676
34844
32447
31068
29010
29812
30951
32974
32936
34012
32946
31948
30599
27691
25073
23406
22248
22896
25317
26558
26471
27543
26198
24725
25005
23462
20780
19815
19761
21454
23899
24939
23580
24562
24696
23785
23812
21917
19713
19282
18788
21453
24482
27474
27264
27349
30632
29429
30084
26290
24379
23335
21346
21106
24514
28353
30805
31348
34556
33855
34787
32529
29998
29257
28155
30466
35704
39327
39351
42234
43630
43722
43121
37985
37135
34646
33026
35087
38846
42013
43908
42868
44423
44167
43636
44382
42142
43452
36912
42413
45344
44873
47510
49554
47369
45998
48140
48441
44928
40454
38661
37246
36843
36424
37594
38144
38737
34560
36080
33508
35462
33374
32110
35533
35532
37903
36763
40399
44164
44496
43110
43880


Summary of computational transaction
Raw Inputview raw input (R code)
Raw Outputview raw output of R engine
Computing time16 seconds
R Server'RServer@AstonUniversity' @ vre.aston.ac.uk

\begin{tabular}{lllllllll}
\hline
Summary of computational transaction \tabularnewline
Raw Input & view raw input (R code)  \tabularnewline
Raw Output & view raw output of R engine  \tabularnewline
Computing time & 16 seconds \tabularnewline
R Server & 'RServer@AstonUniversity' @ vre.aston.ac.uk \tabularnewline
\hline
\end{tabular}
%Source: https://freestatistics.org/blog/index.php?pk=106731&T=0

[TABLE]
[ROW][C]Summary of computational transaction[/C][/ROW]
[ROW][C]Raw Input[/C][C]view raw input (R code) [/C][/ROW]
[ROW][C]Raw Output[/C][C]view raw output of R engine [/C][/ROW]
[ROW][C]Computing time[/C][C]16 seconds[/C][/ROW]
[ROW][C]R Server[/C][C]'RServer@AstonUniversity' @ vre.aston.ac.uk[/C][/ROW]
[/TABLE]
Source: https://freestatistics.org/blog/index.php?pk=106731&T=0

Globally Unique Identifier (entire table): ba.freestatistics.org/blog/index.php?pk=106731&T=0

As an alternative you can also use a QR Code:  

The GUIDs for individual cells are displayed in the table below:

Summary of computational transaction
Raw Inputview raw input (R code)
Raw Outputview raw output of R engine
Computing time16 seconds
R Server'RServer@AstonUniversity' @ vre.aston.ac.uk


ARIMA Parameter Estimation and Backward Selection
Iterationar1ar2ar3ma1sar1sar2sma1
Estimates ( 1 )0.22470.14380.0112-0.27431.1105-0.1123-0.9487
(p-val)(6e-04 )(0.1773 )(0.6139 )(0.0057 )(0 )(0.2692 )(0 )
Estimates ( 2 )0.17850.14190-0.22621.1079-0.1122-0.9227
(p-val)(0.744 )(0.1304 )(NA )(0.6834 )(0 )(0.3199 )(0 )
Estimates ( 3 )00.1340-0.05231.1027-0.1085-0.9105
(p-val)(NA )(0.1403 )(NA )(0.5825 )(0 )(0.3374 )(0 )
Estimates ( 4 )00.1256001.0805-0.0854-0.9197
(p-val)(NA )(0.1637 )(NA )(NA )(0 )(0.4329 )(0 )
Estimates ( 5 )00.115000.99170-0.8879
(p-val)(NA )(0.1974 )(NA )(NA )(0 )(NA )(0 )
Estimates ( 6 )00000.99330-0.8973
(p-val)(NA )(NA )(NA )(NA )(0 )(NA )(0 )
Estimates ( 7 )NANANANANANANA
(p-val)(NA )(NA )(NA )(NA )(NA )(NA )(NA )
Estimates ( 8 )NANANANANANANA
(p-val)(NA )(NA )(NA )(NA )(NA )(NA )(NA )
Estimates ( 9 )NANANANANANANA
(p-val)(NA )(NA )(NA )(NA )(NA )(NA )(NA )
Estimates ( 10 )NANANANANANANA
(p-val)(NA )(NA )(NA )(NA )(NA )(NA )(NA )
Estimates ( 11 )NANANANANANANA
(p-val)(NA )(NA )(NA )(NA )(NA )(NA )(NA )
Estimates ( 12 )NANANANANANANA
(p-val)(NA )(NA )(NA )(NA )(NA )(NA )(NA )
Estimates ( 13 )NANANANANANANA
(p-val)(NA )(NA )(NA )(NA )(NA )(NA )(NA )

\begin{tabular}{lllllllll}
\hline
ARIMA Parameter Estimation and Backward Selection \tabularnewline
Iteration & ar1 & ar2 & ar3 & ma1 & sar1 & sar2 & sma1 \tabularnewline
Estimates ( 1 ) & 0.2247 & 0.1438 & 0.0112 & -0.2743 & 1.1105 & -0.1123 & -0.9487 \tabularnewline
(p-val) & (6e-04 ) & (0.1773 ) & (0.6139 ) & (0.0057 ) & (0 ) & (0.2692 ) & (0 ) \tabularnewline
Estimates ( 2 ) & 0.1785 & 0.1419 & 0 & -0.2262 & 1.1079 & -0.1122 & -0.9227 \tabularnewline
(p-val) & (0.744 ) & (0.1304 ) & (NA ) & (0.6834 ) & (0 ) & (0.3199 ) & (0 ) \tabularnewline
Estimates ( 3 ) & 0 & 0.134 & 0 & -0.0523 & 1.1027 & -0.1085 & -0.9105 \tabularnewline
(p-val) & (NA ) & (0.1403 ) & (NA ) & (0.5825 ) & (0 ) & (0.3374 ) & (0 ) \tabularnewline
Estimates ( 4 ) & 0 & 0.1256 & 0 & 0 & 1.0805 & -0.0854 & -0.9197 \tabularnewline
(p-val) & (NA ) & (0.1637 ) & (NA ) & (NA ) & (0 ) & (0.4329 ) & (0 ) \tabularnewline
Estimates ( 5 ) & 0 & 0.115 & 0 & 0 & 0.9917 & 0 & -0.8879 \tabularnewline
(p-val) & (NA ) & (0.1974 ) & (NA ) & (NA ) & (0 ) & (NA ) & (0 ) \tabularnewline
Estimates ( 6 ) & 0 & 0 & 0 & 0 & 0.9933 & 0 & -0.8973 \tabularnewline
(p-val) & (NA ) & (NA ) & (NA ) & (NA ) & (0 ) & (NA ) & (0 ) \tabularnewline
Estimates ( 7 ) & NA & NA & NA & NA & NA & NA & NA \tabularnewline
(p-val) & (NA ) & (NA ) & (NA ) & (NA ) & (NA ) & (NA ) & (NA ) \tabularnewline
Estimates ( 8 ) & NA & NA & NA & NA & NA & NA & NA \tabularnewline
(p-val) & (NA ) & (NA ) & (NA ) & (NA ) & (NA ) & (NA ) & (NA ) \tabularnewline
Estimates ( 9 ) & NA & NA & NA & NA & NA & NA & NA \tabularnewline
(p-val) & (NA ) & (NA ) & (NA ) & (NA ) & (NA ) & (NA ) & (NA ) \tabularnewline
Estimates ( 10 ) & NA & NA & NA & NA & NA & NA & NA \tabularnewline
(p-val) & (NA ) & (NA ) & (NA ) & (NA ) & (NA ) & (NA ) & (NA ) \tabularnewline
Estimates ( 11 ) & NA & NA & NA & NA & NA & NA & NA \tabularnewline
(p-val) & (NA ) & (NA ) & (NA ) & (NA ) & (NA ) & (NA ) & (NA ) \tabularnewline
Estimates ( 12 ) & NA & NA & NA & NA & NA & NA & NA \tabularnewline
(p-val) & (NA ) & (NA ) & (NA ) & (NA ) & (NA ) & (NA ) & (NA ) \tabularnewline
Estimates ( 13 ) & NA & NA & NA & NA & NA & NA & NA \tabularnewline
(p-val) & (NA ) & (NA ) & (NA ) & (NA ) & (NA ) & (NA ) & (NA ) \tabularnewline
\hline
\end{tabular}
%Source: https://freestatistics.org/blog/index.php?pk=106731&T=1

[TABLE]
[ROW][C]ARIMA Parameter Estimation and Backward Selection[/C][/ROW]
[ROW][C]Iteration[/C][C]ar1[/C][C]ar2[/C][C]ar3[/C][C]ma1[/C][C]sar1[/C][C]sar2[/C][C]sma1[/C][/ROW]
[ROW][C]Estimates ( 1 )[/C][C]0.2247[/C][C]0.1438[/C][C]0.0112[/C][C]-0.2743[/C][C]1.1105[/C][C]-0.1123[/C][C]-0.9487[/C][/ROW]
[ROW][C](p-val)[/C][C](6e-04 )[/C][C](0.1773 )[/C][C](0.6139 )[/C][C](0.0057 )[/C][C](0 )[/C][C](0.2692 )[/C][C](0 )[/C][/ROW]
[ROW][C]Estimates ( 2 )[/C][C]0.1785[/C][C]0.1419[/C][C]0[/C][C]-0.2262[/C][C]1.1079[/C][C]-0.1122[/C][C]-0.9227[/C][/ROW]
[ROW][C](p-val)[/C][C](0.744 )[/C][C](0.1304 )[/C][C](NA )[/C][C](0.6834 )[/C][C](0 )[/C][C](0.3199 )[/C][C](0 )[/C][/ROW]
[ROW][C]Estimates ( 3 )[/C][C]0[/C][C]0.134[/C][C]0[/C][C]-0.0523[/C][C]1.1027[/C][C]-0.1085[/C][C]-0.9105[/C][/ROW]
[ROW][C](p-val)[/C][C](NA )[/C][C](0.1403 )[/C][C](NA )[/C][C](0.5825 )[/C][C](0 )[/C][C](0.3374 )[/C][C](0 )[/C][/ROW]
[ROW][C]Estimates ( 4 )[/C][C]0[/C][C]0.1256[/C][C]0[/C][C]0[/C][C]1.0805[/C][C]-0.0854[/C][C]-0.9197[/C][/ROW]
[ROW][C](p-val)[/C][C](NA )[/C][C](0.1637 )[/C][C](NA )[/C][C](NA )[/C][C](0 )[/C][C](0.4329 )[/C][C](0 )[/C][/ROW]
[ROW][C]Estimates ( 5 )[/C][C]0[/C][C]0.115[/C][C]0[/C][C]0[/C][C]0.9917[/C][C]0[/C][C]-0.8879[/C][/ROW]
[ROW][C](p-val)[/C][C](NA )[/C][C](0.1974 )[/C][C](NA )[/C][C](NA )[/C][C](0 )[/C][C](NA )[/C][C](0 )[/C][/ROW]
[ROW][C]Estimates ( 6 )[/C][C]0[/C][C]0[/C][C]0[/C][C]0[/C][C]0.9933[/C][C]0[/C][C]-0.8973[/C][/ROW]
[ROW][C](p-val)[/C][C](NA )[/C][C](NA )[/C][C](NA )[/C][C](NA )[/C][C](0 )[/C][C](NA )[/C][C](0 )[/C][/ROW]
[ROW][C]Estimates ( 7 )[/C][C]NA[/C][C]NA[/C][C]NA[/C][C]NA[/C][C]NA[/C][C]NA[/C][C]NA[/C][/ROW]
[ROW][C](p-val)[/C][C](NA )[/C][C](NA )[/C][C](NA )[/C][C](NA )[/C][C](NA )[/C][C](NA )[/C][C](NA )[/C][/ROW]
[ROW][C]Estimates ( 8 )[/C][C]NA[/C][C]NA[/C][C]NA[/C][C]NA[/C][C]NA[/C][C]NA[/C][C]NA[/C][/ROW]
[ROW][C](p-val)[/C][C](NA )[/C][C](NA )[/C][C](NA )[/C][C](NA )[/C][C](NA )[/C][C](NA )[/C][C](NA )[/C][/ROW]
[ROW][C]Estimates ( 9 )[/C][C]NA[/C][C]NA[/C][C]NA[/C][C]NA[/C][C]NA[/C][C]NA[/C][C]NA[/C][/ROW]
[ROW][C](p-val)[/C][C](NA )[/C][C](NA )[/C][C](NA )[/C][C](NA )[/C][C](NA )[/C][C](NA )[/C][C](NA )[/C][/ROW]
[ROW][C]Estimates ( 10 )[/C][C]NA[/C][C]NA[/C][C]NA[/C][C]NA[/C][C]NA[/C][C]NA[/C][C]NA[/C][/ROW]
[ROW][C](p-val)[/C][C](NA )[/C][C](NA )[/C][C](NA )[/C][C](NA )[/C][C](NA )[/C][C](NA )[/C][C](NA )[/C][/ROW]
[ROW][C]Estimates ( 11 )[/C][C]NA[/C][C]NA[/C][C]NA[/C][C]NA[/C][C]NA[/C][C]NA[/C][C]NA[/C][/ROW]
[ROW][C](p-val)[/C][C](NA )[/C][C](NA )[/C][C](NA )[/C][C](NA )[/C][C](NA )[/C][C](NA )[/C][C](NA )[/C][/ROW]
[ROW][C]Estimates ( 12 )[/C][C]NA[/C][C]NA[/C][C]NA[/C][C]NA[/C][C]NA[/C][C]NA[/C][C]NA[/C][/ROW]
[ROW][C](p-val)[/C][C](NA )[/C][C](NA )[/C][C](NA )[/C][C](NA )[/C][C](NA )[/C][C](NA )[/C][C](NA )[/C][/ROW]
[ROW][C]Estimates ( 13 )[/C][C]NA[/C][C]NA[/C][C]NA[/C][C]NA[/C][C]NA[/C][C]NA[/C][C]NA[/C][/ROW]
[ROW][C](p-val)[/C][C](NA )[/C][C](NA )[/C][C](NA )[/C][C](NA )[/C][C](NA )[/C][C](NA )[/C][C](NA )[/C][/ROW]
[/TABLE]
Source: https://freestatistics.org/blog/index.php?pk=106731&T=1

Globally Unique Identifier (entire table): ba.freestatistics.org/blog/index.php?pk=106731&T=1

As an alternative you can also use a QR Code:  

The GUIDs for individual cells are displayed in the table below:

ARIMA Parameter Estimation and Backward Selection
Iterationar1ar2ar3ma1sar1sar2sma1
Estimates ( 1 )0.22470.14380.0112-0.27431.1105-0.1123-0.9487
(p-val)(6e-04 )(0.1773 )(0.6139 )(0.0057 )(0 )(0.2692 )(0 )
Estimates ( 2 )0.17850.14190-0.22621.1079-0.1122-0.9227
(p-val)(0.744 )(0.1304 )(NA )(0.6834 )(0 )(0.3199 )(0 )
Estimates ( 3 )00.1340-0.05231.1027-0.1085-0.9105
(p-val)(NA )(0.1403 )(NA )(0.5825 )(0 )(0.3374 )(0 )
Estimates ( 4 )00.1256001.0805-0.0854-0.9197
(p-val)(NA )(0.1637 )(NA )(NA )(0 )(0.4329 )(0 )
Estimates ( 5 )00.115000.99170-0.8879
(p-val)(NA )(0.1974 )(NA )(NA )(0 )(NA )(0 )
Estimates ( 6 )00000.99330-0.8973
(p-val)(NA )(NA )(NA )(NA )(0 )(NA )(0 )
Estimates ( 7 )NANANANANANANA
(p-val)(NA )(NA )(NA )(NA )(NA )(NA )(NA )
Estimates ( 8 )NANANANANANANA
(p-val)(NA )(NA )(NA )(NA )(NA )(NA )(NA )
Estimates ( 9 )NANANANANANANA
(p-val)(NA )(NA )(NA )(NA )(NA )(NA )(NA )
Estimates ( 10 )NANANANANANANA
(p-val)(NA )(NA )(NA )(NA )(NA )(NA )(NA )
Estimates ( 11 )NANANANANANANA
(p-val)(NA )(NA )(NA )(NA )(NA )(NA )(NA )
Estimates ( 12 )NANANANANANANA
(p-val)(NA )(NA )(NA )(NA )(NA )(NA )(NA )
Estimates ( 13 )NANANANANANANA
(p-val)(NA )(NA )(NA )(NA )(NA )(NA )(NA )


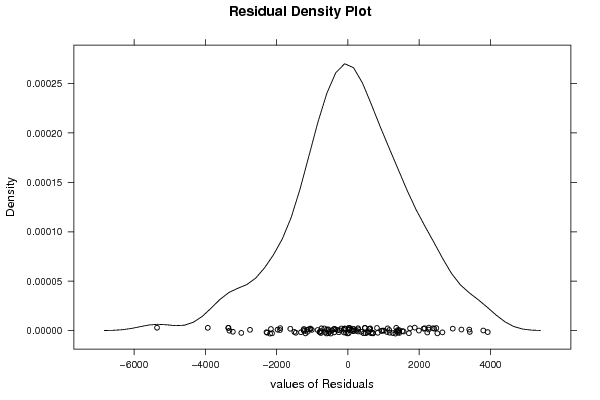
Estimated ARIMA Residuals
Value
27.950976622897
1414.94366460615
2422.41035105348
282.970849956893
1403.92537598526
599.219571577211
-1050.85035669581
149.149688766679
-550.709428076515
-1900.05583886482
-1013.34797228526
-1463.20412154273
622.592661842837
441.183486231473
473.542077184343
-291.697817066321
21.7370358052902
-1232.53565714038
-444.88393781887
-1148.19765181499
-2161.09119794079
-1192.62033797174
-663.103792547
-82.3254400851054
285.270955896014
1402.33877039897
-347.923540837355
-389.22900649858
100.778527766852
-1136.40191879236
-760.839638889973
698.131608716673
-256.684118170995
-1097.18967900063
17.7826694513015
966.43907584968
1092.296296685
1005.07748698574
-554.126339213824
-1504.37202115774
21.6674838032083
648.920178078584
-57.5373042501317
141.085214823355
-601.054621475802
-385.791013932127
549.089060161151
283.100732019065
1710.67011604356
1435.80387479236
1333.25758591277
-183.768384163996
-1051.33951935494
3417.0856578476
-235.504551256427
368.493430852147
-2286.14923730613
-115.19216307141
61.3670150954573
-1236.47387365441
-1318.80819397922
1741.40650996166
2264.30786258355
2383.20071817895
-520.681855335565
2479.30094581487
231.506672862536
583.642184808439
-483.892368052343
-742.974787867924
168.854282389926
-102.632193720199
1354.80722506309
3183.27667134295
1441.32259203534
-556.205911284502
1873.94780597026
612.347878234962
700.716577392037
-798.817399692986
-3326.96326509892
1169.05418622237
-1246.5307699675
-783.52759049472
1114.15204411468
1362.60595225142
837.812816448579
1526.90036725334
-2185.63337473127
478.475574275989
697.029337844985
-636.690676000163
2940.68211100933
-383.169501113519
1990.42283206798
-5357.98834495881
3922.2152290929
941.854775617397
-3230.96342433971
2153.09737216972
1562.55607876632
-3351.97027604272
-851.16552370737
2508.12253169068
2226.10532374749
-1907.39303646246
-3933.53175442654
163.873750038202
-2749.62690192811
-2993.23533451323
-1974.61917030017
813.717364769876
-112.263265383793
-10.9020665331828
-3358.9127999869
1263.10754159449
-589.962877049765
3796.86199954683
-760.066526366091
30.2895782419618
2123.89261227523
-2272.70634850763
493.298137132996
-1618.12442707864
2650.46445118558
3404.86100017436
1157.6260384756
-2131.675383792
2269.61395790178

\begin{tabular}{lllllllll}
\hline
Estimated ARIMA Residuals \tabularnewline
Value \tabularnewline
27.950976622897 \tabularnewline
1414.94366460615 \tabularnewline
2422.41035105348 \tabularnewline
282.970849956893 \tabularnewline
1403.92537598526 \tabularnewline
599.219571577211 \tabularnewline
-1050.85035669581 \tabularnewline
149.149688766679 \tabularnewline
-550.709428076515 \tabularnewline
-1900.05583886482 \tabularnewline
-1013.34797228526 \tabularnewline
-1463.20412154273 \tabularnewline
622.592661842837 \tabularnewline
441.183486231473 \tabularnewline
473.542077184343 \tabularnewline
-291.697817066321 \tabularnewline
21.7370358052902 \tabularnewline
-1232.53565714038 \tabularnewline
-444.88393781887 \tabularnewline
-1148.19765181499 \tabularnewline
-2161.09119794079 \tabularnewline
-1192.62033797174 \tabularnewline
-663.103792547 \tabularnewline
-82.3254400851054 \tabularnewline
285.270955896014 \tabularnewline
1402.33877039897 \tabularnewline
-347.923540837355 \tabularnewline
-389.22900649858 \tabularnewline
100.778527766852 \tabularnewline
-1136.40191879236 \tabularnewline
-760.839638889973 \tabularnewline
698.131608716673 \tabularnewline
-256.684118170995 \tabularnewline
-1097.18967900063 \tabularnewline
17.7826694513015 \tabularnewline
966.43907584968 \tabularnewline
1092.296296685 \tabularnewline
1005.07748698574 \tabularnewline
-554.126339213824 \tabularnewline
-1504.37202115774 \tabularnewline
21.6674838032083 \tabularnewline
648.920178078584 \tabularnewline
-57.5373042501317 \tabularnewline
141.085214823355 \tabularnewline
-601.054621475802 \tabularnewline
-385.791013932127 \tabularnewline
549.089060161151 \tabularnewline
283.100732019065 \tabularnewline
1710.67011604356 \tabularnewline
1435.80387479236 \tabularnewline
1333.25758591277 \tabularnewline
-183.768384163996 \tabularnewline
-1051.33951935494 \tabularnewline
3417.0856578476 \tabularnewline
-235.504551256427 \tabularnewline
368.493430852147 \tabularnewline
-2286.14923730613 \tabularnewline
-115.19216307141 \tabularnewline
61.3670150954573 \tabularnewline
-1236.47387365441 \tabularnewline
-1318.80819397922 \tabularnewline
1741.40650996166 \tabularnewline
2264.30786258355 \tabularnewline
2383.20071817895 \tabularnewline
-520.681855335565 \tabularnewline
2479.30094581487 \tabularnewline
231.506672862536 \tabularnewline
583.642184808439 \tabularnewline
-483.892368052343 \tabularnewline
-742.974787867924 \tabularnewline
168.854282389926 \tabularnewline
-102.632193720199 \tabularnewline
1354.80722506309 \tabularnewline
3183.27667134295 \tabularnewline
1441.32259203534 \tabularnewline
-556.205911284502 \tabularnewline
1873.94780597026 \tabularnewline
612.347878234962 \tabularnewline
700.716577392037 \tabularnewline
-798.817399692986 \tabularnewline
-3326.96326509892 \tabularnewline
1169.05418622237 \tabularnewline
-1246.5307699675 \tabularnewline
-783.52759049472 \tabularnewline
1114.15204411468 \tabularnewline
1362.60595225142 \tabularnewline
837.812816448579 \tabularnewline
1526.90036725334 \tabularnewline
-2185.63337473127 \tabularnewline
478.475574275989 \tabularnewline
697.029337844985 \tabularnewline
-636.690676000163 \tabularnewline
2940.68211100933 \tabularnewline
-383.169501113519 \tabularnewline
1990.42283206798 \tabularnewline
-5357.98834495881 \tabularnewline
3922.2152290929 \tabularnewline
941.854775617397 \tabularnewline
-3230.96342433971 \tabularnewline
2153.09737216972 \tabularnewline
1562.55607876632 \tabularnewline
-3351.97027604272 \tabularnewline
-851.16552370737 \tabularnewline
2508.12253169068 \tabularnewline
2226.10532374749 \tabularnewline
-1907.39303646246 \tabularnewline
-3933.53175442654 \tabularnewline
163.873750038202 \tabularnewline
-2749.62690192811 \tabularnewline
-2993.23533451323 \tabularnewline
-1974.61917030017 \tabularnewline
813.717364769876 \tabularnewline
-112.263265383793 \tabularnewline
-10.9020665331828 \tabularnewline
-3358.9127999869 \tabularnewline
1263.10754159449 \tabularnewline
-589.962877049765 \tabularnewline
3796.86199954683 \tabularnewline
-760.066526366091 \tabularnewline
30.2895782419618 \tabularnewline
2123.89261227523 \tabularnewline
-2272.70634850763 \tabularnewline
493.298137132996 \tabularnewline
-1618.12442707864 \tabularnewline
2650.46445118558 \tabularnewline
3404.86100017436 \tabularnewline
1157.6260384756 \tabularnewline
-2131.675383792 \tabularnewline
2269.61395790178 \tabularnewline
\hline
\end{tabular}
%Source: https://freestatistics.org/blog/index.php?pk=106731&T=2

[TABLE]
[ROW][C]Estimated ARIMA Residuals[/C][/ROW]
[ROW][C]Value[/C][/ROW]
[ROW][C]27.950976622897[/C][/ROW]
[ROW][C]1414.94366460615[/C][/ROW]
[ROW][C]2422.41035105348[/C][/ROW]
[ROW][C]282.970849956893[/C][/ROW]
[ROW][C]1403.92537598526[/C][/ROW]
[ROW][C]599.219571577211[/C][/ROW]
[ROW][C]-1050.85035669581[/C][/ROW]
[ROW][C]149.149688766679[/C][/ROW]
[ROW][C]-550.709428076515[/C][/ROW]
[ROW][C]-1900.05583886482[/C][/ROW]
[ROW][C]-1013.34797228526[/C][/ROW]
[ROW][C]-1463.20412154273[/C][/ROW]
[ROW][C]622.592661842837[/C][/ROW]
[ROW][C]441.183486231473[/C][/ROW]
[ROW][C]473.542077184343[/C][/ROW]
[ROW][C]-291.697817066321[/C][/ROW]
[ROW][C]21.7370358052902[/C][/ROW]
[ROW][C]-1232.53565714038[/C][/ROW]
[ROW][C]-444.88393781887[/C][/ROW]
[ROW][C]-1148.19765181499[/C][/ROW]
[ROW][C]-2161.09119794079[/C][/ROW]
[ROW][C]-1192.62033797174[/C][/ROW]
[ROW][C]-663.103792547[/C][/ROW]
[ROW][C]-82.3254400851054[/C][/ROW]
[ROW][C]285.270955896014[/C][/ROW]
[ROW][C]1402.33877039897[/C][/ROW]
[ROW][C]-347.923540837355[/C][/ROW]
[ROW][C]-389.22900649858[/C][/ROW]
[ROW][C]100.778527766852[/C][/ROW]
[ROW][C]-1136.40191879236[/C][/ROW]
[ROW][C]-760.839638889973[/C][/ROW]
[ROW][C]698.131608716673[/C][/ROW]
[ROW][C]-256.684118170995[/C][/ROW]
[ROW][C]-1097.18967900063[/C][/ROW]
[ROW][C]17.7826694513015[/C][/ROW]
[ROW][C]966.43907584968[/C][/ROW]
[ROW][C]1092.296296685[/C][/ROW]
[ROW][C]1005.07748698574[/C][/ROW]
[ROW][C]-554.126339213824[/C][/ROW]
[ROW][C]-1504.37202115774[/C][/ROW]
[ROW][C]21.6674838032083[/C][/ROW]
[ROW][C]648.920178078584[/C][/ROW]
[ROW][C]-57.5373042501317[/C][/ROW]
[ROW][C]141.085214823355[/C][/ROW]
[ROW][C]-601.054621475802[/C][/ROW]
[ROW][C]-385.791013932127[/C][/ROW]
[ROW][C]549.089060161151[/C][/ROW]
[ROW][C]283.100732019065[/C][/ROW]
[ROW][C]1710.67011604356[/C][/ROW]
[ROW][C]1435.80387479236[/C][/ROW]
[ROW][C]1333.25758591277[/C][/ROW]
[ROW][C]-183.768384163996[/C][/ROW]
[ROW][C]-1051.33951935494[/C][/ROW]
[ROW][C]3417.0856578476[/C][/ROW]
[ROW][C]-235.504551256427[/C][/ROW]
[ROW][C]368.493430852147[/C][/ROW]
[ROW][C]-2286.14923730613[/C][/ROW]
[ROW][C]-115.19216307141[/C][/ROW]
[ROW][C]61.3670150954573[/C][/ROW]
[ROW][C]-1236.47387365441[/C][/ROW]
[ROW][C]-1318.80819397922[/C][/ROW]
[ROW][C]1741.40650996166[/C][/ROW]
[ROW][C]2264.30786258355[/C][/ROW]
[ROW][C]2383.20071817895[/C][/ROW]
[ROW][C]-520.681855335565[/C][/ROW]
[ROW][C]2479.30094581487[/C][/ROW]
[ROW][C]231.506672862536[/C][/ROW]
[ROW][C]583.642184808439[/C][/ROW]
[ROW][C]-483.892368052343[/C][/ROW]
[ROW][C]-742.974787867924[/C][/ROW]
[ROW][C]168.854282389926[/C][/ROW]
[ROW][C]-102.632193720199[/C][/ROW]
[ROW][C]1354.80722506309[/C][/ROW]
[ROW][C]3183.27667134295[/C][/ROW]
[ROW][C]1441.32259203534[/C][/ROW]
[ROW][C]-556.205911284502[/C][/ROW]
[ROW][C]1873.94780597026[/C][/ROW]
[ROW][C]612.347878234962[/C][/ROW]
[ROW][C]700.716577392037[/C][/ROW]
[ROW][C]-798.817399692986[/C][/ROW]
[ROW][C]-3326.96326509892[/C][/ROW]
[ROW][C]1169.05418622237[/C][/ROW]
[ROW][C]-1246.5307699675[/C][/ROW]
[ROW][C]-783.52759049472[/C][/ROW]
[ROW][C]1114.15204411468[/C][/ROW]
[ROW][C]1362.60595225142[/C][/ROW]
[ROW][C]837.812816448579[/C][/ROW]
[ROW][C]1526.90036725334[/C][/ROW]
[ROW][C]-2185.63337473127[/C][/ROW]
[ROW][C]478.475574275989[/C][/ROW]
[ROW][C]697.029337844985[/C][/ROW]
[ROW][C]-636.690676000163[/C][/ROW]
[ROW][C]2940.68211100933[/C][/ROW]
[ROW][C]-383.169501113519[/C][/ROW]
[ROW][C]1990.42283206798[/C][/ROW]
[ROW][C]-5357.98834495881[/C][/ROW]
[ROW][C]3922.2152290929[/C][/ROW]
[ROW][C]941.854775617397[/C][/ROW]
[ROW][C]-3230.96342433971[/C][/ROW]
[ROW][C]2153.09737216972[/C][/ROW]
[ROW][C]1562.55607876632[/C][/ROW]
[ROW][C]-3351.97027604272[/C][/ROW]
[ROW][C]-851.16552370737[/C][/ROW]
[ROW][C]2508.12253169068[/C][/ROW]
[ROW][C]2226.10532374749[/C][/ROW]
[ROW][C]-1907.39303646246[/C][/ROW]
[ROW][C]-3933.53175442654[/C][/ROW]
[ROW][C]163.873750038202[/C][/ROW]
[ROW][C]-2749.62690192811[/C][/ROW]
[ROW][C]-2993.23533451323[/C][/ROW]
[ROW][C]-1974.61917030017[/C][/ROW]
[ROW][C]813.717364769876[/C][/ROW]
[ROW][C]-112.263265383793[/C][/ROW]
[ROW][C]-10.9020665331828[/C][/ROW]
[ROW][C]-3358.9127999869[/C][/ROW]
[ROW][C]1263.10754159449[/C][/ROW]
[ROW][C]-589.962877049765[/C][/ROW]
[ROW][C]3796.86199954683[/C][/ROW]
[ROW][C]-760.066526366091[/C][/ROW]
[ROW][C]30.2895782419618[/C][/ROW]
[ROW][C]2123.89261227523[/C][/ROW]
[ROW][C]-2272.70634850763[/C][/ROW]
[ROW][C]493.298137132996[/C][/ROW]
[ROW][C]-1618.12442707864[/C][/ROW]
[ROW][C]2650.46445118558[/C][/ROW]
[ROW][C]3404.86100017436[/C][/ROW]
[ROW][C]1157.6260384756[/C][/ROW]
[ROW][C]-2131.675383792[/C][/ROW]
[ROW][C]2269.61395790178[/C][/ROW]
[/TABLE]
Source: https://freestatistics.org/blog/index.php?pk=106731&T=2

Globally Unique Identifier (entire table): ba.freestatistics.org/blog/index.php?pk=106731&T=2

As an alternative you can also use a QR Code:  

The GUIDs for individual cells are displayed in the table below:

Estimated ARIMA Residuals
Value
27.950976622897
1414.94366460615
2422.41035105348
282.970849956893
1403.92537598526
599.219571577211
-1050.85035669581
149.149688766679
-550.709428076515
-1900.05583886482
-1013.34797228526
-1463.20412154273
622.592661842837
441.183486231473
473.542077184343
-291.697817066321
21.7370358052902
-1232.53565714038
-444.88393781887
-1148.19765181499
-2161.09119794079
-1192.62033797174
-663.103792547
-82.3254400851054
285.270955896014
1402.33877039897
-347.923540837355
-389.22900649858
100.778527766852
-1136.40191879236
-760.839638889973
698.131608716673
-256.684118170995
-1097.18967900063
17.7826694513015
966.43907584968
1092.296296685
1005.07748698574
-554.126339213824
-1504.37202115774
21.6674838032083
648.920178078584
-57.5373042501317
141.085214823355
-601.054621475802
-385.791013932127
549.089060161151
283.100732019065
1710.67011604356
1435.80387479236
1333.25758591277
-183.768384163996
-1051.33951935494
3417.0856578476
-235.504551256427
368.493430852147
-2286.14923730613
-115.19216307141
61.3670150954573
-1236.47387365441
-1318.80819397922
1741.40650996166
2264.30786258355
2383.20071817895
-520.681855335565
2479.30094581487
231.506672862536
583.642184808439
-483.892368052343
-742.974787867924
168.854282389926
-102.632193720199
1354.80722506309
3183.27667134295
1441.32259203534
-556.205911284502
1873.94780597026
612.347878234962
700.716577392037
-798.817399692986
-3326.96326509892
1169.05418622237
-1246.5307699675
-783.52759049472
1114.15204411468
1362.60595225142
837.812816448579
1526.90036725334
-2185.63337473127
478.475574275989
697.029337844985
-636.690676000163
2940.68211100933
-383.169501113519
1990.42283206798
-5357.98834495881
3922.2152290929
941.854775617397
-3230.96342433971
2153.09737216972
1562.55607876632
-3351.97027604272
-851.16552370737
2508.12253169068
2226.10532374749
-1907.39303646246
-3933.53175442654
163.873750038202
-2749.62690192811
-2993.23533451323
-1974.61917030017
813.717364769876
-112.263265383793
-10.9020665331828
-3358.9127999869
1263.10754159449
-589.962877049765
3796.86199954683
-760.066526366091
30.2895782419618
2123.89261227523
-2272.70634850763
493.298137132996
-1618.12442707864
2650.46445118558
3404.86100017436
1157.6260384756
-2131.675383792
2269.61395790178


Parameters (Session):
par1 = FALSE ; par2 = 1 ; par3 = 1 ; par4 = 0 ; par5 = 12 ; par6 = 3 ; par7 = 1 ; par8 = 2 ; par9 = 1 ;
Parameters (R input):
par1 = FALSE ; par2 = 1 ; par3 = 1 ; par4 = 0 ; par5 = 12 ; par6 = 3 ; par7 = 1 ; par8 = 2 ; par9 = 1 ;
R code (references can be found in the software module):
library(lattice)
if (par1 == 'TRUE') par1 <- TRUE
if (par1 == 'FALSE') par1 <- FALSE
par2 <- as.numeric(par2) #Box-Cox lambda transformation parameter
par3 <- as.numeric(par3) #degree of non-seasonal differencing
par4 <- as.numeric(par4) #degree of seasonal differencing
par5 <- as.numeric(par5) #seasonal period
par6 <- as.numeric(par6) #degree (p) of the non-seasonal AR(p) polynomial
par7 <- as.numeric(par7) #degree (q) of the non-seasonal MA(q) polynomial
par8 <- as.numeric(par8) #degree (P) of the seasonal AR(P) polynomial
par9 <- as.numeric(par9) #degree (Q) of the seasonal MA(Q) polynomial
armaGR <- function(arima.out, names, n){
try1 <- arima.out$coef
try2 <- sqrt(diag(arima.out$var.coef))
try.data.frame <- data.frame(matrix(NA,ncol=4,nrow=length(names)))
dimnames(try.data.frame) <- list(names,c('coef','std','tstat','pv'))
try.data.frame[,1] <- try1
for(i in 1:length(try2)) try.data.frame[which(rownames(try.data.frame)==names(try2)[i]),2] <- try2[i]
try.data.frame[,3] <- try.data.frame[,1] / try.data.frame[,2]
try.data.frame[,4] <- round((1-pt(abs(try.data.frame[,3]),df=n-(length(try2)+1)))*2,5)
vector <- rep(NA,length(names))
vector[is.na(try.data.frame[,4])] <- 0
maxi <- which.max(try.data.frame[,4])
continue <- max(try.data.frame[,4],na.rm=TRUE) > .05
vector[maxi] <- 0
list(summary=try.data.frame,next.vector=vector,continue=continue)
}
arimaSelect <- function(series, order=c(13,0,0), seasonal=list(order=c(2,0,0),period=12), include.mean=F){
nrc <- order[1]+order[3]+seasonal$order[1]+seasonal$order[3]
coeff <- matrix(NA, nrow=nrc*2, ncol=nrc)
pval <- matrix(NA, nrow=nrc*2, ncol=nrc)
mylist <- rep(list(NULL), nrc)
names <- NULL
if(order[1] > 0) names <- paste('ar',1:order[1],sep='')
if(order[3] > 0) names <- c( names , paste('ma',1:order[3],sep='') )
if(seasonal$order[1] > 0) names <- c(names, paste('sar',1:seasonal$order[1],sep=''))
if(seasonal$order[3] > 0) names <- c(names, paste('sma',1:seasonal$order[3],sep=''))
arima.out <- arima(series, order=order, seasonal=seasonal, include.mean=include.mean, method='ML')
mylist[[1]] <- arima.out
last.arma <- armaGR(arima.out, names, length(series))
mystop <- FALSE
i <- 1
coeff[i,] <- last.arma[[1]][,1]
pval [i,] <- last.arma[[1]][,4]
i <- 2
aic <- arima.out$aic
while(!mystop){
mylist[[i]] <- arima.out
arima.out <- arima(series, order=order, seasonal=seasonal, include.mean=include.mean, method='ML', fixed=last.arma$next.vector)
aic <- c(aic, arima.out$aic)
last.arma <- armaGR(arima.out, names, length(series))
mystop <- !last.arma$continue
coeff[i,] <- last.arma[[1]][,1]
pval [i,] <- last.arma[[1]][,4]
i <- i+1
}
list(coeff, pval, mylist, aic=aic)
}
arimaSelectplot <- function(arimaSelect.out,noms,choix){
noms <- names(arimaSelect.out[[3]][[1]]$coef)
coeff <- arimaSelect.out[[1]]
k <- min(which(is.na(coeff[,1])))-1
coeff <- coeff[1:k,]
pval <- arimaSelect.out[[2]][1:k,]
aic <- arimaSelect.out$aic[1:k]
coeff[coeff==0] <- NA
n <- ncol(coeff)
if(missing(choix)) choix <- k
layout(matrix(c(1,1,1,2,
3,3,3,2,
3,3,3,4,
5,6,7,7),nr=4),
widths=c(10,35,45,15),
heights=c(30,30,15,15))
couleurs <- rainbow(75)[1:50]#(50)
ticks <- pretty(coeff)
par(mar=c(1,1,3,1))
plot(aic,k:1-.5,type='o',pch=21,bg='blue',cex=2,axes=F,lty=2,xpd=NA)
points(aic[choix],k-choix+.5,pch=21,cex=4,bg=2,xpd=NA)
title('aic',line=2)
par(mar=c(3,0,0,0))
plot(0,axes=F,xlab='',ylab='',xlim=range(ticks),ylim=c(.1,1))
rect(xleft = min(ticks) + (0:49)/50*(max(ticks)-min(ticks)),
xright = min(ticks) + (1:50)/50*(max(ticks)-min(ticks)),
ytop = rep(1,50),
ybottom= rep(0,50),col=couleurs,border=NA)
axis(1,ticks)
rect(xleft=min(ticks),xright=max(ticks),ytop=1,ybottom=0)
text(mean(coeff,na.rm=T),.5,'coefficients',cex=2,font=2)
par(mar=c(1,1,3,1))
image(1:n,1:k,t(coeff[k:1,]),axes=F,col=couleurs,zlim=range(ticks))
for(i in 1:n) for(j in 1:k) if(!is.na(coeff[j,i])) {
if(pval[j,i]<.01) symb = 'green'
else if( (pval[j,i]<.05) & (pval[j,i]>=.01)) symb = 'orange'
else if( (pval[j,i]<.1) & (pval[j,i]>=.05)) symb = 'red'
else symb = 'black'
polygon(c(i+.5 ,i+.2 ,i+.5 ,i+.5),
c(k-j+0.5,k-j+0.5,k-j+0.8,k-j+0.5),
col=symb)
if(j==choix) {
rect(xleft=i-.5,
xright=i+.5,
ybottom=k-j+1.5,
ytop=k-j+.5,
lwd=4)
text(i,
k-j+1,
round(coeff[j,i],2),
cex=1.2,
font=2)
}
else{
rect(xleft=i-.5,xright=i+.5,ybottom=k-j+1.5,ytop=k-j+.5)
text(i,k-j+1,round(coeff[j,i],2),cex=1.2,font=1)
}
}
axis(3,1:n,noms)
par(mar=c(0.5,0,0,0.5))
plot(0,axes=F,xlab='',ylab='',type='n',xlim=c(0,8),ylim=c(-.2,.8))
cols <- c('green','orange','red','black')
niv <- c('0','0.01','0.05','0.1')
for(i in 0:3){
polygon(c(1+2*i ,1+2*i ,1+2*i-.5 ,1+2*i),
c(.4 ,.7 , .4 , .4),
col=cols[i+1])
text(2*i,0.5,niv[i+1],cex=1.5)
}
text(8,.5,1,cex=1.5)
text(4,0,'p-value',cex=2)
box()
residus <- arimaSelect.out[[3]][[choix]]$res
par(mar=c(1,2,4,1))
acf(residus,main='')
title('acf',line=.5)
par(mar=c(1,2,4,1))
pacf(residus,main='')
title('pacf',line=.5)
par(mar=c(2,2,4,1))
qqnorm(residus,main='')
title('qq-norm',line=.5)
qqline(residus)
residus
}
if (par2 == 0) x <- log(x)
if (par2 != 0) x <- x^par2
(selection <- arimaSelect(x, order=c(par6,par3,par7), seasonal=list(order=c(par8,par4,par9), period=par5)))
bitmap(file='test1.png')
resid <- arimaSelectplot(selection)
dev.off()
resid
bitmap(file='test2.png')
acf(resid,length(resid)/2, main='Residual Autocorrelation Function')
dev.off()
bitmap(file='test3.png')
pacf(resid,length(resid)/2, main='Residual Partial Autocorrelation Function')
dev.off()
bitmap(file='test4.png')
cpgram(resid, main='Residual Cumulative Periodogram')
dev.off()
bitmap(file='test5.png')
hist(resid, main='Residual Histogram', xlab='values of Residuals')
dev.off()
bitmap(file='test6.png')
densityplot(~resid,col='black',main='Residual Density Plot', xlab='values of Residuals')
dev.off()
bitmap(file='test7.png')
qqnorm(resid, main='Residual Normal Q-Q Plot')
qqline(resid)
dev.off()
ncols <- length(selection[[1]][1,])
nrows <- length(selection[[2]][,1])-1
load(file='createtable')
a<-table.start()
a<-table.row.start(a)
a<-table.element(a,'ARIMA Parameter Estimation and Backward Selection', ncols+1,TRUE)
a<-table.row.end(a)
a<-table.row.start(a)
a<-table.element(a,'Iteration', header=TRUE)
for (i in 1:ncols) {
a<-table.element(a,names(selection[[3]][[1]]$coef)[i],header=TRUE)
}
a<-table.row.end(a)
for (j in 1:nrows) {
a<-table.row.start(a)
mydum <- 'Estimates ('
mydum <- paste(mydum,j)
mydum <- paste(mydum,')')
a<-table.element(a,mydum, header=TRUE)
for (i in 1:ncols) {
a<-table.element(a,round(selection[[1]][j,i],4))
}
a<-table.row.end(a)
a<-table.row.start(a)
a<-table.element(a,'(p-val)', header=TRUE)
for (i in 1:ncols) {
mydum <- '('
mydum <- paste(mydum,round(selection[[2]][j,i],4),sep='')
mydum <- paste(mydum,')')
a<-table.element(a,mydum)
}
a<-table.row.end(a)
}
a<-table.end(a)
table.save(a,file='mytable.tab')
a<-table.start()
a<-table.row.start(a)
a<-table.element(a,'Estimated ARIMA Residuals', 1,TRUE)
a<-table.row.end(a)
a<-table.row.start(a)
a<-table.element(a,'Value', 1,TRUE)
a<-table.row.end(a)
for (i in (par4*par5+par3):length(resid)) {
a<-table.row.start(a)
a<-table.element(a,resid[i])
a<-table.row.end(a)
}
a<-table.end(a)
table.save(a,file='mytable1.tab')