| Multiple Linear Regression - Estimated Regression Equation |
| Consumptieindexprijs[t] = + 103.373409090909 + 0.0529318181817703M1[t] + 0.392545454545451M2[t] + 0.312159090909086M3[t] + 0.493772727272725M4[t] + 0.627386363636359M5[t] + 0.510999999999996M6[t] + 0.596613636363628M7[t] + 0.350227272727270M8[t] + 0.169840909090903M9[t] + 0.0514545454545356M10[t] + 0.0953863636363579M11[t] + 0.190386363636364t + e[t] |
| Multiple Linear Regression - Ordinary Least Squares | |||||
| Variable | Parameter | S.D. | T-STAT H0: parameter = 0 | 2-tail p-value | 1-tail p-value |
| (Intercept) | 103.373409090909 | 0.679554 | 152.1194 | 0 | 0 |
| M1 | 0.0529318181817703 | 0.824423 | 0.0642 | 0.949092 | 0.474546 |
| M2 | 0.392545454545451 | 0.823904 | 0.4764 | 0.636062 | 0.318031 |
| M3 | 0.312159090909086 | 0.8235 | 0.3791 | 0.706423 | 0.353212 |
| M4 | 0.493772727272725 | 0.823212 | 0.5998 | 0.55164 | 0.27582 |
| M5 | 0.627386363636359 | 0.823039 | 0.7623 | 0.44987 | 0.224935 |
| M6 | 0.510999999999996 | 0.822981 | 0.6209 | 0.537789 | 0.268895 |
| M7 | 0.596613636363628 | 0.823039 | 0.7249 | 0.472271 | 0.236136 |
| M8 | 0.350227272727270 | 0.823212 | 0.4254 | 0.672544 | 0.336272 |
| M9 | 0.169840909090903 | 0.8235 | 0.2062 | 0.837532 | 0.418766 |
| M10 | 0.0514545454545356 | 0.823904 | 0.0625 | 0.950479 | 0.47524 |
| M11 | 0.0953863636363579 | 0.867553 | 0.1099 | 0.912939 | 0.456469 |
| t | 0.190386363636364 | 0.009748 | 19.5312 | 0 | 0 |
| Multiple Linear Regression - Regression Statistics | |
| Multiple R | 0.947165971215957 |
| R-squared | 0.897123377029467 |
| Adjusted R-squared | 0.869689610903991 |
| F-TEST (value) | 32.7014297973613 |
| F-TEST (DF numerator) | 12 |
| F-TEST (DF denominator) | 45 |
| p-value | 0 |
| Multiple Linear Regression - Residual Statistics | |
| Residual Standard Deviation | 1.22682766565322 |
| Sum Squared Residuals | 67.7297754545456 |
| Multiple Linear Regression - Actuals, Interpolation, and Residuals | |||
| Time or Index | Actuals | Interpolation Forecast | Residuals Prediction Error |
| 1 | 103.48 | 103.616727272727 | -0.136727272727445 |
| 2 | 103.93 | 104.146727272727 | -0.216727272727259 |
| 3 | 103.89 | 104.256727272727 | -0.366727272727266 |
| 4 | 104.4 | 104.628727272727 | -0.228727272727262 |
| 5 | 104.79 | 104.952727272727 | -0.162727272727259 |
| 6 | 104.77 | 105.026727272727 | -0.256727272727271 |
| 7 | 105.13 | 105.302727272727 | -0.172727272727268 |
| 8 | 105.26 | 105.246727272727 | 0.0132727272727364 |
| 9 | 104.96 | 105.256727272727 | -0.296727272727272 |
| 10 | 104.75 | 105.328727272727 | -0.578727272727262 |
| 11 | 105.01 | 105.563045454545 | -0.553045454545445 |
| 12 | 105.15 | 105.658045454545 | -0.508045454545449 |
| 13 | 105.2 | 105.901363636364 | -0.70136363636359 |
| 14 | 105.77 | 106.431363636364 | -0.661363636363637 |
| 15 | 105.78 | 106.541363636364 | -0.761363636363631 |
| 16 | 106.26 | 106.913363636364 | -0.65336363636363 |
| 17 | 106.13 | 107.237363636364 | -1.10736363636364 |
| 18 | 106.12 | 107.311363636364 | -1.19136363636363 |
| 19 | 106.57 | 107.587363636364 | -1.01736363636364 |
| 20 | 106.44 | 107.531363636364 | -1.09136363636364 |
| 21 | 106.54 | 107.541363636364 | -1.00136363636363 |
| 22 | 107.1 | 107.613363636364 | -0.513363636363634 |
| 23 | 108.1 | 107.847681818182 | 0.252318181818179 |
| 24 | 108.4 | 107.942681818182 | 0.457318181818184 |
| 25 | 108.84 | 108.186 | 0.654000000000048 |
| 26 | 109.62 | 108.716 | 0.904000000000005 |
| 27 | 110.42 | 108.826 | 1.59400000000000 |
| 28 | 110.67 | 109.198 | 1.472 |
| 29 | 111.66 | 109.522 | 2.13800000000000 |
| 30 | 112.28 | 109.596 | 2.684 |
| 31 | 112.87 | 109.872 | 2.99800000000001 |
| 32 | 112.18 | 109.816 | 2.36400000000000 |
| 33 | 112.36 | 109.826 | 2.534 |
| 34 | 112.16 | 109.898 | 2.262 |
| 35 | 111.49 | 110.132318181818 | 1.35768181818181 |
| 36 | 111.25 | 110.227318181818 | 1.02268181818181 |
| 37 | 111.36 | 110.470636363636 | 0.889363636363678 |
| 38 | 111.74 | 111.000636363636 | 0.739363636363628 |
| 39 | 111.1 | 111.110636363636 | -0.0106363636363711 |
| 40 | 111.33 | 111.482636363636 | -0.152636363636371 |
| 41 | 111.25 | 111.806636363636 | -0.556636363636368 |
| 42 | 111.04 | 111.880636363636 | -0.840636363636362 |
| 43 | 110.97 | 112.156636363636 | -1.18663636363636 |
| 44 | 111.31 | 112.100636363636 | -0.790636363636367 |
| 45 | 111.02 | 112.110636363636 | -1.09063636363637 |
| 46 | 111.07 | 112.182636363636 | -1.11263636363637 |
| 47 | 111.36 | 112.416954545455 | -1.05695454545455 |
| 48 | 111.54 | 112.511954545455 | -0.971954545454548 |
| 49 | 112.05 | 112.755272727273 | -0.705272727272692 |
| 50 | 112.52 | 113.285272727273 | -0.765272727272738 |
| 51 | 112.94 | 113.395272727273 | -0.455272727272735 |
| 52 | 113.33 | 113.767272727273 | -0.437272727272737 |
| 53 | 113.78 | 114.091272727273 | -0.311272727272733 |
| 54 | 113.77 | 114.165272727273 | -0.395272727272737 |
| 55 | 113.82 | 114.441272727273 | -0.621272727272739 |
| 56 | 113.89 | 114.385272727273 | -0.495272727272736 |
| 57 | 114.25 | 114.395272727273 | -0.145272727272733 |
| 58 | 114.41 | 114.467272727273 | -0.0572727272727344 |
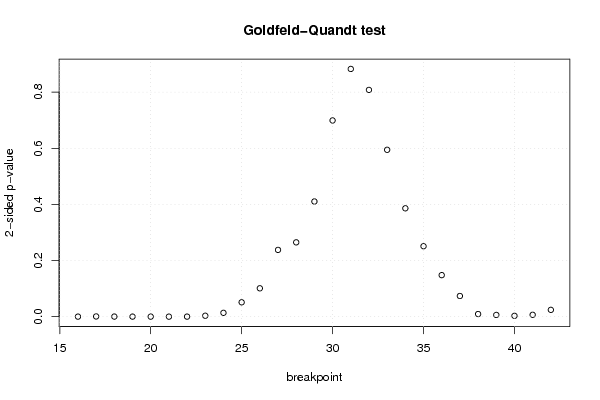
| Goldfeld-Quandt test for Heteroskedasticity | |||
| p-values | Alternative Hypothesis | ||
| breakpoint index | greater | 2-sided | less |
| 16 | 7.30168962605973e-05 | 0.000146033792521195 | 0.99992698310374 |
| 17 | 0.000374024374560540 | 0.000748048749121081 | 0.99962597562544 |
| 18 | 0.000141988202878381 | 0.000283976405756761 | 0.999858011797122 |
| 19 | 3.22493177008497e-05 | 6.44986354016994e-05 | 0.9999677506823 |
| 20 | 2.45812555089469e-05 | 4.91625110178938e-05 | 0.999975418744491 |
| 21 | 8.11282689917961e-06 | 1.62256537983592e-05 | 0.9999918871731 |
| 22 | 6.12792521584869e-05 | 0.000122558504316974 | 0.999938720747842 |
| 23 | 0.0016377244469181 | 0.0032754488938362 | 0.998362275553082 |
| 24 | 0.00682588236301327 | 0.0136517647260265 | 0.993174117636987 |
| 25 | 0.0255723293274583 | 0.0511446586549167 | 0.974427670672542 |
| 26 | 0.0505123810050003 | 0.101024762010001 | 0.949487618995 |
| 27 | 0.118900980916420 | 0.237801961832839 | 0.88109901908358 |
| 28 | 0.132383534906900 | 0.264767069813799 | 0.8676164650931 |
| 29 | 0.205155081651326 | 0.410310163302652 | 0.794844918348674 |
| 30 | 0.34954619062035 | 0.6990923812407 | 0.65045380937965 |
| 31 | 0.558725808218555 | 0.88254838356289 | 0.441274191781445 |
| 32 | 0.596109971540002 | 0.807780056919996 | 0.403890028459998 |
| 33 | 0.702760721642858 | 0.594478556714284 | 0.297239278357142 |
| 34 | 0.806988810606245 | 0.386022378787510 | 0.193011189393755 |
| 35 | 0.874545551873577 | 0.250908896252847 | 0.125454448126423 |
| 36 | 0.926051792940868 | 0.147896414118264 | 0.073948207059132 |
| 37 | 0.963185290692964 | 0.0736294186140724 | 0.0368147093070362 |
| 38 | 0.995312496686628 | 0.0093750066267433 | 0.00468750331337165 |
| 39 | 0.996930856608685 | 0.00613828678262989 | 0.00306914339131495 |
| 40 | 0.99853645473261 | 0.0029270905347812 | 0.0014635452673906 |
| 41 | 0.996673916919879 | 0.00665216616024273 | 0.00332608308012136 |
| 42 | 0.987896329482582 | 0.0242073410348360 | 0.0121036705174180 |
| Meta Analysis of Goldfeld-Quandt test for Heteroskedasticity | |||
| Description | # significant tests | % significant tests | OK/NOK |
| 1% type I error level | 12 | 0.444444444444444 | NOK |
| 5% type I error level | 14 | 0.518518518518518 | NOK |
| 10% type I error level | 16 | 0.592592592592593 | NOK |