Free Statistics

of Irreproducible Research!

Author's title

Author*The author of this computation has been verified*
R Software Modulerwasp_smp.wasp
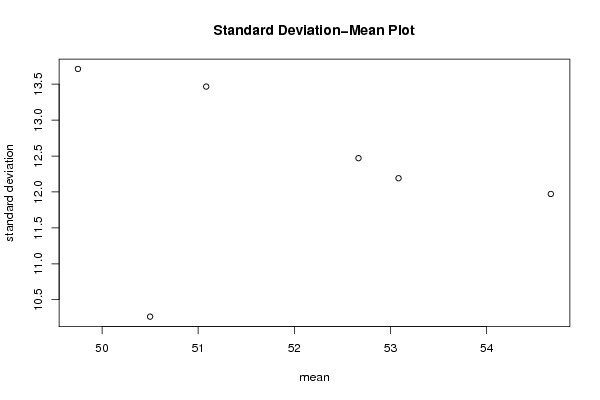
Title produced by softwareStandard Deviation-Mean Plot
Date of computationTue, 07 Dec 2010 19:22:00 +0000
Cite this page as followsStatistical Computations at FreeStatistics.org, Office for Research Development and Education, URL https://freestatistics.org/blog/index.php?v=date/2010/Dec/07/t1291749630uysv5a8ssegq01s.htm/, Retrieved Fri, 03 May 2024 19:12:16 +0000
Statistical Computations at FreeStatistics.org, Office for Research Development and Education, URL https://freestatistics.org/blog/index.php?pk=106661, Retrieved Fri, 03 May 2024 19:12:16 +0000
QR Codes:

Original text written by user:
IsPrivate?No (this computation is public)
User-defined keywords
Estimated Impact117
Family? (F = Feedback message, R = changed R code, M = changed R Module, P = changed Parameters, D = changed Data)
-     [Univariate Data Series] [data set] [2008-12-01 19:54:57] [b98453cac15ba1066b407e146608df68]
- RMP   [Standard Deviation-Mean Plot] [Unemployment] [2010-11-29 10:34:47] [b98453cac15ba1066b407e146608df68]
F   PD      [Standard Deviation-Mean Plot] [] [2010-12-07 19:22:00] [7b390cc0228d34e5578246b07143e3df] [Current]
Feedback Forum
2010-12-10 14:12:42 [Pascal Wijnen] [reply
De student bekomt voor zijn/haar gegevens de juiste grafiek en interpretatie.
2010-12-13 17:56:58 [00c625c7d009d84797af914265b614f9] [reply
We zien duidelijk dat er geen verband bestaat tussen variantie en gemiddelde. We kunnen zeggen dat de slope (beta) gelijk is aan 0. Want de kans dat we ons vergissen bij het verwerpen van de nulhypothese(beta = 0) is zeer hoog namelijk 73%. Er moet dus geen box-cox transformatie gebeuren.

Post a new message
Dataseries X:
46
62
66
59
58
61
41
27
58
70
49
59
44
36
72
45
56
54
53
35
61
52
47
51
52
63
74
45
51
64
36
30
55
64
39
40
63
45
59
55
40
64
27
28
45
57
45
69
60
56
58
50
51
53
37
22
55
70
62
58
39
49
58
47
42
62
39
40
72
70
54
65


Summary of computational transaction
Raw Inputview raw input (R code)
Raw Outputview raw output of R engine
Computing time2 seconds
R Server'George Udny Yule' @ 72.249.76.132

\begin{tabular}{lllllllll}
\hline
Summary of computational transaction \tabularnewline
Raw Input & view raw input (R code)  \tabularnewline
Raw Output & view raw output of R engine  \tabularnewline
Computing time & 2 seconds \tabularnewline
R Server & 'George Udny Yule' @ 72.249.76.132 \tabularnewline
\hline
\end{tabular}
%Source: https://freestatistics.org/blog/index.php?pk=106661&T=0

[TABLE]
[ROW][C]Summary of computational transaction[/C][/ROW]
[ROW][C]Raw Input[/C][C]view raw input (R code) [/C][/ROW]
[ROW][C]Raw Output[/C][C]view raw output of R engine [/C][/ROW]
[ROW][C]Computing time[/C][C]2 seconds[/C][/ROW]
[ROW][C]R Server[/C][C]'George Udny Yule' @ 72.249.76.132[/C][/ROW]
[/TABLE]
Source: https://freestatistics.org/blog/index.php?pk=106661&T=0

Globally Unique Identifier (entire table): ba.freestatistics.org/blog/index.php?pk=106661&T=0

As an alternative you can also use a QR Code:  

The GUIDs for individual cells are displayed in the table below:

Summary of computational transaction
Raw Inputview raw input (R code)
Raw Outputview raw output of R engine
Computing time2 seconds
R Server'George Udny Yule' @ 72.249.76.132


Standard Deviation-Mean Plot
SectionMeanStandard DeviationRange
154.666666666666711.972189997378643
250.510.264679067736937
351.083333333333313.466850433789744
449.7513.712137954116742
552.666666666666712.470571418950848
653.083333333333312.191340692425433

\begin{tabular}{lllllllll}
\hline
Standard Deviation-Mean Plot \tabularnewline
Section & Mean & Standard Deviation & Range \tabularnewline
1 & 54.6666666666667 & 11.9721899973786 & 43 \tabularnewline
2 & 50.5 & 10.2646790677369 & 37 \tabularnewline
3 & 51.0833333333333 & 13.4668504337897 & 44 \tabularnewline
4 & 49.75 & 13.7121379541167 & 42 \tabularnewline
5 & 52.6666666666667 & 12.4705714189508 & 48 \tabularnewline
6 & 53.0833333333333 & 12.1913406924254 & 33 \tabularnewline
\hline
\end{tabular}
%Source: https://freestatistics.org/blog/index.php?pk=106661&T=1

[TABLE]
[ROW][C]Standard Deviation-Mean Plot[/C][/ROW]
[ROW][C]Section[/C][C]Mean[/C][C]Standard Deviation[/C][C]Range[/C][/ROW]
[ROW][C]1[/C][C]54.6666666666667[/C][C]11.9721899973786[/C][C]43[/C][/ROW]
[ROW][C]2[/C][C]50.5[/C][C]10.2646790677369[/C][C]37[/C][/ROW]
[ROW][C]3[/C][C]51.0833333333333[/C][C]13.4668504337897[/C][C]44[/C][/ROW]
[ROW][C]4[/C][C]49.75[/C][C]13.7121379541167[/C][C]42[/C][/ROW]
[ROW][C]5[/C][C]52.6666666666667[/C][C]12.4705714189508[/C][C]48[/C][/ROW]
[ROW][C]6[/C][C]53.0833333333333[/C][C]12.1913406924254[/C][C]33[/C][/ROW]
[/TABLE]
Source: https://freestatistics.org/blog/index.php?pk=106661&T=1

Globally Unique Identifier (entire table): ba.freestatistics.org/blog/index.php?pk=106661&T=1

As an alternative you can also use a QR Code:  

The GUIDs for individual cells are displayed in the table below:

Standard Deviation-Mean Plot
SectionMeanStandard DeviationRange
154.666666666666711.972189997378643
250.510.264679067736937
351.083333333333313.466850433789744
449.7513.712137954116742
552.666666666666712.470571418950848
653.083333333333312.191340692425433


Regression: S.E.(k) = alpha + beta * Mean(k)
alpha18.6919922134068
beta-0.122130501093962
S.D.0.33073593097988
T-STAT-0.369268923192358
p-value0.730644321403998

\begin{tabular}{lllllllll}
\hline
Regression: S.E.(k) = alpha + beta * Mean(k) \tabularnewline
alpha & 18.6919922134068 \tabularnewline
beta & -0.122130501093962 \tabularnewline
S.D. & 0.33073593097988 \tabularnewline
T-STAT & -0.369268923192358 \tabularnewline
p-value & 0.730644321403998 \tabularnewline
\hline
\end{tabular}
%Source: https://freestatistics.org/blog/index.php?pk=106661&T=2

[TABLE]
[ROW][C]Regression: S.E.(k) = alpha + beta * Mean(k)[/C][/ROW]
[ROW][C]alpha[/C][C]18.6919922134068[/C][/ROW]
[ROW][C]beta[/C][C]-0.122130501093962[/C][/ROW]
[ROW][C]S.D.[/C][C]0.33073593097988[/C][/ROW]
[ROW][C]T-STAT[/C][C]-0.369268923192358[/C][/ROW]
[ROW][C]p-value[/C][C]0.730644321403998[/C][/ROW]
[/TABLE]
Source: https://freestatistics.org/blog/index.php?pk=106661&T=2

Globally Unique Identifier (entire table): ba.freestatistics.org/blog/index.php?pk=106661&T=2

As an alternative you can also use a QR Code:  

The GUIDs for individual cells are displayed in the table below:

Regression: S.E.(k) = alpha + beta * Mean(k)
alpha18.6919922134068
beta-0.122130501093962
S.D.0.33073593097988
T-STAT-0.369268923192358
p-value0.730644321403998


Regression: ln S.E.(k) = alpha + beta * ln Mean(k)
alpha4.09200505081258
beta-0.400772512903992
S.D.1.45747244856086
T-STAT-0.274977762564036
p-value0.79695219984824
Lambda1.40077251290399

\begin{tabular}{lllllllll}
\hline
Regression: ln S.E.(k) = alpha + beta * ln Mean(k) \tabularnewline
alpha & 4.09200505081258 \tabularnewline
beta & -0.400772512903992 \tabularnewline
S.D. & 1.45747244856086 \tabularnewline
T-STAT & -0.274977762564036 \tabularnewline
p-value & 0.79695219984824 \tabularnewline
Lambda & 1.40077251290399 \tabularnewline
\hline
\end{tabular}
%Source: https://freestatistics.org/blog/index.php?pk=106661&T=3

[TABLE]
[ROW][C]Regression: ln S.E.(k) = alpha + beta * ln Mean(k)[/C][/ROW]
[ROW][C]alpha[/C][C]4.09200505081258[/C][/ROW]
[ROW][C]beta[/C][C]-0.400772512903992[/C][/ROW]
[ROW][C]S.D.[/C][C]1.45747244856086[/C][/ROW]
[ROW][C]T-STAT[/C][C]-0.274977762564036[/C][/ROW]
[ROW][C]p-value[/C][C]0.79695219984824[/C][/ROW]
[ROW][C]Lambda[/C][C]1.40077251290399[/C][/ROW]
[/TABLE]
Source: https://freestatistics.org/blog/index.php?pk=106661&T=3

Globally Unique Identifier (entire table): ba.freestatistics.org/blog/index.php?pk=106661&T=3

As an alternative you can also use a QR Code:  

The GUIDs for individual cells are displayed in the table below:

Regression: ln S.E.(k) = alpha + beta * ln Mean(k)
alpha4.09200505081258
beta-0.400772512903992
S.D.1.45747244856086
T-STAT-0.274977762564036
p-value0.79695219984824
Lambda1.40077251290399


Parameters (Session):
par1 = 12 ;
Parameters (R input):
par1 = 12 ;
R code (references can be found in the software module):
par1 <- as.numeric(par1)
(n <- length(x))
(np <- floor(n / par1))
arr <- array(NA,dim=c(par1,np))
j <- 0
k <- 1
for (i in 1:(np*par1))
{
j = j + 1
arr[j,k] <- x[i]
if (j == par1) {
j = 0
k=k+1
}
}
arr
arr.mean <- array(NA,dim=np)
arr.sd <- array(NA,dim=np)
arr.range <- array(NA,dim=np)
for (j in 1:np)
{
arr.mean[j] <- mean(arr[,j],na.rm=TRUE)
arr.sd[j] <- sd(arr[,j],na.rm=TRUE)
arr.range[j] <- max(arr[,j],na.rm=TRUE) - min(arr[,j],na.rm=TRUE)
}
arr.mean
arr.sd
arr.range
(lm1 <- lm(arr.sd~arr.mean))
(lnlm1 <- lm(log(arr.sd)~log(arr.mean)))
(lm2 <- lm(arr.range~arr.mean))
bitmap(file='test1.png')
plot(arr.mean,arr.sd,main='Standard Deviation-Mean Plot',xlab='mean',ylab='standard deviation')
dev.off()
bitmap(file='test2.png')
plot(arr.mean,arr.range,main='Range-Mean Plot',xlab='mean',ylab='range')
dev.off()
load(file='createtable')
a<-table.start()
a<-table.row.start(a)
a<-table.element(a,'Standard Deviation-Mean Plot',4,TRUE)
a<-table.row.end(a)
a<-table.row.start(a)
a<-table.element(a,'Section',header=TRUE)
a<-table.element(a,'Mean',header=TRUE)
a<-table.element(a,'Standard Deviation',header=TRUE)
a<-table.element(a,'Range',header=TRUE)
a<-table.row.end(a)
for (j in 1:np) {
a<-table.row.start(a)
a<-table.element(a,j,header=TRUE)
a<-table.element(a,arr.mean[j])
a<-table.element(a,arr.sd[j] )
a<-table.element(a,arr.range[j] )
a<-table.row.end(a)
}
a<-table.end(a)
table.save(a,file='mytable.tab')
a<-table.start()
a<-table.row.start(a)
a<-table.element(a,'Regression: S.E.(k) = alpha + beta * Mean(k)',2,TRUE)
a<-table.row.end(a)
a<-table.row.start(a)
a<-table.element(a,'alpha',header=TRUE)
a<-table.element(a,lm1$coefficients[[1]])
a<-table.row.end(a)
a<-table.row.start(a)
a<-table.element(a,'beta',header=TRUE)
a<-table.element(a,lm1$coefficients[[2]])
a<-table.row.end(a)
a<-table.row.start(a)
a<-table.element(a,'S.D.',header=TRUE)
a<-table.element(a,summary(lm1)$coefficients[2,2])
a<-table.row.end(a)
a<-table.row.start(a)
a<-table.element(a,'T-STAT',header=TRUE)
a<-table.element(a,summary(lm1)$coefficients[2,3])
a<-table.row.end(a)
a<-table.row.start(a)
a<-table.element(a,'p-value',header=TRUE)
a<-table.element(a,summary(lm1)$coefficients[2,4])
a<-table.row.end(a)
a<-table.end(a)
table.save(a,file='mytable1.tab')
a<-table.start()
a<-table.row.start(a)
a<-table.element(a,'Regression: ln S.E.(k) = alpha + beta * ln Mean(k)',2,TRUE)
a<-table.row.end(a)
a<-table.row.start(a)
a<-table.element(a,'alpha',header=TRUE)
a<-table.element(a,lnlm1$coefficients[[1]])
a<-table.row.end(a)
a<-table.row.start(a)
a<-table.element(a,'beta',header=TRUE)
a<-table.element(a,lnlm1$coefficients[[2]])
a<-table.row.end(a)
a<-table.row.start(a)
a<-table.element(a,'S.D.',header=TRUE)
a<-table.element(a,summary(lnlm1)$coefficients[2,2])
a<-table.row.end(a)
a<-table.row.start(a)
a<-table.element(a,'T-STAT',header=TRUE)
a<-table.element(a,summary(lnlm1)$coefficients[2,3])
a<-table.row.end(a)
a<-table.row.start(a)
a<-table.element(a,'p-value',header=TRUE)
a<-table.element(a,summary(lnlm1)$coefficients[2,4])
a<-table.row.end(a)
a<-table.row.start(a)
a<-table.element(a,'Lambda',header=TRUE)
a<-table.element(a,1-lnlm1$coefficients[[2]])
a<-table.row.end(a)
a<-table.end(a)
table.save(a,file='mytable2.tab')