Free Statistics

of Irreproducible Research!

Author's title

Author*The author of this computation has been verified*
R Software Modulerwasp_autocorrelation.wasp
Title produced by software(Partial) Autocorrelation Function
Date of computationTue, 07 Dec 2010 17:13:11 +0000
Cite this page as followsStatistical Computations at FreeStatistics.org, Office for Research Development and Education, URL https://freestatistics.org/blog/index.php?v=date/2010/Dec/07/t12917418866y709qoe76dj1om.htm/, Retrieved Sat, 04 May 2024 05:11:30 +0000
Statistical Computations at FreeStatistics.org, Office for Research Development and Education, URL https://freestatistics.org/blog/index.php?pk=106538, Retrieved Sat, 04 May 2024 05:11:30 +0000
QR Codes:

Original text written by user:
IsPrivate?No (this computation is public)
User-defined keywords
Estimated Impact145
Family? (F = Feedback message, R = changed R code, M = changed R Module, P = changed Parameters, D = changed Data)
-     [Univariate Data Series] [data set] [2008-12-01 19:54:57] [b98453cac15ba1066b407e146608df68]
- RMP   [(Partial) Autocorrelation Function] [Unemployment] [2010-11-29 09:13:00] [b98453cac15ba1066b407e146608df68]
-   PD    [(Partial) Autocorrelation Function] [WS 9 - ACF] [2010-12-04 11:15:33] [8ef49741e164ec6343c90c7935194465]
-   P         [(Partial) Autocorrelation Function] [WS 9_ ACF] [2010-12-07 17:13:11] [b47314d83d48c7bf812ec2bcd743b159] [Current]
Feedback Forum

Post a new message
Dataseries X:
167.16
179.84
174.44
180.35
193.17
195.16
202.43
189.91
195.98
212.09
205.81
204.31
196.07
199.98
199.1
198.31
195.72
223.04
238.41
259.73
326.54
335.15
321.81
368.62
369.59
425
439.72
362.23
328.76
348.55
328.18
329.34
295.55
237.38
226.85
220.14
239.36
224.69
230.98
233.47
256.7
253.41
224.95
210.37
191.09
198.85
211.04
206.25
201.19
194.37
191.08
192.87
181.61
157.67
196.14
246.35
271.9


Summary of computational transaction
Raw Inputview raw input (R code)
Raw Outputview raw output of R engine
Computing time2 seconds
R Server'Sir Ronald Aylmer Fisher' @ 193.190.124.24

\begin{tabular}{lllllllll}
\hline
Summary of computational transaction \tabularnewline
Raw Input & view raw input (R code)  \tabularnewline
Raw Output & view raw output of R engine  \tabularnewline
Computing time & 2 seconds \tabularnewline
R Server & 'Sir Ronald Aylmer Fisher' @ 193.190.124.24 \tabularnewline
\hline
\end{tabular}
%Source: https://freestatistics.org/blog/index.php?pk=106538&T=0

[TABLE]
[ROW][C]Summary of computational transaction[/C][/ROW]
[ROW][C]Raw Input[/C][C]view raw input (R code) [/C][/ROW]
[ROW][C]Raw Output[/C][C]view raw output of R engine [/C][/ROW]
[ROW][C]Computing time[/C][C]2 seconds[/C][/ROW]
[ROW][C]R Server[/C][C]'Sir Ronald Aylmer Fisher' @ 193.190.124.24[/C][/ROW]
[/TABLE]
Source: https://freestatistics.org/blog/index.php?pk=106538&T=0

Globally Unique Identifier (entire table): ba.freestatistics.org/blog/index.php?pk=106538&T=0

As an alternative you can also use a QR Code:  

The GUIDs for individual cells are displayed in the table below:

Summary of computational transaction
Raw Inputview raw input (R code)
Raw Outputview raw output of R engine
Computing time2 seconds
R Server'Sir Ronald Aylmer Fisher' @ 193.190.124.24


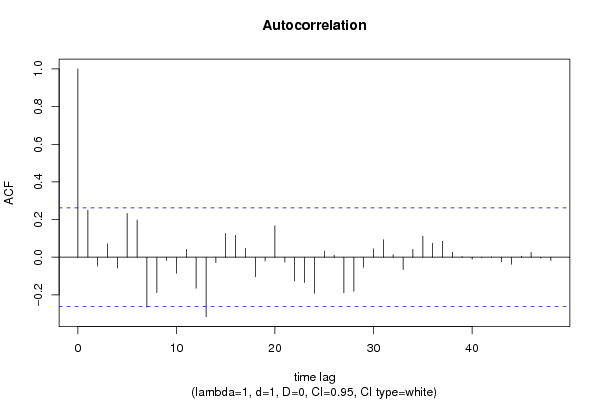
Autocorrelation Function
Time lag kACF(k)T-STATP-value
10.2496191.8680.033501
2-0.046606-0.34880.364287
30.0709470.53090.298788
4-0.057127-0.42750.335328
50.2327311.74160.043535
60.197591.47860.072422
7-0.265478-1.98670.025931
8-0.188-1.40690.082497
9-0.017749-0.13280.447404
10-0.084779-0.63440.264193
110.0409120.30620.380311
12-0.164468-1.23080.111777
13-0.31584-2.36350.010799
14-0.029003-0.2170.414484
150.1252870.93760.176248
160.1160570.86850.194415
170.0481470.36030.359989
18-0.103744-0.77630.220405
19-0.019614-0.14680.441918
200.1669951.24970.108308
21-0.025661-0.1920.424207
22-0.126029-0.94310.174837
23-0.13441-1.00580.159411
24-0.191542-1.43340.078656
250.0325430.24350.404242
260.0108860.08150.467681
27-0.188532-1.41080.081911
28-0.181261-1.35640.090202
29-0.053334-0.39910.345663
300.0442760.33130.370816
310.0927210.69390.24532
320.0134930.1010.459966
33-0.06558-0.49080.312759
340.0405540.30350.381326
350.1113070.83290.204208
360.0741590.5550.290569
370.0842050.63010.265586
380.026260.19650.42246
390.0042840.03210.487271
40-0.010391-0.07780.469147
41-0.002689-0.02010.492008
420.0010260.00770.49695
43-0.024511-0.18340.427565
44-0.037961-0.28410.388701
450.0049120.03680.485406
460.0250930.18780.425863
47-0.004827-0.03610.485657
48-0.018067-0.13520.446469

\begin{tabular}{lllllllll}
\hline
Autocorrelation Function \tabularnewline
Time lag k & ACF(k) & T-STAT & P-value \tabularnewline
1 & 0.249619 & 1.868 & 0.033501 \tabularnewline
2 & -0.046606 & -0.3488 & 0.364287 \tabularnewline
3 & 0.070947 & 0.5309 & 0.298788 \tabularnewline
4 & -0.057127 & -0.4275 & 0.335328 \tabularnewline
5 & 0.232731 & 1.7416 & 0.043535 \tabularnewline
6 & 0.19759 & 1.4786 & 0.072422 \tabularnewline
7 & -0.265478 & -1.9867 & 0.025931 \tabularnewline
8 & -0.188 & -1.4069 & 0.082497 \tabularnewline
9 & -0.017749 & -0.1328 & 0.447404 \tabularnewline
10 & -0.084779 & -0.6344 & 0.264193 \tabularnewline
11 & 0.040912 & 0.3062 & 0.380311 \tabularnewline
12 & -0.164468 & -1.2308 & 0.111777 \tabularnewline
13 & -0.31584 & -2.3635 & 0.010799 \tabularnewline
14 & -0.029003 & -0.217 & 0.414484 \tabularnewline
15 & 0.125287 & 0.9376 & 0.176248 \tabularnewline
16 & 0.116057 & 0.8685 & 0.194415 \tabularnewline
17 & 0.048147 & 0.3603 & 0.359989 \tabularnewline
18 & -0.103744 & -0.7763 & 0.220405 \tabularnewline
19 & -0.019614 & -0.1468 & 0.441918 \tabularnewline
20 & 0.166995 & 1.2497 & 0.108308 \tabularnewline
21 & -0.025661 & -0.192 & 0.424207 \tabularnewline
22 & -0.126029 & -0.9431 & 0.174837 \tabularnewline
23 & -0.13441 & -1.0058 & 0.159411 \tabularnewline
24 & -0.191542 & -1.4334 & 0.078656 \tabularnewline
25 & 0.032543 & 0.2435 & 0.404242 \tabularnewline
26 & 0.010886 & 0.0815 & 0.467681 \tabularnewline
27 & -0.188532 & -1.4108 & 0.081911 \tabularnewline
28 & -0.181261 & -1.3564 & 0.090202 \tabularnewline
29 & -0.053334 & -0.3991 & 0.345663 \tabularnewline
30 & 0.044276 & 0.3313 & 0.370816 \tabularnewline
31 & 0.092721 & 0.6939 & 0.24532 \tabularnewline
32 & 0.013493 & 0.101 & 0.459966 \tabularnewline
33 & -0.06558 & -0.4908 & 0.312759 \tabularnewline
34 & 0.040554 & 0.3035 & 0.381326 \tabularnewline
35 & 0.111307 & 0.8329 & 0.204208 \tabularnewline
36 & 0.074159 & 0.555 & 0.290569 \tabularnewline
37 & 0.084205 & 0.6301 & 0.265586 \tabularnewline
38 & 0.02626 & 0.1965 & 0.42246 \tabularnewline
39 & 0.004284 & 0.0321 & 0.487271 \tabularnewline
40 & -0.010391 & -0.0778 & 0.469147 \tabularnewline
41 & -0.002689 & -0.0201 & 0.492008 \tabularnewline
42 & 0.001026 & 0.0077 & 0.49695 \tabularnewline
43 & -0.024511 & -0.1834 & 0.427565 \tabularnewline
44 & -0.037961 & -0.2841 & 0.388701 \tabularnewline
45 & 0.004912 & 0.0368 & 0.485406 \tabularnewline
46 & 0.025093 & 0.1878 & 0.425863 \tabularnewline
47 & -0.004827 & -0.0361 & 0.485657 \tabularnewline
48 & -0.018067 & -0.1352 & 0.446469 \tabularnewline
\hline
\end{tabular}
%Source: https://freestatistics.org/blog/index.php?pk=106538&T=1

[TABLE]
[ROW][C]Autocorrelation Function[/C][/ROW]
[ROW][C]Time lag k[/C][C]ACF(k)[/C][C]T-STAT[/C][C]P-value[/C][/ROW]
[ROW][C]1[/C][C]0.249619[/C][C]1.868[/C][C]0.033501[/C][/ROW]
[ROW][C]2[/C][C]-0.046606[/C][C]-0.3488[/C][C]0.364287[/C][/ROW]
[ROW][C]3[/C][C]0.070947[/C][C]0.5309[/C][C]0.298788[/C][/ROW]
[ROW][C]4[/C][C]-0.057127[/C][C]-0.4275[/C][C]0.335328[/C][/ROW]
[ROW][C]5[/C][C]0.232731[/C][C]1.7416[/C][C]0.043535[/C][/ROW]
[ROW][C]6[/C][C]0.19759[/C][C]1.4786[/C][C]0.072422[/C][/ROW]
[ROW][C]7[/C][C]-0.265478[/C][C]-1.9867[/C][C]0.025931[/C][/ROW]
[ROW][C]8[/C][C]-0.188[/C][C]-1.4069[/C][C]0.082497[/C][/ROW]
[ROW][C]9[/C][C]-0.017749[/C][C]-0.1328[/C][C]0.447404[/C][/ROW]
[ROW][C]10[/C][C]-0.084779[/C][C]-0.6344[/C][C]0.264193[/C][/ROW]
[ROW][C]11[/C][C]0.040912[/C][C]0.3062[/C][C]0.380311[/C][/ROW]
[ROW][C]12[/C][C]-0.164468[/C][C]-1.2308[/C][C]0.111777[/C][/ROW]
[ROW][C]13[/C][C]-0.31584[/C][C]-2.3635[/C][C]0.010799[/C][/ROW]
[ROW][C]14[/C][C]-0.029003[/C][C]-0.217[/C][C]0.414484[/C][/ROW]
[ROW][C]15[/C][C]0.125287[/C][C]0.9376[/C][C]0.176248[/C][/ROW]
[ROW][C]16[/C][C]0.116057[/C][C]0.8685[/C][C]0.194415[/C][/ROW]
[ROW][C]17[/C][C]0.048147[/C][C]0.3603[/C][C]0.359989[/C][/ROW]
[ROW][C]18[/C][C]-0.103744[/C][C]-0.7763[/C][C]0.220405[/C][/ROW]
[ROW][C]19[/C][C]-0.019614[/C][C]-0.1468[/C][C]0.441918[/C][/ROW]
[ROW][C]20[/C][C]0.166995[/C][C]1.2497[/C][C]0.108308[/C][/ROW]
[ROW][C]21[/C][C]-0.025661[/C][C]-0.192[/C][C]0.424207[/C][/ROW]
[ROW][C]22[/C][C]-0.126029[/C][C]-0.9431[/C][C]0.174837[/C][/ROW]
[ROW][C]23[/C][C]-0.13441[/C][C]-1.0058[/C][C]0.159411[/C][/ROW]
[ROW][C]24[/C][C]-0.191542[/C][C]-1.4334[/C][C]0.078656[/C][/ROW]
[ROW][C]25[/C][C]0.032543[/C][C]0.2435[/C][C]0.404242[/C][/ROW]
[ROW][C]26[/C][C]0.010886[/C][C]0.0815[/C][C]0.467681[/C][/ROW]
[ROW][C]27[/C][C]-0.188532[/C][C]-1.4108[/C][C]0.081911[/C][/ROW]
[ROW][C]28[/C][C]-0.181261[/C][C]-1.3564[/C][C]0.090202[/C][/ROW]
[ROW][C]29[/C][C]-0.053334[/C][C]-0.3991[/C][C]0.345663[/C][/ROW]
[ROW][C]30[/C][C]0.044276[/C][C]0.3313[/C][C]0.370816[/C][/ROW]
[ROW][C]31[/C][C]0.092721[/C][C]0.6939[/C][C]0.24532[/C][/ROW]
[ROW][C]32[/C][C]0.013493[/C][C]0.101[/C][C]0.459966[/C][/ROW]
[ROW][C]33[/C][C]-0.06558[/C][C]-0.4908[/C][C]0.312759[/C][/ROW]
[ROW][C]34[/C][C]0.040554[/C][C]0.3035[/C][C]0.381326[/C][/ROW]
[ROW][C]35[/C][C]0.111307[/C][C]0.8329[/C][C]0.204208[/C][/ROW]
[ROW][C]36[/C][C]0.074159[/C][C]0.555[/C][C]0.290569[/C][/ROW]
[ROW][C]37[/C][C]0.084205[/C][C]0.6301[/C][C]0.265586[/C][/ROW]
[ROW][C]38[/C][C]0.02626[/C][C]0.1965[/C][C]0.42246[/C][/ROW]
[ROW][C]39[/C][C]0.004284[/C][C]0.0321[/C][C]0.487271[/C][/ROW]
[ROW][C]40[/C][C]-0.010391[/C][C]-0.0778[/C][C]0.469147[/C][/ROW]
[ROW][C]41[/C][C]-0.002689[/C][C]-0.0201[/C][C]0.492008[/C][/ROW]
[ROW][C]42[/C][C]0.001026[/C][C]0.0077[/C][C]0.49695[/C][/ROW]
[ROW][C]43[/C][C]-0.024511[/C][C]-0.1834[/C][C]0.427565[/C][/ROW]
[ROW][C]44[/C][C]-0.037961[/C][C]-0.2841[/C][C]0.388701[/C][/ROW]
[ROW][C]45[/C][C]0.004912[/C][C]0.0368[/C][C]0.485406[/C][/ROW]
[ROW][C]46[/C][C]0.025093[/C][C]0.1878[/C][C]0.425863[/C][/ROW]
[ROW][C]47[/C][C]-0.004827[/C][C]-0.0361[/C][C]0.485657[/C][/ROW]
[ROW][C]48[/C][C]-0.018067[/C][C]-0.1352[/C][C]0.446469[/C][/ROW]
[/TABLE]
Source: https://freestatistics.org/blog/index.php?pk=106538&T=1

Globally Unique Identifier (entire table): ba.freestatistics.org/blog/index.php?pk=106538&T=1

As an alternative you can also use a QR Code:  

The GUIDs for individual cells are displayed in the table below:

Autocorrelation Function
Time lag kACF(k)T-STATP-value
10.2496191.8680.033501
2-0.046606-0.34880.364287
30.0709470.53090.298788
4-0.057127-0.42750.335328
50.2327311.74160.043535
60.197591.47860.072422
7-0.265478-1.98670.025931
8-0.188-1.40690.082497
9-0.017749-0.13280.447404
10-0.084779-0.63440.264193
110.0409120.30620.380311
12-0.164468-1.23080.111777
13-0.31584-2.36350.010799
14-0.029003-0.2170.414484
150.1252870.93760.176248
160.1160570.86850.194415
170.0481470.36030.359989
18-0.103744-0.77630.220405
19-0.019614-0.14680.441918
200.1669951.24970.108308
21-0.025661-0.1920.424207
22-0.126029-0.94310.174837
23-0.13441-1.00580.159411
24-0.191542-1.43340.078656
250.0325430.24350.404242
260.0108860.08150.467681
27-0.188532-1.41080.081911
28-0.181261-1.35640.090202
29-0.053334-0.39910.345663
300.0442760.33130.370816
310.0927210.69390.24532
320.0134930.1010.459966
33-0.06558-0.49080.312759
340.0405540.30350.381326
350.1113070.83290.204208
360.0741590.5550.290569
370.0842050.63010.265586
380.026260.19650.42246
390.0042840.03210.487271
40-0.010391-0.07780.469147
41-0.002689-0.02010.492008
420.0010260.00770.49695
43-0.024511-0.18340.427565
44-0.037961-0.28410.388701
450.0049120.03680.485406
460.0250930.18780.425863
47-0.004827-0.03610.485657
48-0.018067-0.13520.446469


Partial Autocorrelation Function
Time lag kPACF(k)T-STATP-value
10.2496191.8680.033501
2-0.116153-0.86920.194222
30.1220760.91350.182438
4-0.126607-0.94740.173743
50.33612.51510.007398
6-0.008454-0.06330.474892
7-0.297066-2.2230.015133
8-0.076102-0.56950.285649
90.052570.39340.34776
10-0.108839-0.81450.209412
11-0.012882-0.09640.461773
12-0.144181-1.0790.142617
13-0.073557-0.55050.292099
14-0.001843-0.01380.494523
150.1441921.0790.142599
160.0862730.64560.260584
17-0.026135-0.19560.422825
18-0.013749-0.10290.459211
190.0377850.28280.389202
20-0.013096-0.0980.46114
21-0.245224-1.83510.035903
22-0.102076-0.76390.224076
23-0.060583-0.45340.32602
24-0.136018-1.01790.15656
250.0018840.01410.4944
26-0.040254-0.30120.382175
27-0.027804-0.20810.417966
28-0.097821-0.7320.233604
290.1234030.92350.179864
300.0514960.38540.350714
31-0.10058-0.75270.227399
320.0043590.03260.487047
330.0181920.13610.446101
34-0.096055-0.71880.237623
35-0.132798-0.99380.162305
36-0.064367-0.48170.315957
370.1097250.82110.207533
38-0.005629-0.04210.483276
390.0299260.22390.411807
40-0.114779-0.85890.197021
410.0100930.07550.470031
420.0273880.2050.419175
430.0227480.17020.432721
44-0.043862-0.32820.371981
45-0.054304-0.40640.343009
460.0146190.10940.456637
47-0.027417-0.20520.419092
48-0.11789-0.88220.190717

\begin{tabular}{lllllllll}
\hline
Partial Autocorrelation Function \tabularnewline
Time lag k & PACF(k) & T-STAT & P-value \tabularnewline
1 & 0.249619 & 1.868 & 0.033501 \tabularnewline
2 & -0.116153 & -0.8692 & 0.194222 \tabularnewline
3 & 0.122076 & 0.9135 & 0.182438 \tabularnewline
4 & -0.126607 & -0.9474 & 0.173743 \tabularnewline
5 & 0.3361 & 2.5151 & 0.007398 \tabularnewline
6 & -0.008454 & -0.0633 & 0.474892 \tabularnewline
7 & -0.297066 & -2.223 & 0.015133 \tabularnewline
8 & -0.076102 & -0.5695 & 0.285649 \tabularnewline
9 & 0.05257 & 0.3934 & 0.34776 \tabularnewline
10 & -0.108839 & -0.8145 & 0.209412 \tabularnewline
11 & -0.012882 & -0.0964 & 0.461773 \tabularnewline
12 & -0.144181 & -1.079 & 0.142617 \tabularnewline
13 & -0.073557 & -0.5505 & 0.292099 \tabularnewline
14 & -0.001843 & -0.0138 & 0.494523 \tabularnewline
15 & 0.144192 & 1.079 & 0.142599 \tabularnewline
16 & 0.086273 & 0.6456 & 0.260584 \tabularnewline
17 & -0.026135 & -0.1956 & 0.422825 \tabularnewline
18 & -0.013749 & -0.1029 & 0.459211 \tabularnewline
19 & 0.037785 & 0.2828 & 0.389202 \tabularnewline
20 & -0.013096 & -0.098 & 0.46114 \tabularnewline
21 & -0.245224 & -1.8351 & 0.035903 \tabularnewline
22 & -0.102076 & -0.7639 & 0.224076 \tabularnewline
23 & -0.060583 & -0.4534 & 0.32602 \tabularnewline
24 & -0.136018 & -1.0179 & 0.15656 \tabularnewline
25 & 0.001884 & 0.0141 & 0.4944 \tabularnewline
26 & -0.040254 & -0.3012 & 0.382175 \tabularnewline
27 & -0.027804 & -0.2081 & 0.417966 \tabularnewline
28 & -0.097821 & -0.732 & 0.233604 \tabularnewline
29 & 0.123403 & 0.9235 & 0.179864 \tabularnewline
30 & 0.051496 & 0.3854 & 0.350714 \tabularnewline
31 & -0.10058 & -0.7527 & 0.227399 \tabularnewline
32 & 0.004359 & 0.0326 & 0.487047 \tabularnewline
33 & 0.018192 & 0.1361 & 0.446101 \tabularnewline
34 & -0.096055 & -0.7188 & 0.237623 \tabularnewline
35 & -0.132798 & -0.9938 & 0.162305 \tabularnewline
36 & -0.064367 & -0.4817 & 0.315957 \tabularnewline
37 & 0.109725 & 0.8211 & 0.207533 \tabularnewline
38 & -0.005629 & -0.0421 & 0.483276 \tabularnewline
39 & 0.029926 & 0.2239 & 0.411807 \tabularnewline
40 & -0.114779 & -0.8589 & 0.197021 \tabularnewline
41 & 0.010093 & 0.0755 & 0.470031 \tabularnewline
42 & 0.027388 & 0.205 & 0.419175 \tabularnewline
43 & 0.022748 & 0.1702 & 0.432721 \tabularnewline
44 & -0.043862 & -0.3282 & 0.371981 \tabularnewline
45 & -0.054304 & -0.4064 & 0.343009 \tabularnewline
46 & 0.014619 & 0.1094 & 0.456637 \tabularnewline
47 & -0.027417 & -0.2052 & 0.419092 \tabularnewline
48 & -0.11789 & -0.8822 & 0.190717 \tabularnewline
\hline
\end{tabular}
%Source: https://freestatistics.org/blog/index.php?pk=106538&T=2

[TABLE]
[ROW][C]Partial Autocorrelation Function[/C][/ROW]
[ROW][C]Time lag k[/C][C]PACF(k)[/C][C]T-STAT[/C][C]P-value[/C][/ROW]
[ROW][C]1[/C][C]0.249619[/C][C]1.868[/C][C]0.033501[/C][/ROW]
[ROW][C]2[/C][C]-0.116153[/C][C]-0.8692[/C][C]0.194222[/C][/ROW]
[ROW][C]3[/C][C]0.122076[/C][C]0.9135[/C][C]0.182438[/C][/ROW]
[ROW][C]4[/C][C]-0.126607[/C][C]-0.9474[/C][C]0.173743[/C][/ROW]
[ROW][C]5[/C][C]0.3361[/C][C]2.5151[/C][C]0.007398[/C][/ROW]
[ROW][C]6[/C][C]-0.008454[/C][C]-0.0633[/C][C]0.474892[/C][/ROW]
[ROW][C]7[/C][C]-0.297066[/C][C]-2.223[/C][C]0.015133[/C][/ROW]
[ROW][C]8[/C][C]-0.076102[/C][C]-0.5695[/C][C]0.285649[/C][/ROW]
[ROW][C]9[/C][C]0.05257[/C][C]0.3934[/C][C]0.34776[/C][/ROW]
[ROW][C]10[/C][C]-0.108839[/C][C]-0.8145[/C][C]0.209412[/C][/ROW]
[ROW][C]11[/C][C]-0.012882[/C][C]-0.0964[/C][C]0.461773[/C][/ROW]
[ROW][C]12[/C][C]-0.144181[/C][C]-1.079[/C][C]0.142617[/C][/ROW]
[ROW][C]13[/C][C]-0.073557[/C][C]-0.5505[/C][C]0.292099[/C][/ROW]
[ROW][C]14[/C][C]-0.001843[/C][C]-0.0138[/C][C]0.494523[/C][/ROW]
[ROW][C]15[/C][C]0.144192[/C][C]1.079[/C][C]0.142599[/C][/ROW]
[ROW][C]16[/C][C]0.086273[/C][C]0.6456[/C][C]0.260584[/C][/ROW]
[ROW][C]17[/C][C]-0.026135[/C][C]-0.1956[/C][C]0.422825[/C][/ROW]
[ROW][C]18[/C][C]-0.013749[/C][C]-0.1029[/C][C]0.459211[/C][/ROW]
[ROW][C]19[/C][C]0.037785[/C][C]0.2828[/C][C]0.389202[/C][/ROW]
[ROW][C]20[/C][C]-0.013096[/C][C]-0.098[/C][C]0.46114[/C][/ROW]
[ROW][C]21[/C][C]-0.245224[/C][C]-1.8351[/C][C]0.035903[/C][/ROW]
[ROW][C]22[/C][C]-0.102076[/C][C]-0.7639[/C][C]0.224076[/C][/ROW]
[ROW][C]23[/C][C]-0.060583[/C][C]-0.4534[/C][C]0.32602[/C][/ROW]
[ROW][C]24[/C][C]-0.136018[/C][C]-1.0179[/C][C]0.15656[/C][/ROW]
[ROW][C]25[/C][C]0.001884[/C][C]0.0141[/C][C]0.4944[/C][/ROW]
[ROW][C]26[/C][C]-0.040254[/C][C]-0.3012[/C][C]0.382175[/C][/ROW]
[ROW][C]27[/C][C]-0.027804[/C][C]-0.2081[/C][C]0.417966[/C][/ROW]
[ROW][C]28[/C][C]-0.097821[/C][C]-0.732[/C][C]0.233604[/C][/ROW]
[ROW][C]29[/C][C]0.123403[/C][C]0.9235[/C][C]0.179864[/C][/ROW]
[ROW][C]30[/C][C]0.051496[/C][C]0.3854[/C][C]0.350714[/C][/ROW]
[ROW][C]31[/C][C]-0.10058[/C][C]-0.7527[/C][C]0.227399[/C][/ROW]
[ROW][C]32[/C][C]0.004359[/C][C]0.0326[/C][C]0.487047[/C][/ROW]
[ROW][C]33[/C][C]0.018192[/C][C]0.1361[/C][C]0.446101[/C][/ROW]
[ROW][C]34[/C][C]-0.096055[/C][C]-0.7188[/C][C]0.237623[/C][/ROW]
[ROW][C]35[/C][C]-0.132798[/C][C]-0.9938[/C][C]0.162305[/C][/ROW]
[ROW][C]36[/C][C]-0.064367[/C][C]-0.4817[/C][C]0.315957[/C][/ROW]
[ROW][C]37[/C][C]0.109725[/C][C]0.8211[/C][C]0.207533[/C][/ROW]
[ROW][C]38[/C][C]-0.005629[/C][C]-0.0421[/C][C]0.483276[/C][/ROW]
[ROW][C]39[/C][C]0.029926[/C][C]0.2239[/C][C]0.411807[/C][/ROW]
[ROW][C]40[/C][C]-0.114779[/C][C]-0.8589[/C][C]0.197021[/C][/ROW]
[ROW][C]41[/C][C]0.010093[/C][C]0.0755[/C][C]0.470031[/C][/ROW]
[ROW][C]42[/C][C]0.027388[/C][C]0.205[/C][C]0.419175[/C][/ROW]
[ROW][C]43[/C][C]0.022748[/C][C]0.1702[/C][C]0.432721[/C][/ROW]
[ROW][C]44[/C][C]-0.043862[/C][C]-0.3282[/C][C]0.371981[/C][/ROW]
[ROW][C]45[/C][C]-0.054304[/C][C]-0.4064[/C][C]0.343009[/C][/ROW]
[ROW][C]46[/C][C]0.014619[/C][C]0.1094[/C][C]0.456637[/C][/ROW]
[ROW][C]47[/C][C]-0.027417[/C][C]-0.2052[/C][C]0.419092[/C][/ROW]
[ROW][C]48[/C][C]-0.11789[/C][C]-0.8822[/C][C]0.190717[/C][/ROW]
[/TABLE]
Source: https://freestatistics.org/blog/index.php?pk=106538&T=2

Globally Unique Identifier (entire table): ba.freestatistics.org/blog/index.php?pk=106538&T=2

As an alternative you can also use a QR Code:  

The GUIDs for individual cells are displayed in the table below:

Partial Autocorrelation Function
Time lag kPACF(k)T-STATP-value
10.2496191.8680.033501
2-0.116153-0.86920.194222
30.1220760.91350.182438
4-0.126607-0.94740.173743
50.33612.51510.007398
6-0.008454-0.06330.474892
7-0.297066-2.2230.015133
8-0.076102-0.56950.285649
90.052570.39340.34776
10-0.108839-0.81450.209412
11-0.012882-0.09640.461773
12-0.144181-1.0790.142617
13-0.073557-0.55050.292099
14-0.001843-0.01380.494523
150.1441921.0790.142599
160.0862730.64560.260584
17-0.026135-0.19560.422825
18-0.013749-0.10290.459211
190.0377850.28280.389202
20-0.013096-0.0980.46114
21-0.245224-1.83510.035903
22-0.102076-0.76390.224076
23-0.060583-0.45340.32602
24-0.136018-1.01790.15656
250.0018840.01410.4944
26-0.040254-0.30120.382175
27-0.027804-0.20810.417966
28-0.097821-0.7320.233604
290.1234030.92350.179864
300.0514960.38540.350714
31-0.10058-0.75270.227399
320.0043590.03260.487047
330.0181920.13610.446101
34-0.096055-0.71880.237623
35-0.132798-0.99380.162305
36-0.064367-0.48170.315957
370.1097250.82110.207533
38-0.005629-0.04210.483276
390.0299260.22390.411807
40-0.114779-0.85890.197021
410.0100930.07550.470031
420.0273880.2050.419175
430.0227480.17020.432721
44-0.043862-0.32820.371981
45-0.054304-0.40640.343009
460.0146190.10940.456637
47-0.027417-0.20520.419092
48-0.11789-0.88220.190717


Parameters (Session):
par1 = 48 ; par2 = 1 ; par3 = 1 ; par4 = 0 ; par5 = 12 ; par6 = White Noise ; par7 = 0.95 ;
Parameters (R input):
par1 = 48 ; par2 = 1 ; par3 = 1 ; par4 = 0 ; par5 = 12 ; par6 = White Noise ; par7 = 0.95 ;
R code (references can be found in the software module):
if (par1 == 'Default') {
par1 = 10*log10(length(x))
} else {
par1 <- as.numeric(par1)
}
par2 <- as.numeric(par2)
par3 <- as.numeric(par3)
par4 <- as.numeric(par4)
par5 <- as.numeric(par5)
if (par6 == 'White Noise') par6 <- 'white' else par6 <- 'ma'
par7 <- as.numeric(par7)
if (par2 == 0) {
x <- log(x)
} else {
x <- (x ^ par2 - 1) / par2
}
if (par3 > 0) x <- diff(x,lag=1,difference=par3)
if (par4 > 0) x <- diff(x,lag=par5,difference=par4)
bitmap(file='pic1.png')
racf <- acf(x, par1, main='Autocorrelation', xlab='time lag', ylab='ACF', ci.type=par6, ci=par7, sub=paste('(lambda=',par2,', d=',par3,', D=',par4,', CI=', par7, ', CI type=',par6,')',sep=''))
dev.off()
bitmap(file='pic2.png')
rpacf <- pacf(x,par1,main='Partial Autocorrelation',xlab='lags',ylab='PACF')
dev.off()
(myacf <- c(racf$acf))
(mypacf <- c(rpacf$acf))
lengthx <- length(x)
sqrtn <- sqrt(lengthx)
load(file='createtable')
a<-table.start()
a<-table.row.start(a)
a<-table.element(a,'Autocorrelation Function',4,TRUE)
a<-table.row.end(a)
a<-table.row.start(a)
a<-table.element(a,'Time lag k',header=TRUE)
a<-table.element(a,hyperlink('basics.htm','ACF(k)','click here for more information about the Autocorrelation Function'),header=TRUE)
a<-table.element(a,'T-STAT',header=TRUE)
a<-table.element(a,'P-value',header=TRUE)
a<-table.row.end(a)
for (i in 2:(par1+1)) {
a<-table.row.start(a)
a<-table.element(a,i-1,header=TRUE)
a<-table.element(a,round(myacf[i],6))
mytstat <- myacf[i]*sqrtn
a<-table.element(a,round(mytstat,4))
a<-table.element(a,round(1-pt(abs(mytstat),lengthx),6))
a<-table.row.end(a)
}
a<-table.end(a)
table.save(a,file='mytable.tab')
a<-table.start()
a<-table.row.start(a)
a<-table.element(a,'Partial Autocorrelation Function',4,TRUE)
a<-table.row.end(a)
a<-table.row.start(a)
a<-table.element(a,'Time lag k',header=TRUE)
a<-table.element(a,hyperlink('basics.htm','PACF(k)','click here for more information about the Partial Autocorrelation Function'),header=TRUE)
a<-table.element(a,'T-STAT',header=TRUE)
a<-table.element(a,'P-value',header=TRUE)
a<-table.row.end(a)
for (i in 1:par1) {
a<-table.row.start(a)
a<-table.element(a,i,header=TRUE)
a<-table.element(a,round(mypacf[i],6))
mytstat <- mypacf[i]*sqrtn
a<-table.element(a,round(mytstat,4))
a<-table.element(a,round(1-pt(abs(mytstat),lengthx),6))
a<-table.row.end(a)
}
a<-table.end(a)
table.save(a,file='mytable1.tab')