Free Statistics

of Irreproducible Research!

Author's title

Author*The author of this computation has been verified*
R Software Modulerwasp_arimaforecasting.wasp
Title produced by softwareARIMA Forecasting
Date of computationTue, 07 Dec 2010 16:30:17 +0000
Cite this page as followsStatistical Computations at FreeStatistics.org, Office for Research Development and Education, URL https://freestatistics.org/blog/index.php?v=date/2010/Dec/07/t12917393158shh14tducow8vg.htm/, Retrieved Sat, 04 May 2024 04:05:31 +0000
Statistical Computations at FreeStatistics.org, Office for Research Development and Education, URL https://freestatistics.org/blog/index.php?pk=106491, Retrieved Sat, 04 May 2024 04:05:31 +0000
QR Codes:

Original text written by user:
IsPrivate?No (this computation is public)
User-defined keywords
Estimated Impact118
Family? (F = Feedback message, R = changed R code, M = changed R Module, P = changed Parameters, D = changed Data)
-     [ARIMA Forecasting] [WS9 fout] [2010-12-03 12:26:23] [1fd136673b2a4fecb5c545b9b4a05d64]
- R P   [ARIMA Forecasting] [] [2010-12-03 14:12:57] [b98453cac15ba1066b407e146608df68]
-   PD      [ARIMA Forecasting] [Arima forecast 1] [2010-12-07 16:30:17] [278a0539dc236556c5f30b5bc56ff9eb] [Current]
-   P         [ARIMA Forecasting] [Forecast ARIMA 1] [2010-12-07 22:26:44] [b8e188bcc949964bed729335b3416734]
-   PD          [ARIMA Forecasting] [ARIMA voorspellen...] [2010-12-20 00:03:32] [b8e188bcc949964bed729335b3416734]
Feedback Forum

Post a new message
Dataseries X:
300
302
400
392
373
379
303
324
353
392
327
376
329
359
413
338
422
390
370
367
406
418
346
350
330
318
382
337
372
422
428
426
396
458
315
337
386
352
383
439
397
453
363
365
474
373
403
384
364
361
419
352
363
410
361
383
342
369
361
317
386
318
407
393
404
498
438


Summary of computational transaction
Raw Inputview raw input (R code)
Raw Outputview raw output of R engine
Computing time1 seconds
R Server'RServer@AstonUniversity' @ vre.aston.ac.uk

\begin{tabular}{lllllllll}
\hline
Summary of computational transaction \tabularnewline
Raw Input & view raw input (R code)  \tabularnewline
Raw Output & view raw output of R engine  \tabularnewline
Computing time & 1 seconds \tabularnewline
R Server & 'RServer@AstonUniversity' @ vre.aston.ac.uk \tabularnewline
\hline
\end{tabular}
%Source: https://freestatistics.org/blog/index.php?pk=106491&T=0

[TABLE]
[ROW][C]Summary of computational transaction[/C][/ROW]
[ROW][C]Raw Input[/C][C]view raw input (R code) [/C][/ROW]
[ROW][C]Raw Output[/C][C]view raw output of R engine [/C][/ROW]
[ROW][C]Computing time[/C][C]1 seconds[/C][/ROW]
[ROW][C]R Server[/C][C]'RServer@AstonUniversity' @ vre.aston.ac.uk[/C][/ROW]
[/TABLE]
Source: https://freestatistics.org/blog/index.php?pk=106491&T=0

Globally Unique Identifier (entire table): ba.freestatistics.org/blog/index.php?pk=106491&T=0

As an alternative you can also use a QR Code:  

The GUIDs for individual cells are displayed in the table below:

Summary of computational transaction
Raw Inputview raw input (R code)
Raw Outputview raw output of R engine
Computing time1 seconds
R Server'RServer@AstonUniversity' @ vre.aston.ac.uk


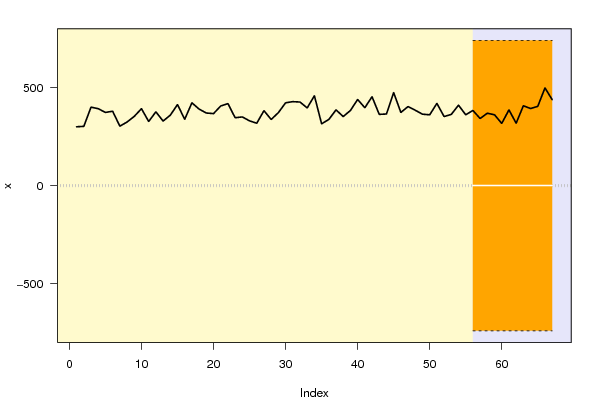
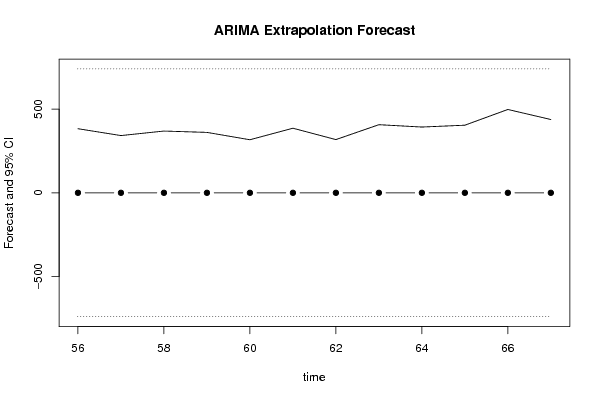
Univariate ARIMA Extrapolation Forecast
timeY[t]F[t]95% LB95% UBp-value(H0: Y[t] = F[t])P(F[t]>Y[t-1])P(F[t]>Y[t-s])P(F[t]>Y[55])
43363-------
44365-------
45474-------
46373-------
47403-------
48384-------
49364-------
50361-------
51419-------
52352-------
53363-------
54410-------
55361-------
563830-740.1324740.13240.15520.16950.16690.1695
573420-740.1324740.13240.18260.15520.10470.1695
583690-740.1324740.13240.16420.18260.16160.1695
593610-740.1324740.13240.16950.16420.14290.1695
603170-740.1324740.13240.20060.16950.15460.1695
613860-740.1324740.13240.15330.20060.16750.1695
623180-740.1324740.13240.19990.15330.16950.1695
634070-740.1324740.13240.14060.19990.13360.1695
643930-740.1324740.13240.1490.14060.17560.1695
654040-740.1324740.13240.14230.1490.16820.1695
664980-740.1324740.13240.09360.14230.13880.1695
674380-740.1324740.13240.1230.09360.16950.1695

\begin{tabular}{lllllllll}
\hline
Univariate ARIMA Extrapolation Forecast \tabularnewline
time & Y[t] & F[t] & 95% LB & 95% UB & p-value(H0: Y[t] = F[t]) & P(F[t]>Y[t-1]) & P(F[t]>Y[t-s]) & P(F[t]>Y[55]) \tabularnewline
43 & 363 & - & - & - & - & - & - & - \tabularnewline
44 & 365 & - & - & - & - & - & - & - \tabularnewline
45 & 474 & - & - & - & - & - & - & - \tabularnewline
46 & 373 & - & - & - & - & - & - & - \tabularnewline
47 & 403 & - & - & - & - & - & - & - \tabularnewline
48 & 384 & - & - & - & - & - & - & - \tabularnewline
49 & 364 & - & - & - & - & - & - & - \tabularnewline
50 & 361 & - & - & - & - & - & - & - \tabularnewline
51 & 419 & - & - & - & - & - & - & - \tabularnewline
52 & 352 & - & - & - & - & - & - & - \tabularnewline
53 & 363 & - & - & - & - & - & - & - \tabularnewline
54 & 410 & - & - & - & - & - & - & - \tabularnewline
55 & 361 & - & - & - & - & - & - & - \tabularnewline
56 & 383 & 0 & -740.1324 & 740.1324 & 0.1552 & 0.1695 & 0.1669 & 0.1695 \tabularnewline
57 & 342 & 0 & -740.1324 & 740.1324 & 0.1826 & 0.1552 & 0.1047 & 0.1695 \tabularnewline
58 & 369 & 0 & -740.1324 & 740.1324 & 0.1642 & 0.1826 & 0.1616 & 0.1695 \tabularnewline
59 & 361 & 0 & -740.1324 & 740.1324 & 0.1695 & 0.1642 & 0.1429 & 0.1695 \tabularnewline
60 & 317 & 0 & -740.1324 & 740.1324 & 0.2006 & 0.1695 & 0.1546 & 0.1695 \tabularnewline
61 & 386 & 0 & -740.1324 & 740.1324 & 0.1533 & 0.2006 & 0.1675 & 0.1695 \tabularnewline
62 & 318 & 0 & -740.1324 & 740.1324 & 0.1999 & 0.1533 & 0.1695 & 0.1695 \tabularnewline
63 & 407 & 0 & -740.1324 & 740.1324 & 0.1406 & 0.1999 & 0.1336 & 0.1695 \tabularnewline
64 & 393 & 0 & -740.1324 & 740.1324 & 0.149 & 0.1406 & 0.1756 & 0.1695 \tabularnewline
65 & 404 & 0 & -740.1324 & 740.1324 & 0.1423 & 0.149 & 0.1682 & 0.1695 \tabularnewline
66 & 498 & 0 & -740.1324 & 740.1324 & 0.0936 & 0.1423 & 0.1388 & 0.1695 \tabularnewline
67 & 438 & 0 & -740.1324 & 740.1324 & 0.123 & 0.0936 & 0.1695 & 0.1695 \tabularnewline
\hline
\end{tabular}
%Source: https://freestatistics.org/blog/index.php?pk=106491&T=1

[TABLE]
[ROW][C]Univariate ARIMA Extrapolation Forecast[/C][/ROW]
[ROW][C]time[/C][C]Y[t][/C][C]F[t][/C][C]95% LB[/C][C]95% UB[/C][C]p-value(H0: Y[t] = F[t])[/C][C]P(F[t]>Y[t-1])[/C][C]P(F[t]>Y[t-s])[/C][C]P(F[t]>Y[55])[/C][/ROW]
[ROW][C]43[/C][C]363[/C][C]-[/C][C]-[/C][C]-[/C][C]-[/C][C]-[/C][C]-[/C][C]-[/C][/ROW]
[ROW][C]44[/C][C]365[/C][C]-[/C][C]-[/C][C]-[/C][C]-[/C][C]-[/C][C]-[/C][C]-[/C][/ROW]
[ROW][C]45[/C][C]474[/C][C]-[/C][C]-[/C][C]-[/C][C]-[/C][C]-[/C][C]-[/C][C]-[/C][/ROW]
[ROW][C]46[/C][C]373[/C][C]-[/C][C]-[/C][C]-[/C][C]-[/C][C]-[/C][C]-[/C][C]-[/C][/ROW]
[ROW][C]47[/C][C]403[/C][C]-[/C][C]-[/C][C]-[/C][C]-[/C][C]-[/C][C]-[/C][C]-[/C][/ROW]
[ROW][C]48[/C][C]384[/C][C]-[/C][C]-[/C][C]-[/C][C]-[/C][C]-[/C][C]-[/C][C]-[/C][/ROW]
[ROW][C]49[/C][C]364[/C][C]-[/C][C]-[/C][C]-[/C][C]-[/C][C]-[/C][C]-[/C][C]-[/C][/ROW]
[ROW][C]50[/C][C]361[/C][C]-[/C][C]-[/C][C]-[/C][C]-[/C][C]-[/C][C]-[/C][C]-[/C][/ROW]
[ROW][C]51[/C][C]419[/C][C]-[/C][C]-[/C][C]-[/C][C]-[/C][C]-[/C][C]-[/C][C]-[/C][/ROW]
[ROW][C]52[/C][C]352[/C][C]-[/C][C]-[/C][C]-[/C][C]-[/C][C]-[/C][C]-[/C][C]-[/C][/ROW]
[ROW][C]53[/C][C]363[/C][C]-[/C][C]-[/C][C]-[/C][C]-[/C][C]-[/C][C]-[/C][C]-[/C][/ROW]
[ROW][C]54[/C][C]410[/C][C]-[/C][C]-[/C][C]-[/C][C]-[/C][C]-[/C][C]-[/C][C]-[/C][/ROW]
[ROW][C]55[/C][C]361[/C][C]-[/C][C]-[/C][C]-[/C][C]-[/C][C]-[/C][C]-[/C][C]-[/C][/ROW]
[ROW][C]56[/C][C]383[/C][C]0[/C][C]-740.1324[/C][C]740.1324[/C][C]0.1552[/C][C]0.1695[/C][C]0.1669[/C][C]0.1695[/C][/ROW]
[ROW][C]57[/C][C]342[/C][C]0[/C][C]-740.1324[/C][C]740.1324[/C][C]0.1826[/C][C]0.1552[/C][C]0.1047[/C][C]0.1695[/C][/ROW]
[ROW][C]58[/C][C]369[/C][C]0[/C][C]-740.1324[/C][C]740.1324[/C][C]0.1642[/C][C]0.1826[/C][C]0.1616[/C][C]0.1695[/C][/ROW]
[ROW][C]59[/C][C]361[/C][C]0[/C][C]-740.1324[/C][C]740.1324[/C][C]0.1695[/C][C]0.1642[/C][C]0.1429[/C][C]0.1695[/C][/ROW]
[ROW][C]60[/C][C]317[/C][C]0[/C][C]-740.1324[/C][C]740.1324[/C][C]0.2006[/C][C]0.1695[/C][C]0.1546[/C][C]0.1695[/C][/ROW]
[ROW][C]61[/C][C]386[/C][C]0[/C][C]-740.1324[/C][C]740.1324[/C][C]0.1533[/C][C]0.2006[/C][C]0.1675[/C][C]0.1695[/C][/ROW]
[ROW][C]62[/C][C]318[/C][C]0[/C][C]-740.1324[/C][C]740.1324[/C][C]0.1999[/C][C]0.1533[/C][C]0.1695[/C][C]0.1695[/C][/ROW]
[ROW][C]63[/C][C]407[/C][C]0[/C][C]-740.1324[/C][C]740.1324[/C][C]0.1406[/C][C]0.1999[/C][C]0.1336[/C][C]0.1695[/C][/ROW]
[ROW][C]64[/C][C]393[/C][C]0[/C][C]-740.1324[/C][C]740.1324[/C][C]0.149[/C][C]0.1406[/C][C]0.1756[/C][C]0.1695[/C][/ROW]
[ROW][C]65[/C][C]404[/C][C]0[/C][C]-740.1324[/C][C]740.1324[/C][C]0.1423[/C][C]0.149[/C][C]0.1682[/C][C]0.1695[/C][/ROW]
[ROW][C]66[/C][C]498[/C][C]0[/C][C]-740.1324[/C][C]740.1324[/C][C]0.0936[/C][C]0.1423[/C][C]0.1388[/C][C]0.1695[/C][/ROW]
[ROW][C]67[/C][C]438[/C][C]0[/C][C]-740.1324[/C][C]740.1324[/C][C]0.123[/C][C]0.0936[/C][C]0.1695[/C][C]0.1695[/C][/ROW]
[/TABLE]
Source: https://freestatistics.org/blog/index.php?pk=106491&T=1

Globally Unique Identifier (entire table): ba.freestatistics.org/blog/index.php?pk=106491&T=1

As an alternative you can also use a QR Code:  

The GUIDs for individual cells are displayed in the table below:

Univariate ARIMA Extrapolation Forecast
timeY[t]F[t]95% LB95% UBp-value(H0: Y[t] = F[t])P(F[t]>Y[t-1])P(F[t]>Y[t-s])P(F[t]>Y[55])
43363-------
44365-------
45474-------
46373-------
47403-------
48384-------
49364-------
50361-------
51419-------
52352-------
53363-------
54410-------
55361-------
563830-740.1324740.13240.15520.16950.16690.1695
573420-740.1324740.13240.18260.15520.10470.1695
583690-740.1324740.13240.16420.18260.16160.1695
593610-740.1324740.13240.16950.16420.14290.1695
603170-740.1324740.13240.20060.16950.15460.1695
613860-740.1324740.13240.15330.20060.16750.1695
623180-740.1324740.13240.19990.15330.16950.1695
634070-740.1324740.13240.14060.19990.13360.1695
643930-740.1324740.13240.1490.14060.17560.1695
654040-740.1324740.13240.14230.1490.16820.1695
664980-740.1324740.13240.09360.14230.13880.1695
674380-740.1324740.13240.1230.09360.16950.1695


Univariate ARIMA Extrapolation Forecast Performance
time% S.E.PEMAPESq.EMSERMSE
56InfInf014668900
57InfInfInf116964131826.5363.0792
58InfInfInf136161133271.3333365.0635
59InfInfInf130321132533.75364.0519
60InfInfInf100489126124.8355.1405
61InfInfInf148996129936.6667360.4673
62InfInfInf101124125820.5714354.712
63InfInfInf165649130799.125361.6616
64InfInfInf154449133426.8889365.2765
65InfInfInf163216136405.8369.3316
66InfInfInf248004146551.0909382.8199
67InfInfInf191844150325.5387.7183

\begin{tabular}{lllllllll}
\hline
Univariate ARIMA Extrapolation Forecast Performance \tabularnewline
time & % S.E. & PE & MAPE & Sq.E & MSE & RMSE \tabularnewline
56 & Inf & Inf & 0 & 146689 & 0 & 0 \tabularnewline
57 & Inf & Inf & Inf & 116964 & 131826.5 & 363.0792 \tabularnewline
58 & Inf & Inf & Inf & 136161 & 133271.3333 & 365.0635 \tabularnewline
59 & Inf & Inf & Inf & 130321 & 132533.75 & 364.0519 \tabularnewline
60 & Inf & Inf & Inf & 100489 & 126124.8 & 355.1405 \tabularnewline
61 & Inf & Inf & Inf & 148996 & 129936.6667 & 360.4673 \tabularnewline
62 & Inf & Inf & Inf & 101124 & 125820.5714 & 354.712 \tabularnewline
63 & Inf & Inf & Inf & 165649 & 130799.125 & 361.6616 \tabularnewline
64 & Inf & Inf & Inf & 154449 & 133426.8889 & 365.2765 \tabularnewline
65 & Inf & Inf & Inf & 163216 & 136405.8 & 369.3316 \tabularnewline
66 & Inf & Inf & Inf & 248004 & 146551.0909 & 382.8199 \tabularnewline
67 & Inf & Inf & Inf & 191844 & 150325.5 & 387.7183 \tabularnewline
\hline
\end{tabular}
%Source: https://freestatistics.org/blog/index.php?pk=106491&T=2

[TABLE]
[ROW][C]Univariate ARIMA Extrapolation Forecast Performance[/C][/ROW]
[ROW][C]time[/C][C]% S.E.[/C][C]PE[/C][C]MAPE[/C][C]Sq.E[/C][C]MSE[/C][C]RMSE[/C][/ROW]
[ROW][C]56[/C][C]Inf[/C][C]Inf[/C][C]0[/C][C]146689[/C][C]0[/C][C]0[/C][/ROW]
[ROW][C]57[/C][C]Inf[/C][C]Inf[/C][C]Inf[/C][C]116964[/C][C]131826.5[/C][C]363.0792[/C][/ROW]
[ROW][C]58[/C][C]Inf[/C][C]Inf[/C][C]Inf[/C][C]136161[/C][C]133271.3333[/C][C]365.0635[/C][/ROW]
[ROW][C]59[/C][C]Inf[/C][C]Inf[/C][C]Inf[/C][C]130321[/C][C]132533.75[/C][C]364.0519[/C][/ROW]
[ROW][C]60[/C][C]Inf[/C][C]Inf[/C][C]Inf[/C][C]100489[/C][C]126124.8[/C][C]355.1405[/C][/ROW]
[ROW][C]61[/C][C]Inf[/C][C]Inf[/C][C]Inf[/C][C]148996[/C][C]129936.6667[/C][C]360.4673[/C][/ROW]
[ROW][C]62[/C][C]Inf[/C][C]Inf[/C][C]Inf[/C][C]101124[/C][C]125820.5714[/C][C]354.712[/C][/ROW]
[ROW][C]63[/C][C]Inf[/C][C]Inf[/C][C]Inf[/C][C]165649[/C][C]130799.125[/C][C]361.6616[/C][/ROW]
[ROW][C]64[/C][C]Inf[/C][C]Inf[/C][C]Inf[/C][C]154449[/C][C]133426.8889[/C][C]365.2765[/C][/ROW]
[ROW][C]65[/C][C]Inf[/C][C]Inf[/C][C]Inf[/C][C]163216[/C][C]136405.8[/C][C]369.3316[/C][/ROW]
[ROW][C]66[/C][C]Inf[/C][C]Inf[/C][C]Inf[/C][C]248004[/C][C]146551.0909[/C][C]382.8199[/C][/ROW]
[ROW][C]67[/C][C]Inf[/C][C]Inf[/C][C]Inf[/C][C]191844[/C][C]150325.5[/C][C]387.7183[/C][/ROW]
[/TABLE]
Source: https://freestatistics.org/blog/index.php?pk=106491&T=2

Globally Unique Identifier (entire table): ba.freestatistics.org/blog/index.php?pk=106491&T=2

As an alternative you can also use a QR Code:  

The GUIDs for individual cells are displayed in the table below:

Univariate ARIMA Extrapolation Forecast Performance
time% S.E.PEMAPESq.EMSERMSE
56InfInf014668900
57InfInfInf116964131826.5363.0792
58InfInfInf136161133271.3333365.0635
59InfInfInf130321132533.75364.0519
60InfInfInf100489126124.8355.1405
61InfInfInf148996129936.6667360.4673
62InfInfInf101124125820.5714354.712
63InfInfInf165649130799.125361.6616
64InfInfInf154449133426.8889365.2765
65InfInfInf163216136405.8369.3316
66InfInfInf248004146551.0909382.8199
67InfInfInf191844150325.5387.7183


Parameters (Session):
par1 = 12 ; par2 = 1 ; par3 = 0 ; par4 = 0 ; par5 = 12 ; par6 = 0 ; par7 = 0 ; par8 = 0 ; par9 = 0 ; par10 = FALSE ;
Parameters (R input):
par1 = 12 ; par2 = 1 ; par3 = 0 ; par4 = 0 ; par5 = 12 ; par6 = 0 ; par7 = 0 ; par8 = 0 ; par9 = 0 ; par10 = FALSE ;
R code (references can be found in the software module):
par1 <- as.numeric(par1) #cut off periods
par2 <- as.numeric(par2) #lambda
par3 <- as.numeric(par3) #degree of non-seasonal differencing
par4 <- as.numeric(par4) #degree of seasonal differencing
par5 <- as.numeric(par5) #seasonal period
par6 <- as.numeric(par6) #p
par7 <- as.numeric(par7) #q
par8 <- as.numeric(par8) #P
par9 <- as.numeric(par9) #Q
if (par10 == 'TRUE') par10 <- TRUE
if (par10 == 'FALSE') par10 <- FALSE
if (par2 == 0) x <- log(x)
if (par2 != 0) x <- x^par2
lx <- length(x)
first <- lx - 2*par1
nx <- lx - par1
nx1 <- nx + 1
fx <- lx - nx
if (fx < 1) {
fx <- par5
nx1 <- lx + fx - 1
first <- lx - 2*fx
}
first <- 1
if (fx < 3) fx <- round(lx/10,0)
(arima.out <- arima(x[1:nx], order=c(par6,par3,par7), seasonal=list(order=c(par8,par4,par9), period=par5), include.mean=par10, method='ML'))
(forecast <- predict(arima.out,par1))
(lb <- forecast$pred - 1.96 * forecast$se)
(ub <- forecast$pred + 1.96 * forecast$se)
if (par2 == 0) {
x <- exp(x)
forecast$pred <- exp(forecast$pred)
lb <- exp(lb)
ub <- exp(ub)
}
if (par2 != 0) {
x <- x^(1/par2)
forecast$pred <- forecast$pred^(1/par2)
lb <- lb^(1/par2)
ub <- ub^(1/par2)
}
if (par2 < 0) {
olb <- lb
lb <- ub
ub <- olb
}
(actandfor <- c(x[1:nx], forecast$pred))
(perc.se <- (ub-forecast$pred)/1.96/forecast$pred)
bitmap(file='test1.png')
opar <- par(mar=c(4,4,2,2),las=1)
ylim <- c( min(x[first:nx],lb), max(x[first:nx],ub))
plot(x,ylim=ylim,type='n',xlim=c(first,lx))
usr <- par('usr')
rect(usr[1],usr[3],nx+1,usr[4],border=NA,col='lemonchiffon')
rect(nx1,usr[3],usr[2],usr[4],border=NA,col='lavender')
abline(h= (-3:3)*2 , col ='gray', lty =3)
polygon( c(nx1:lx,lx:nx1), c(lb,rev(ub)), col = 'orange', lty=2,border=NA)
lines(nx1:lx, lb , lty=2)
lines(nx1:lx, ub , lty=2)
lines(x, lwd=2)
lines(nx1:lx, forecast$pred , lwd=2 , col ='white')
box()
par(opar)
dev.off()
prob.dec <- array(NA, dim=fx)
prob.sdec <- array(NA, dim=fx)
prob.ldec <- array(NA, dim=fx)
prob.pval <- array(NA, dim=fx)
perf.pe <- array(0, dim=fx)
perf.mape <- array(0, dim=fx)
perf.mape1 <- array(0, dim=fx)
perf.se <- array(0, dim=fx)
perf.mse <- array(0, dim=fx)
perf.mse1 <- array(0, dim=fx)
perf.rmse <- array(0, dim=fx)
for (i in 1:fx) {
locSD <- (ub[i] - forecast$pred[i]) / 1.96
perf.pe[i] = (x[nx+i] - forecast$pred[i]) / forecast$pred[i]
perf.se[i] = (x[nx+i] - forecast$pred[i])^2
prob.dec[i] = pnorm((x[nx+i-1] - forecast$pred[i]) / locSD)
prob.sdec[i] = pnorm((x[nx+i-par5] - forecast$pred[i]) / locSD)
prob.ldec[i] = pnorm((x[nx] - forecast$pred[i]) / locSD)
prob.pval[i] = pnorm(abs(x[nx+i] - forecast$pred[i]) / locSD)
}
perf.mape[1] = abs(perf.pe[1])
perf.mse[1] = abs(perf.se[1])
for (i in 2:fx) {
perf.mape[i] = perf.mape[i-1] + abs(perf.pe[i])
perf.mape1[i] = perf.mape[i] / i
perf.mse[i] = perf.mse[i-1] + perf.se[i]
perf.mse1[i] = perf.mse[i] / i
}
perf.rmse = sqrt(perf.mse1)
bitmap(file='test2.png')
plot(forecast$pred, pch=19, type='b',main='ARIMA Extrapolation Forecast', ylab='Forecast and 95% CI', xlab='time',ylim=c(min(lb),max(ub)))
dum <- forecast$pred
dum[1:par1] <- x[(nx+1):lx]
lines(dum, lty=1)
lines(ub,lty=3)
lines(lb,lty=3)
dev.off()
load(file='createtable')
a<-table.start()
a<-table.row.start(a)
a<-table.element(a,'Univariate ARIMA Extrapolation Forecast',9,TRUE)
a<-table.row.end(a)
a<-table.row.start(a)
a<-table.element(a,'time',1,header=TRUE)
a<-table.element(a,'Y[t]',1,header=TRUE)
a<-table.element(a,'F[t]',1,header=TRUE)
a<-table.element(a,'95% LB',1,header=TRUE)
a<-table.element(a,'95% UB',1,header=TRUE)
a<-table.element(a,'p-value
(H0: Y[t] = F[t])',1,header=TRUE)
a<-table.element(a,'P(F[t]>Y[t-1])',1,header=TRUE)
a<-table.element(a,'P(F[t]>Y[t-s])',1,header=TRUE)
mylab <- paste('P(F[t]>Y[',nx,sep='')
mylab <- paste(mylab,'])',sep='')
a<-table.element(a,mylab,1,header=TRUE)
a<-table.row.end(a)
for (i in (nx-par5):nx) {
a<-table.row.start(a)
a<-table.element(a,i,header=TRUE)
a<-table.element(a,x[i])
a<-table.element(a,'-')
a<-table.row.end(a)
}
for (i in 1:fx) {
a<-table.row.start(a)
a<-table.element(a,nx+i,header=TRUE)
a<-table.element(a,round(x[nx+i],4))
a<-table.element(a,round(forecast$pred[i],4))
a<-table.element(a,round(lb[i],4))
a<-table.element(a,round(ub[i],4))
a<-table.element(a,round((1-prob.pval[i]),4))
a<-table.element(a,round((1-prob.dec[i]),4))
a<-table.element(a,round((1-prob.sdec[i]),4))
a<-table.element(a,round((1-prob.ldec[i]),4))
a<-table.row.end(a)
}
a<-table.end(a)
table.save(a,file='mytable.tab')
a<-table.start()
a<-table.row.start(a)
a<-table.element(a,'Univariate ARIMA Extrapolation Forecast Performance',7,TRUE)
a<-table.row.end(a)
a<-table.row.start(a)
a<-table.element(a,'time',1,header=TRUE)
a<-table.element(a,'% S.E.',1,header=TRUE)
a<-table.element(a,'PE',1,header=TRUE)
a<-table.element(a,'MAPE',1,header=TRUE)
a<-table.element(a,'Sq.E',1,header=TRUE)
a<-table.element(a,'MSE',1,header=TRUE)
a<-table.element(a,'RMSE',1,header=TRUE)
a<-table.row.end(a)
for (i in 1:fx) {
a<-table.row.start(a)
a<-table.element(a,nx+i,header=TRUE)
a<-table.element(a,round(perc.se[i],4))
a<-table.element(a,round(perf.pe[i],4))
a<-table.element(a,round(perf.mape1[i],4))
a<-table.element(a,round(perf.se[i],4))
a<-table.element(a,round(perf.mse1[i],4))
a<-table.element(a,round(perf.rmse[i],4))
a<-table.row.end(a)
}
a<-table.end(a)
table.save(a,file='mytable1.tab')