| Multiple Linear Regression - Estimated Regression Equation |
| Promet[t] = + 152.062865531415 -18.0165590135056Dummy[t] -2.89726267371305M1[t] -12.5469035036211M2[t] -20.1532325308280M3[t] -29.3261851634371M4[t] -23.4958259933450M5[t] -13.0854668232531M6[t] -17.0751076531611M7[t] -15.1014366803680M8[t] -2.27438931297709M9[t] -32.760718340184M10[t] -25.890359170092M11[t] -0.330359170091995t + e[t] |
| Multiple Linear Regression - Ordinary Least Squares | |||||
| Variable | Parameter | S.D. | T-STAT H0: parameter = 0 | 2-tail p-value | 1-tail p-value |
| (Intercept) | 152.062865531415 | 6.51776 | 23.3305 | 0 | 0 |
| Dummy | -18.0165590135056 | 3.207827 | -5.6164 | 1e-06 | 1e-06 |
| M1 | -2.89726267371305 | 7.726951 | -0.375 | 0.709417 | 0.354708 |
| M2 | -12.5469035036211 | 7.716216 | -1.626 | 0.110773 | 0.055386 |
| M3 | -20.1532325308280 | 7.688197 | -2.6213 | 0.011833 | 0.005917 |
| M4 | -29.3261851634371 | 7.698043 | -3.8096 | 0.000411 | 0.000206 |
| M5 | -23.4958259933450 | 7.690613 | -3.0551 | 0.003736 | 0.001868 |
| M6 | -13.0854668232531 | 7.684292 | -1.7029 | 0.095338 | 0.047669 |
| M7 | -17.0751076531611 | 7.679083 | -2.2236 | 0.031128 | 0.015564 |
| M8 | -15.1014366803680 | 7.651862 | -1.9736 | 0.054456 | 0.027228 |
| M9 | -2.27438931297709 | 7.672007 | -0.2965 | 0.768219 | 0.384109 |
| M10 | -32.760718340184 | 7.645135 | -4.2852 | 9.2e-05 | 4.6e-05 |
| M11 | -25.890359170092 | 7.643452 | -3.3873 | 0.001455 | 0.000727 |
| t | -0.330359170091995 | 0.092602 | -3.5675 | 0.000855 | 0.000428 |
| Multiple Linear Regression - Regression Statistics | |
| Multiple R | 0.826784265662317 |
| R-squared | 0.683572221946776 |
| Adjusted R-squared | 0.594146980323039 |
| F-TEST (value) | 7.64406346054902 |
| F-TEST (DF numerator) | 13 |
| F-TEST (DF denominator) | 46 |
| p-value | 9.7017964995061e-08 |
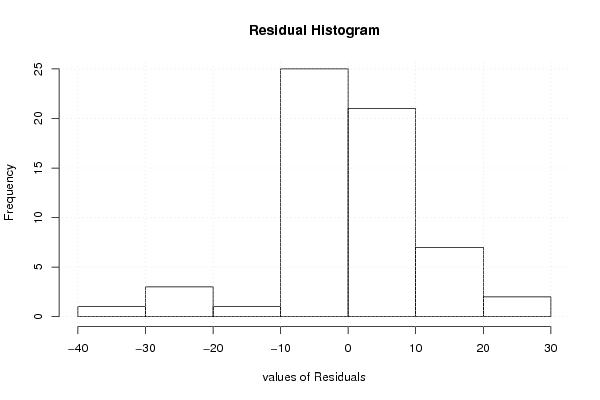
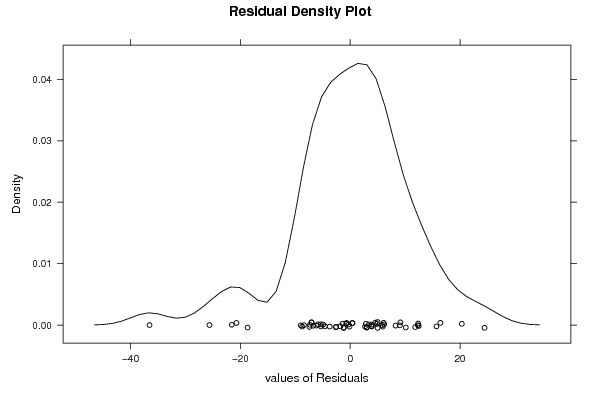
| Multiple Linear Regression - Residual Statistics | |
| Residual Standard Deviation | 12.0844718082050 |
| Sum Squared Residuals | 6717.58510863182 |
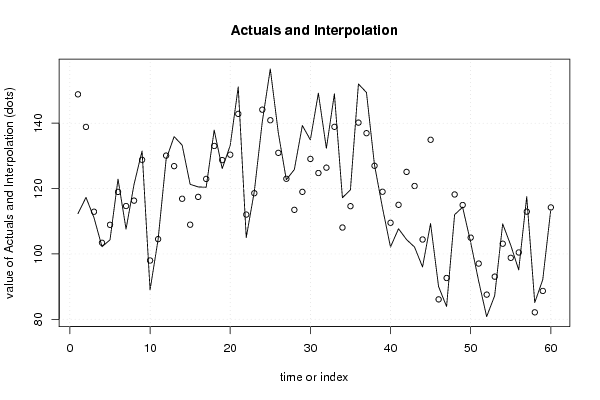
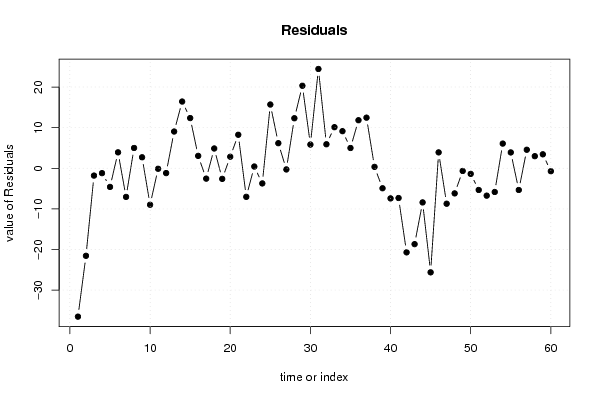
| Multiple Linear Regression - Actuals, Interpolation, and Residuals | |||
| Time or Index | Actuals | Interpolation Forecast | Residuals Prediction Error |
| 1 | 112.3 | 148.83524368761 | -36.5352436876101 |
| 2 | 117.3 | 138.85524368761 | -21.5552436876101 |
| 3 | 111.1 | 112.901996476806 | -1.80199647680563 |
| 4 | 102.2 | 103.398684674105 | -1.19868467410456 |
| 5 | 104.3 | 108.898684674104 | -4.59868467410449 |
| 6 | 122.9 | 118.978684674105 | 3.92131532589546 |
| 7 | 107.6 | 114.658684674105 | -7.05868467410455 |
| 8 | 121.3 | 116.301996476806 | 4.99800352319439 |
| 9 | 131.5 | 128.798684674104 | 2.70131532589551 |
| 10 | 89 | 97.9819964768056 | -8.98199647680562 |
| 11 | 104.4 | 104.521996476806 | -0.121996476805627 |
| 12 | 128.9 | 130.081996476806 | -1.18199647680564 |
| 13 | 135.9 | 126.854374633001 | 9.0456253669994 |
| 14 | 133.3 | 116.874374633001 | 16.4256253669994 |
| 15 | 121.3 | 108.937686435702 | 12.3623135642983 |
| 16 | 120.5 | 117.450933646506 | 3.04906635349385 |
| 17 | 120.4 | 122.950933646506 | -2.55093364650617 |
| 18 | 137.9 | 133.030933646506 | 4.86906635349384 |
| 19 | 126.1 | 128.710933646506 | -2.61093364650616 |
| 20 | 133.2 | 130.354245449207 | 2.8457545507927 |
| 21 | 151.1 | 142.850933646506 | 8.24906635349382 |
| 22 | 105 | 112.034245449207 | -7.03424544920729 |
| 23 | 119 | 118.574245449207 | 0.425754550792716 |
| 24 | 140.4 | 144.134245449207 | -3.73424544920727 |
| 25 | 156.6 | 140.906623605402 | 15.6933763945978 |
| 26 | 137.1 | 130.926623605402 | 6.17337639459775 |
| 27 | 122.7 | 122.989935408103 | -0.289935408103348 |
| 28 | 125.8 | 113.486623605402 | 12.3133763945978 |
| 29 | 139.3 | 118.986623605402 | 20.3133763945978 |
| 30 | 134.9 | 129.066623605402 | 5.83337639459778 |
| 31 | 149.2 | 124.746623605402 | 24.4533763945978 |
| 32 | 132.3 | 126.389935408103 | 5.91006459189666 |
| 33 | 149 | 138.886623605402 | 10.1133763945978 |
| 34 | 117.2 | 108.069935408103 | 9.13006459189666 |
| 35 | 119.6 | 114.609935408103 | 4.99006459189665 |
| 36 | 152 | 140.169935408103 | 11.8300645918967 |
| 37 | 149.4 | 136.942313564298 | 12.4576864357017 |
| 38 | 127.3 | 126.962313564298 | 0.337686435701697 |
| 39 | 114.1 | 119.025625366999 | -4.92562536699942 |
| 40 | 102.1 | 109.522313564298 | -7.42231356429829 |
| 41 | 107.7 | 115.022313564298 | -7.32231356429831 |
| 42 | 104.4 | 125.102313564298 | -20.7023135642983 |
| 43 | 102.1 | 120.782313564298 | -18.6823135642983 |
| 44 | 96 | 104.409066353494 | -8.40906635349383 |
| 45 | 109.3 | 134.922313564298 | -25.6223135642983 |
| 46 | 90 | 86.0890663534938 | 3.91093364650617 |
| 47 | 83.9 | 92.6290663534938 | -8.72906635349382 |
| 48 | 112 | 118.189066353494 | -6.18906635349381 |
| 49 | 114.3 | 114.961444509689 | -0.66144450968879 |
| 50 | 103.6 | 104.981444509689 | -1.38144450968879 |
| 51 | 91.7 | 97.0447563123899 | -5.34475631238988 |
| 52 | 80.8 | 87.5414445096888 | -6.74144450968877 |
| 53 | 87.2 | 93.0414445096888 | -5.8414445096888 |
| 54 | 109.2 | 103.121444509689 | 6.07855549031123 |
| 55 | 102.7 | 98.8014445096888 | 3.89855549031124 |
| 56 | 95.1 | 100.444756312390 | -5.34475631238991 |
| 57 | 117.5 | 112.941444509689 | 4.55855549031123 |
| 58 | 85.1 | 82.1247563123899 | 2.97524368761009 |
| 59 | 92.1 | 88.6647563123899 | 3.4352436876101 |
| 60 | 113.5 | 114.224756312390 | -0.724756312389882 |
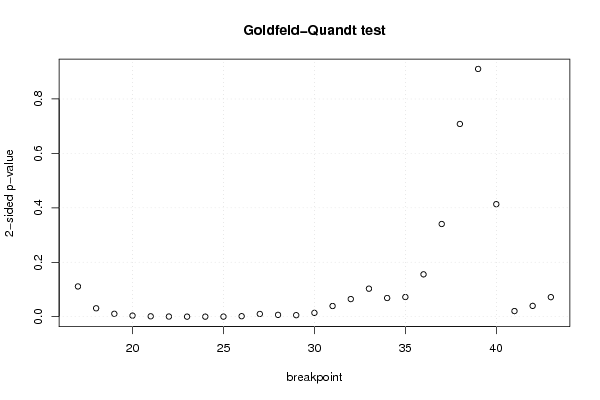
| Goldfeld-Quandt test for Heteroskedasticity | |||
| p-values | Alternative Hypothesis | ||
| breakpoint index | greater | 2-sided | less |
| 17 | 0.055558778964129 | 0.111117557928258 | 0.944441221035871 |
| 18 | 0.0154392087324290 | 0.0308784174648579 | 0.98456079126757 |
| 19 | 0.00528386751060416 | 0.0105677350212083 | 0.994716132489396 |
| 20 | 0.00189709242787604 | 0.00379418485575207 | 0.998102907572124 |
| 21 | 0.000690905074915971 | 0.00138181014983194 | 0.999309094925084 |
| 22 | 0.000253210011032967 | 0.000506420022065934 | 0.999746789988967 |
| 23 | 7.06649167315678e-05 | 0.000141329833463136 | 0.999929335083268 |
| 24 | 4.57711078581476e-05 | 9.15422157162952e-05 | 0.999954228892142 |
| 25 | 7.4563589341806e-05 | 0.000149127178683612 | 0.999925436410658 |
| 26 | 0.000889920901442977 | 0.00177984180288595 | 0.999110079098557 |
| 27 | 0.00496772944839409 | 0.00993545889678819 | 0.995032270551606 |
| 28 | 0.0032741108186291 | 0.0065482216372582 | 0.99672588918137 |
| 29 | 0.00277606692689821 | 0.00555213385379641 | 0.997223933073102 |
| 30 | 0.00701693388032188 | 0.0140338677606438 | 0.992983066119678 |
| 31 | 0.0195759805484198 | 0.0391519610968397 | 0.98042401945158 |
| 32 | 0.0323403680798343 | 0.0646807361596686 | 0.967659631920166 |
| 33 | 0.0514160710533351 | 0.102832142106670 | 0.948583928946665 |
| 34 | 0.0342905082040177 | 0.0685810164080354 | 0.965709491795982 |
| 35 | 0.0360785466195567 | 0.0721570932391135 | 0.963921453380443 |
| 36 | 0.0777965897031705 | 0.155593179406341 | 0.92220341029683 |
| 37 | 0.170263516670528 | 0.340527033341056 | 0.829736483329472 |
| 38 | 0.354061258399093 | 0.708122516798186 | 0.645938741600907 |
| 39 | 0.544858574796864 | 0.910282850406273 | 0.455141425203136 |
| 40 | 0.79328908009373 | 0.413421839812542 | 0.206710919906271 |
| 41 | 0.989696390177186 | 0.0206072196456283 | 0.0103036098228141 |
| 42 | 0.980171516585623 | 0.0396569668287547 | 0.0198284834143774 |
| 43 | 0.964124593924358 | 0.0717508121512839 | 0.0358754060756420 |
| Meta Analysis of Goldfeld-Quandt test for Heteroskedasticity | |||
| Description | # significant tests | % significant tests | OK/NOK |
| 1% type I error level | 10 | 0.370370370370370 | NOK |
| 5% type I error level | 16 | 0.592592592592593 | NOK |
| 10% type I error level | 20 | 0.740740740740741 | NOK |