| Multiple Linear Regression - Estimated Regression Equation |
| Promet[t] = + 140.995833333333 -19.3930555555555Dummy[t] + 0.461388888888867M1[t] -9.5186111111111M2[t] -17.18M3[t] -26.9586111111111M4[t] -21.4586111111111M5[t] -11.3786111111111M6[t] -15.6986111111111M7[t] -13.78M8[t] -1.55861111111111M9[t] -32.1M10[t] -25.56M11[t] + e[t] |
| Multiple Linear Regression - Ordinary Least Squares | |||||
| Variable | Parameter | S.D. | T-STAT H0: parameter = 0 | 2-tail p-value | 1-tail p-value |
| (Intercept) | 140.995833333333 | 6.407514 | 22.0048 | 0 | 0 |
| Dummy | -19.3930555555555 | 3.55973 | -5.4479 | 2e-06 | 1e-06 |
| M1 | 0.461388888888867 | 8.572965 | 0.0538 | 0.957307 | 0.478654 |
| M2 | -9.5186111111111 | 8.572965 | -1.1103 | 0.272516 | 0.136258 |
| M3 | -17.18 | 8.543352 | -2.0109 | 0.05009 | 0.025045 |
| M4 | -26.9586111111111 | 8.572965 | -3.1446 | 0.002881 | 0.001441 |
| M5 | -21.4586111111111 | 8.572965 | -2.5031 | 0.015846 | 0.007923 |
| M6 | -11.3786111111111 | 8.572965 | -1.3273 | 0.190832 | 0.095416 |
| M7 | -15.6986111111111 | 8.572965 | -1.8312 | 0.073417 | 0.036709 |
| M8 | -13.78 | 8.543352 | -1.613 | 0.113451 | 0.056725 |
| M9 | -1.55861111111111 | 8.572965 | -0.1818 | 0.856517 | 0.428259 |
| M10 | -32.1 | 8.543352 | -3.7573 | 0.000474 | 0.000237 |
| M11 | -25.56 | 8.543352 | -2.9918 | 0.004407 | 0.002204 |
| Multiple Linear Regression - Regression Statistics | |
| Multiple R | 0.772025713756316 |
| R-squared | 0.59602370270095 |
| Adjusted R-squared | 0.492880818284171 |
| F-TEST (value) | 5.77862162834755 |
| F-TEST (DF numerator) | 12 |
| F-TEST (DF denominator) | 47 |
| p-value | 5.27128218130724e-06 |
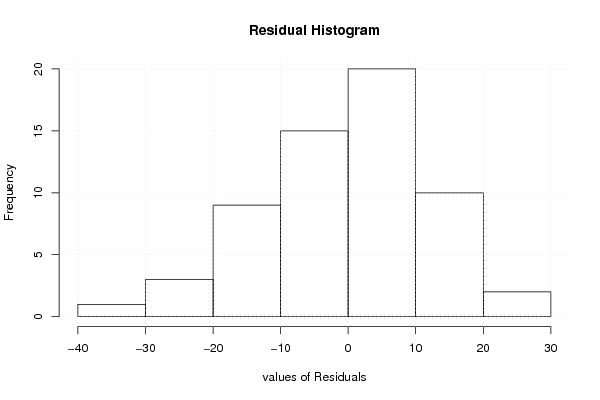
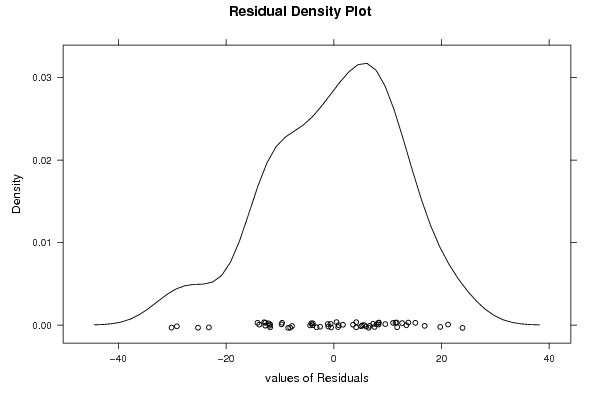
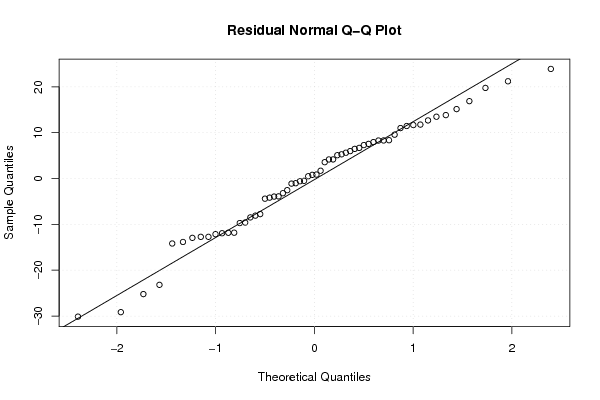
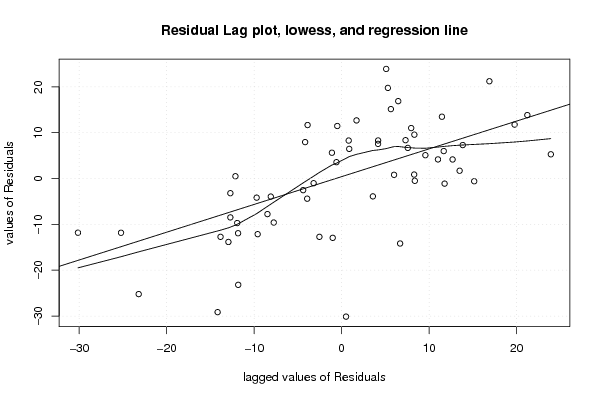
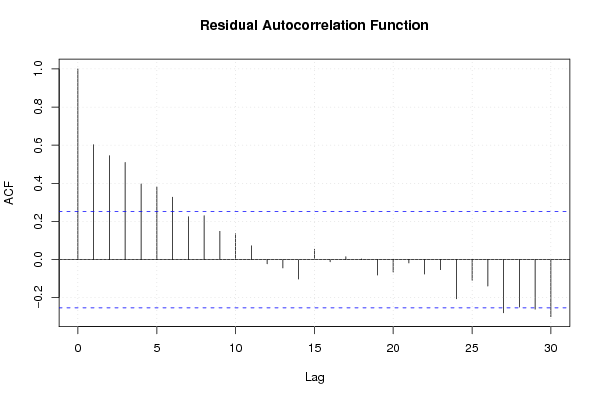
| Multiple Linear Regression - Residual Statistics | |
| Residual Standard Deviation | 13.5082254732941 |
| Sum Squared Residuals | 8576.19130555557 |
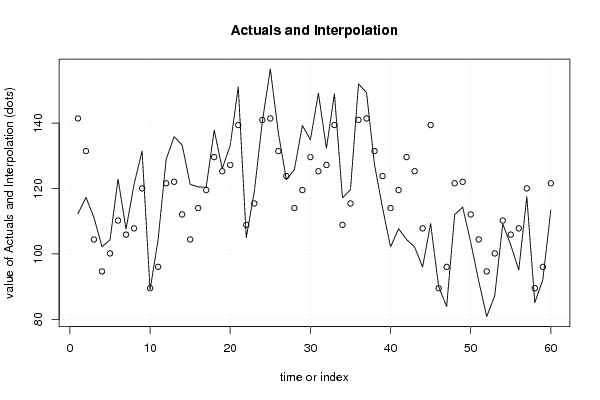
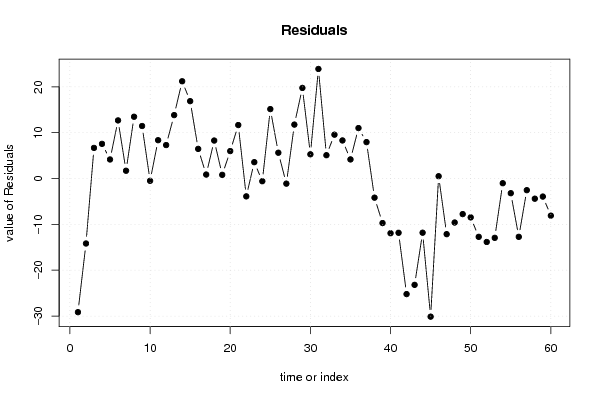
| Multiple Linear Regression - Actuals, Interpolation, and Residuals | |||
| Time or Index | Actuals | Interpolation Forecast | Residuals Prediction Error |
| 1 | 112.3 | 141.457222222222 | -29.1572222222224 |
| 2 | 117.3 | 131.477222222222 | -14.1772222222222 |
| 3 | 111.1 | 104.422777777778 | 6.67722222222222 |
| 4 | 102.2 | 94.6441666666667 | 7.55583333333333 |
| 5 | 104.3 | 100.144166666667 | 4.15583333333331 |
| 6 | 122.9 | 110.224166666667 | 12.6758333333333 |
| 7 | 107.6 | 105.904166666667 | 1.69583333333333 |
| 8 | 121.3 | 107.822777777778 | 13.4772222222222 |
| 9 | 131.5 | 120.044166666667 | 11.4558333333333 |
| 10 | 89 | 89.5027777777778 | -0.502777777777784 |
| 11 | 104.4 | 96.0427777777778 | 8.35722222222223 |
| 12 | 128.9 | 121.602777777778 | 7.29722222222223 |
| 13 | 135.9 | 122.064166666667 | 13.8358333333334 |
| 14 | 133.3 | 112.084166666667 | 21.2158333333333 |
| 15 | 121.3 | 104.422777777778 | 16.8772222222222 |
| 16 | 120.5 | 114.037222222222 | 6.46277777777778 |
| 17 | 120.4 | 119.537222222222 | 0.862777777777785 |
| 18 | 137.9 | 129.617222222222 | 8.28277777777778 |
| 19 | 126.1 | 125.297222222222 | 0.802777777777778 |
| 20 | 133.2 | 127.215833333333 | 5.98416666666666 |
| 21 | 151.1 | 139.437222222222 | 11.6627777777778 |
| 22 | 105 | 108.895833333333 | -3.89583333333333 |
| 23 | 119 | 115.435833333333 | 3.56416666666667 |
| 24 | 140.4 | 140.995833333333 | -0.595833333333324 |
| 25 | 156.6 | 141.457222222222 | 15.1427777777778 |
| 26 | 137.1 | 131.477222222222 | 5.62277777777778 |
| 27 | 122.7 | 123.815833333333 | -1.11583333333333 |
| 28 | 125.8 | 114.037222222222 | 11.7627777777778 |
| 29 | 139.3 | 119.537222222222 | 19.7627777777778 |
| 30 | 134.9 | 129.617222222222 | 5.28277777777778 |
| 31 | 149.2 | 125.297222222222 | 23.9027777777778 |
| 32 | 132.3 | 127.215833333333 | 5.08416666666669 |
| 33 | 149 | 139.437222222222 | 9.56277777777779 |
| 34 | 117.2 | 108.895833333333 | 8.30416666666667 |
| 35 | 119.6 | 115.435833333333 | 4.16416666666666 |
| 36 | 152 | 140.995833333333 | 11.0041666666667 |
| 37 | 149.4 | 141.457222222222 | 7.94277777777782 |
| 38 | 127.3 | 131.477222222222 | -4.17722222222222 |
| 39 | 114.1 | 123.815833333333 | -9.71583333333333 |
| 40 | 102.1 | 114.037222222222 | -11.9372222222222 |
| 41 | 107.7 | 119.537222222222 | -11.8372222222222 |
| 42 | 104.4 | 129.617222222222 | -25.2172222222222 |
| 43 | 102.1 | 125.297222222222 | -23.1972222222222 |
| 44 | 96 | 107.822777777778 | -11.8227777777778 |
| 45 | 109.3 | 139.437222222222 | -30.1372222222222 |
| 46 | 90 | 89.5027777777778 | 0.497222222222222 |
| 47 | 83.9 | 96.0427777777778 | -12.1427777777778 |
| 48 | 112 | 121.602777777778 | -9.60277777777778 |
| 49 | 114.3 | 122.064166666667 | -7.76416666666664 |
| 50 | 103.6 | 112.084166666667 | -8.48416666666667 |
| 51 | 91.7 | 104.422777777778 | -12.7227777777778 |
| 52 | 80.8 | 94.6441666666667 | -13.8441666666667 |
| 53 | 87.2 | 100.144166666667 | -12.9441666666667 |
| 54 | 109.2 | 110.224166666667 | -1.02416666666667 |
| 55 | 102.7 | 105.904166666667 | -3.20416666666666 |
| 56 | 95.1 | 107.822777777778 | -12.7227777777778 |
| 57 | 117.5 | 120.044166666667 | -2.54416666666667 |
| 58 | 85.1 | 89.5027777777778 | -4.40277777777778 |
| 59 | 92.1 | 96.0427777777778 | -3.94277777777779 |
| 60 | 113.5 | 121.602777777778 | -8.10277777777778 |
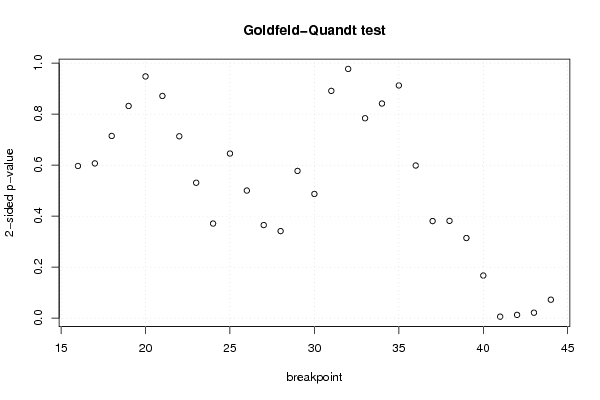
| Goldfeld-Quandt test for Heteroskedasticity | |||
| p-values | Alternative Hypothesis | ||
| breakpoint index | greater | 2-sided | less |
| 16 | 0.701753311023599 | 0.596493377952803 | 0.298246688976401 |
| 17 | 0.696647832561954 | 0.606704334876093 | 0.303352167438046 |
| 18 | 0.642845370577563 | 0.714309258844875 | 0.357154629422437 |
| 19 | 0.583970542602611 | 0.832058914794777 | 0.416029457397389 |
| 20 | 0.473941417999722 | 0.947882835999445 | 0.526058582000278 |
| 21 | 0.435628121569585 | 0.87125624313917 | 0.564371878430415 |
| 22 | 0.356561194615606 | 0.713122389231211 | 0.643438805384394 |
| 23 | 0.2653313686351 | 0.5306627372702 | 0.7346686313649 |
| 24 | 0.185294611909995 | 0.370589223819989 | 0.814705388090005 |
| 25 | 0.322646631304417 | 0.645293262608835 | 0.677353368695583 |
| 26 | 0.250026996211291 | 0.500053992422582 | 0.749973003788709 |
| 27 | 0.182319621510035 | 0.364639243020071 | 0.817680378489965 |
| 28 | 0.170462968226818 | 0.340925936453637 | 0.829537031773182 |
| 29 | 0.28853740997838 | 0.57707481995676 | 0.71146259002162 |
| 30 | 0.24338551268679 | 0.48677102537358 | 0.75661448731321 |
| 31 | 0.554423181353809 | 0.891153637292382 | 0.445576818646191 |
| 32 | 0.511389357442927 | 0.977221285114146 | 0.488610642557073 |
| 33 | 0.608124335760759 | 0.783751328478483 | 0.391875664239241 |
| 34 | 0.579254838927339 | 0.841490322145322 | 0.420745161072661 |
| 35 | 0.543763008232741 | 0.912473983534518 | 0.456236991767259 |
| 36 | 0.700821830905684 | 0.598356338188633 | 0.299178169094317 |
| 37 | 0.80985981421043 | 0.380280371579139 | 0.190140185789569 |
| 38 | 0.80943607638322 | 0.381127847233561 | 0.190563923616781 |
| 39 | 0.843087427497762 | 0.313825145004476 | 0.156912572502238 |
| 40 | 0.916679644415352 | 0.166640711169296 | 0.0833203555846481 |
| 41 | 0.99735973663815 | 0.00528052672369979 | 0.00264026336184990 |
| 42 | 0.99389390847545 | 0.0122121830490987 | 0.00610609152454935 |
| 43 | 0.98962592246172 | 0.0207481550765607 | 0.0103740775382804 |
| 44 | 0.964140534640713 | 0.0717189307185746 | 0.0358594653592873 |
| Meta Analysis of Goldfeld-Quandt test for Heteroskedasticity | |||
| Description | # significant tests | % significant tests | OK/NOK |
| 1% type I error level | 1 | 0.0344827586206897 | NOK |
| 5% type I error level | 3 | 0.103448275862069 | NOK |
| 10% type I error level | 4 | 0.137931034482759 | NOK |