Free Statistics

of Irreproducible Research!

Author's title

Author*The author of this computation has been verified*
R Software Modulerwasp_autocorrelation.wasp
Title produced by software(Partial) Autocorrelation Function
Date of computationTue, 07 Dec 2010 09:25:48 +0000
Cite this page as followsStatistical Computations at FreeStatistics.org, Office for Research Development and Education, URL https://freestatistics.org/blog/index.php?v=date/2010/Dec/07/t1291713862s629hwu0csvkn8n.htm/, Retrieved Sat, 04 May 2024 00:00:19 +0000
Statistical Computations at FreeStatistics.org, Office for Research Development and Education, URL https://freestatistics.org/blog/index.php?pk=106062, Retrieved Sat, 04 May 2024 00:00:19 +0000
QR Codes:

Original text written by user:
IsPrivate?No (this computation is public)
User-defined keywords
Estimated Impact173
Family? (F = Feedback message, R = changed R code, M = changed R Module, P = changed Parameters, D = changed Data)
-     [Univariate Data Series] [data set] [2008-12-01 19:54:57] [b98453cac15ba1066b407e146608df68]
- RMP   [(Partial) Autocorrelation Function] [Unemployment] [2010-11-29 09:09:37] [b98453cac15ba1066b407e146608df68]
-   PD      [(Partial) Autocorrelation Function] [ws 9: acf] [2010-12-07 09:25:48] [09489ba95453d3f5c9e6f2eaeda915af] [Current]
Feedback Forum

Post a new message
Dataseries X:
94.6
95.9
104.7
102.8
98.1
113.9
80.9
95.7
113.2
105.9
108.8
102.3
99
100.7
115.5
100.7
109.9
114.6
85.4
100.5
114.8
116.5
112.9
102
106
105.3
118.8
106.1
109.3
117.2
92.5
104.2
112.5
122.4
113.3
100
110.7
112.8
109.8
117.3
109.1
115.9
96
99.8
116.8
115.7
99.4
94.3
91
93.2
103.1
94.1
91.8
102.7
82.6
89.1
104.5
105.1
95.1
88.7
86.3
91.8
111.5
99.7
97.5
111.7
86.2
95.4


Summary of computational transaction
Raw Inputview raw input (R code)
Raw Outputview raw output of R engine
Computing time2 seconds
R Server'Sir Ronald Aylmer Fisher' @ 193.190.124.24

\begin{tabular}{lllllllll}
\hline
Summary of computational transaction \tabularnewline
Raw Input & view raw input (R code)  \tabularnewline
Raw Output & view raw output of R engine  \tabularnewline
Computing time & 2 seconds \tabularnewline
R Server & 'Sir Ronald Aylmer Fisher' @ 193.190.124.24 \tabularnewline
\hline
\end{tabular}
%Source: https://freestatistics.org/blog/index.php?pk=106062&T=0

[TABLE]
[ROW][C]Summary of computational transaction[/C][/ROW]
[ROW][C]Raw Input[/C][C]view raw input (R code) [/C][/ROW]
[ROW][C]Raw Output[/C][C]view raw output of R engine [/C][/ROW]
[ROW][C]Computing time[/C][C]2 seconds[/C][/ROW]
[ROW][C]R Server[/C][C]'Sir Ronald Aylmer Fisher' @ 193.190.124.24[/C][/ROW]
[/TABLE]
Source: https://freestatistics.org/blog/index.php?pk=106062&T=0

Globally Unique Identifier (entire table): ba.freestatistics.org/blog/index.php?pk=106062&T=0

As an alternative you can also use a QR Code:  

The GUIDs for individual cells are displayed in the table below:

Summary of computational transaction
Raw Inputview raw input (R code)
Raw Outputview raw output of R engine
Computing time2 seconds
R Server'Sir Ronald Aylmer Fisher' @ 193.190.124.24


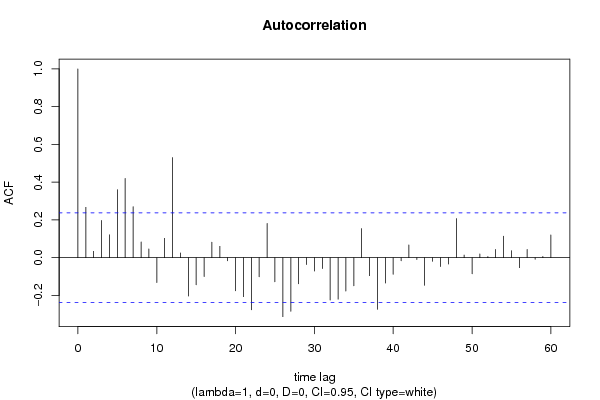
Autocorrelation Function
Time lag kACF(k)T-STATP-value
10.266612.19850.015659
20.0336530.27750.391116
30.1976551.62990.053873
40.1211190.99880.160723
50.3597112.96630.002078
60.4195113.45940.00047
70.2702822.22880.014568
80.0829960.68440.248024
90.0461170.38030.352459
10-0.131488-1.08430.141035
110.102520.84540.200426
120.5303724.37362.1e-05
130.0248330.20480.419179
14-0.202743-1.67190.049574
15-0.143557-1.18380.120306
16-0.099368-0.81940.207708
170.0822060.67790.250071
180.0601750.49620.31067
19-0.016043-0.13230.447572
20-0.175017-1.44320.076773
21-0.206658-1.70410.04646
22-0.276339-2.27880.012914
23-0.100819-0.83140.204337
240.1812831.49490.069784
25-0.128167-1.05690.14715
26-0.312456-2.57660.006077
27-0.283703-2.33950.011128
28-0.138009-1.13810.129546
29-0.036233-0.29880.383008
30-0.070689-0.58290.280938
31-0.057706-0.47590.317852
32-0.224853-1.85420.034025
33-0.219597-1.81080.037291
34-0.176644-1.45660.074908
35-0.149115-1.22960.111536
360.1542171.27170.103904
37-0.095226-0.78530.217517
38-0.273837-2.25810.013576
39-0.133966-1.10470.136588
40-0.088201-0.72730.234763
41-0.01611-0.13280.447353
420.0672530.55460.2905
43-0.009913-0.08170.467544
44-0.146199-1.20560.116077
45-0.018915-0.1560.438257
46-0.047383-0.39070.34861
47-0.034024-0.28060.389946
480.2069941.70690.0462
490.0138010.11380.454863
50-0.085483-0.70490.241637
510.0197630.1630.435514
520.0058250.0480.480914
530.043440.35820.360645
540.1132090.93350.176921
550.0369580.30480.380739
56-0.052884-0.43610.332074
570.0434820.35860.360518
58-0.008371-0.0690.472584
590.0063090.0520.47933
600.1202360.99150.16248

\begin{tabular}{lllllllll}
\hline
Autocorrelation Function \tabularnewline
Time lag k & ACF(k) & T-STAT & P-value \tabularnewline
1 & 0.26661 & 2.1985 & 0.015659 \tabularnewline
2 & 0.033653 & 0.2775 & 0.391116 \tabularnewline
3 & 0.197655 & 1.6299 & 0.053873 \tabularnewline
4 & 0.121119 & 0.9988 & 0.160723 \tabularnewline
5 & 0.359711 & 2.9663 & 0.002078 \tabularnewline
6 & 0.419511 & 3.4594 & 0.00047 \tabularnewline
7 & 0.270282 & 2.2288 & 0.014568 \tabularnewline
8 & 0.082996 & 0.6844 & 0.248024 \tabularnewline
9 & 0.046117 & 0.3803 & 0.352459 \tabularnewline
10 & -0.131488 & -1.0843 & 0.141035 \tabularnewline
11 & 0.10252 & 0.8454 & 0.200426 \tabularnewline
12 & 0.530372 & 4.3736 & 2.1e-05 \tabularnewline
13 & 0.024833 & 0.2048 & 0.419179 \tabularnewline
14 & -0.202743 & -1.6719 & 0.049574 \tabularnewline
15 & -0.143557 & -1.1838 & 0.120306 \tabularnewline
16 & -0.099368 & -0.8194 & 0.207708 \tabularnewline
17 & 0.082206 & 0.6779 & 0.250071 \tabularnewline
18 & 0.060175 & 0.4962 & 0.31067 \tabularnewline
19 & -0.016043 & -0.1323 & 0.447572 \tabularnewline
20 & -0.175017 & -1.4432 & 0.076773 \tabularnewline
21 & -0.206658 & -1.7041 & 0.04646 \tabularnewline
22 & -0.276339 & -2.2788 & 0.012914 \tabularnewline
23 & -0.100819 & -0.8314 & 0.204337 \tabularnewline
24 & 0.181283 & 1.4949 & 0.069784 \tabularnewline
25 & -0.128167 & -1.0569 & 0.14715 \tabularnewline
26 & -0.312456 & -2.5766 & 0.006077 \tabularnewline
27 & -0.283703 & -2.3395 & 0.011128 \tabularnewline
28 & -0.138009 & -1.1381 & 0.129546 \tabularnewline
29 & -0.036233 & -0.2988 & 0.383008 \tabularnewline
30 & -0.070689 & -0.5829 & 0.280938 \tabularnewline
31 & -0.057706 & -0.4759 & 0.317852 \tabularnewline
32 & -0.224853 & -1.8542 & 0.034025 \tabularnewline
33 & -0.219597 & -1.8108 & 0.037291 \tabularnewline
34 & -0.176644 & -1.4566 & 0.074908 \tabularnewline
35 & -0.149115 & -1.2296 & 0.111536 \tabularnewline
36 & 0.154217 & 1.2717 & 0.103904 \tabularnewline
37 & -0.095226 & -0.7853 & 0.217517 \tabularnewline
38 & -0.273837 & -2.2581 & 0.013576 \tabularnewline
39 & -0.133966 & -1.1047 & 0.136588 \tabularnewline
40 & -0.088201 & -0.7273 & 0.234763 \tabularnewline
41 & -0.01611 & -0.1328 & 0.447353 \tabularnewline
42 & 0.067253 & 0.5546 & 0.2905 \tabularnewline
43 & -0.009913 & -0.0817 & 0.467544 \tabularnewline
44 & -0.146199 & -1.2056 & 0.116077 \tabularnewline
45 & -0.018915 & -0.156 & 0.438257 \tabularnewline
46 & -0.047383 & -0.3907 & 0.34861 \tabularnewline
47 & -0.034024 & -0.2806 & 0.389946 \tabularnewline
48 & 0.206994 & 1.7069 & 0.0462 \tabularnewline
49 & 0.013801 & 0.1138 & 0.454863 \tabularnewline
50 & -0.085483 & -0.7049 & 0.241637 \tabularnewline
51 & 0.019763 & 0.163 & 0.435514 \tabularnewline
52 & 0.005825 & 0.048 & 0.480914 \tabularnewline
53 & 0.04344 & 0.3582 & 0.360645 \tabularnewline
54 & 0.113209 & 0.9335 & 0.176921 \tabularnewline
55 & 0.036958 & 0.3048 & 0.380739 \tabularnewline
56 & -0.052884 & -0.4361 & 0.332074 \tabularnewline
57 & 0.043482 & 0.3586 & 0.360518 \tabularnewline
58 & -0.008371 & -0.069 & 0.472584 \tabularnewline
59 & 0.006309 & 0.052 & 0.47933 \tabularnewline
60 & 0.120236 & 0.9915 & 0.16248 \tabularnewline
\hline
\end{tabular}
%Source: https://freestatistics.org/blog/index.php?pk=106062&T=1

[TABLE]
[ROW][C]Autocorrelation Function[/C][/ROW]
[ROW][C]Time lag k[/C][C]ACF(k)[/C][C]T-STAT[/C][C]P-value[/C][/ROW]
[ROW][C]1[/C][C]0.26661[/C][C]2.1985[/C][C]0.015659[/C][/ROW]
[ROW][C]2[/C][C]0.033653[/C][C]0.2775[/C][C]0.391116[/C][/ROW]
[ROW][C]3[/C][C]0.197655[/C][C]1.6299[/C][C]0.053873[/C][/ROW]
[ROW][C]4[/C][C]0.121119[/C][C]0.9988[/C][C]0.160723[/C][/ROW]
[ROW][C]5[/C][C]0.359711[/C][C]2.9663[/C][C]0.002078[/C][/ROW]
[ROW][C]6[/C][C]0.419511[/C][C]3.4594[/C][C]0.00047[/C][/ROW]
[ROW][C]7[/C][C]0.270282[/C][C]2.2288[/C][C]0.014568[/C][/ROW]
[ROW][C]8[/C][C]0.082996[/C][C]0.6844[/C][C]0.248024[/C][/ROW]
[ROW][C]9[/C][C]0.046117[/C][C]0.3803[/C][C]0.352459[/C][/ROW]
[ROW][C]10[/C][C]-0.131488[/C][C]-1.0843[/C][C]0.141035[/C][/ROW]
[ROW][C]11[/C][C]0.10252[/C][C]0.8454[/C][C]0.200426[/C][/ROW]
[ROW][C]12[/C][C]0.530372[/C][C]4.3736[/C][C]2.1e-05[/C][/ROW]
[ROW][C]13[/C][C]0.024833[/C][C]0.2048[/C][C]0.419179[/C][/ROW]
[ROW][C]14[/C][C]-0.202743[/C][C]-1.6719[/C][C]0.049574[/C][/ROW]
[ROW][C]15[/C][C]-0.143557[/C][C]-1.1838[/C][C]0.120306[/C][/ROW]
[ROW][C]16[/C][C]-0.099368[/C][C]-0.8194[/C][C]0.207708[/C][/ROW]
[ROW][C]17[/C][C]0.082206[/C][C]0.6779[/C][C]0.250071[/C][/ROW]
[ROW][C]18[/C][C]0.060175[/C][C]0.4962[/C][C]0.31067[/C][/ROW]
[ROW][C]19[/C][C]-0.016043[/C][C]-0.1323[/C][C]0.447572[/C][/ROW]
[ROW][C]20[/C][C]-0.175017[/C][C]-1.4432[/C][C]0.076773[/C][/ROW]
[ROW][C]21[/C][C]-0.206658[/C][C]-1.7041[/C][C]0.04646[/C][/ROW]
[ROW][C]22[/C][C]-0.276339[/C][C]-2.2788[/C][C]0.012914[/C][/ROW]
[ROW][C]23[/C][C]-0.100819[/C][C]-0.8314[/C][C]0.204337[/C][/ROW]
[ROW][C]24[/C][C]0.181283[/C][C]1.4949[/C][C]0.069784[/C][/ROW]
[ROW][C]25[/C][C]-0.128167[/C][C]-1.0569[/C][C]0.14715[/C][/ROW]
[ROW][C]26[/C][C]-0.312456[/C][C]-2.5766[/C][C]0.006077[/C][/ROW]
[ROW][C]27[/C][C]-0.283703[/C][C]-2.3395[/C][C]0.011128[/C][/ROW]
[ROW][C]28[/C][C]-0.138009[/C][C]-1.1381[/C][C]0.129546[/C][/ROW]
[ROW][C]29[/C][C]-0.036233[/C][C]-0.2988[/C][C]0.383008[/C][/ROW]
[ROW][C]30[/C][C]-0.070689[/C][C]-0.5829[/C][C]0.280938[/C][/ROW]
[ROW][C]31[/C][C]-0.057706[/C][C]-0.4759[/C][C]0.317852[/C][/ROW]
[ROW][C]32[/C][C]-0.224853[/C][C]-1.8542[/C][C]0.034025[/C][/ROW]
[ROW][C]33[/C][C]-0.219597[/C][C]-1.8108[/C][C]0.037291[/C][/ROW]
[ROW][C]34[/C][C]-0.176644[/C][C]-1.4566[/C][C]0.074908[/C][/ROW]
[ROW][C]35[/C][C]-0.149115[/C][C]-1.2296[/C][C]0.111536[/C][/ROW]
[ROW][C]36[/C][C]0.154217[/C][C]1.2717[/C][C]0.103904[/C][/ROW]
[ROW][C]37[/C][C]-0.095226[/C][C]-0.7853[/C][C]0.217517[/C][/ROW]
[ROW][C]38[/C][C]-0.273837[/C][C]-2.2581[/C][C]0.013576[/C][/ROW]
[ROW][C]39[/C][C]-0.133966[/C][C]-1.1047[/C][C]0.136588[/C][/ROW]
[ROW][C]40[/C][C]-0.088201[/C][C]-0.7273[/C][C]0.234763[/C][/ROW]
[ROW][C]41[/C][C]-0.01611[/C][C]-0.1328[/C][C]0.447353[/C][/ROW]
[ROW][C]42[/C][C]0.067253[/C][C]0.5546[/C][C]0.2905[/C][/ROW]
[ROW][C]43[/C][C]-0.009913[/C][C]-0.0817[/C][C]0.467544[/C][/ROW]
[ROW][C]44[/C][C]-0.146199[/C][C]-1.2056[/C][C]0.116077[/C][/ROW]
[ROW][C]45[/C][C]-0.018915[/C][C]-0.156[/C][C]0.438257[/C][/ROW]
[ROW][C]46[/C][C]-0.047383[/C][C]-0.3907[/C][C]0.34861[/C][/ROW]
[ROW][C]47[/C][C]-0.034024[/C][C]-0.2806[/C][C]0.389946[/C][/ROW]
[ROW][C]48[/C][C]0.206994[/C][C]1.7069[/C][C]0.0462[/C][/ROW]
[ROW][C]49[/C][C]0.013801[/C][C]0.1138[/C][C]0.454863[/C][/ROW]
[ROW][C]50[/C][C]-0.085483[/C][C]-0.7049[/C][C]0.241637[/C][/ROW]
[ROW][C]51[/C][C]0.019763[/C][C]0.163[/C][C]0.435514[/C][/ROW]
[ROW][C]52[/C][C]0.005825[/C][C]0.048[/C][C]0.480914[/C][/ROW]
[ROW][C]53[/C][C]0.04344[/C][C]0.3582[/C][C]0.360645[/C][/ROW]
[ROW][C]54[/C][C]0.113209[/C][C]0.9335[/C][C]0.176921[/C][/ROW]
[ROW][C]55[/C][C]0.036958[/C][C]0.3048[/C][C]0.380739[/C][/ROW]
[ROW][C]56[/C][C]-0.052884[/C][C]-0.4361[/C][C]0.332074[/C][/ROW]
[ROW][C]57[/C][C]0.043482[/C][C]0.3586[/C][C]0.360518[/C][/ROW]
[ROW][C]58[/C][C]-0.008371[/C][C]-0.069[/C][C]0.472584[/C][/ROW]
[ROW][C]59[/C][C]0.006309[/C][C]0.052[/C][C]0.47933[/C][/ROW]
[ROW][C]60[/C][C]0.120236[/C][C]0.9915[/C][C]0.16248[/C][/ROW]
[/TABLE]
Source: https://freestatistics.org/blog/index.php?pk=106062&T=1

Globally Unique Identifier (entire table): ba.freestatistics.org/blog/index.php?pk=106062&T=1

As an alternative you can also use a QR Code:  

The GUIDs for individual cells are displayed in the table below:

Autocorrelation Function
Time lag kACF(k)T-STATP-value
10.266612.19850.015659
20.0336530.27750.391116
30.1976551.62990.053873
40.1211190.99880.160723
50.3597112.96630.002078
60.4195113.45940.00047
70.2702822.22880.014568
80.0829960.68440.248024
90.0461170.38030.352459
10-0.131488-1.08430.141035
110.102520.84540.200426
120.5303724.37362.1e-05
130.0248330.20480.419179
14-0.202743-1.67190.049574
15-0.143557-1.18380.120306
16-0.099368-0.81940.207708
170.0822060.67790.250071
180.0601750.49620.31067
19-0.016043-0.13230.447572
20-0.175017-1.44320.076773
21-0.206658-1.70410.04646
22-0.276339-2.27880.012914
23-0.100819-0.83140.204337
240.1812831.49490.069784
25-0.128167-1.05690.14715
26-0.312456-2.57660.006077
27-0.283703-2.33950.011128
28-0.138009-1.13810.129546
29-0.036233-0.29880.383008
30-0.070689-0.58290.280938
31-0.057706-0.47590.317852
32-0.224853-1.85420.034025
33-0.219597-1.81080.037291
34-0.176644-1.45660.074908
35-0.149115-1.22960.111536
360.1542171.27170.103904
37-0.095226-0.78530.217517
38-0.273837-2.25810.013576
39-0.133966-1.10470.136588
40-0.088201-0.72730.234763
41-0.01611-0.13280.447353
420.0672530.55460.2905
43-0.009913-0.08170.467544
44-0.146199-1.20560.116077
45-0.018915-0.1560.438257
46-0.047383-0.39070.34861
47-0.034024-0.28060.389946
480.2069941.70690.0462
490.0138010.11380.454863
50-0.085483-0.70490.241637
510.0197630.1630.435514
520.0058250.0480.480914
530.043440.35820.360645
540.1132090.93350.176921
550.0369580.30480.380739
56-0.052884-0.43610.332074
570.0434820.35860.360518
58-0.008371-0.0690.472584
590.0063090.0520.47933
600.1202360.99150.16248


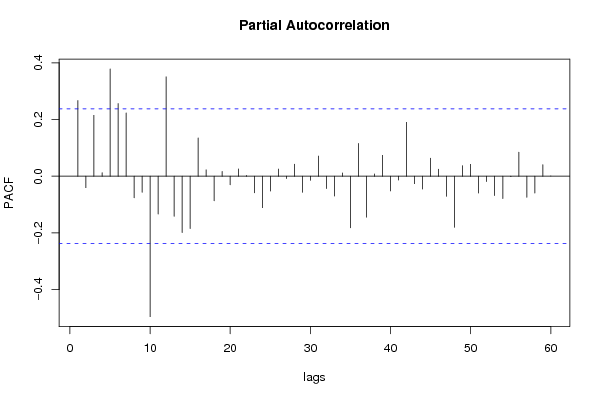
Partial Autocorrelation Function
Time lag kPACF(k)T-STATP-value
10.266612.19850.015659
2-0.040292-0.33230.370359
30.2146451.770.040604
40.012120.09990.460341
50.3782023.11870.001332
60.2560462.11140.019208
70.2232921.84130.034969
8-0.075838-0.62540.26691
9-0.056518-0.46610.321332
10-0.495224-4.08376e-05
11-0.133528-1.10110.137368
120.350312.88870.002592
13-0.141596-1.16760.123518
14-0.198656-1.63820.053004
15-0.184667-1.52280.066222
160.1349881.11310.134784
170.0223640.18440.427118
18-0.086967-0.71710.23787
190.0168160.13870.445063
20-0.030566-0.25210.400881
210.0257530.21240.416228
220.0026170.02160.491422
23-0.058297-0.48070.316127
24-0.110851-0.91410.181948
25-0.052287-0.43120.333855
260.0251580.20750.418135
27-0.008512-0.07020.472122
280.041990.34630.365108
29-0.056525-0.46610.32131
30-0.014046-0.11580.454065
310.0708940.58460.280374
32-0.043242-0.35660.361253
33-0.070218-0.5790.282239
340.0115980.09560.462043
35-0.181805-1.49920.069225
360.1151420.94950.172869
37-0.144424-1.19090.118907
380.0076970.06350.474789
390.0735520.60650.273093
40-0.051741-0.42670.335485
41-0.013747-0.11340.45504
420.1898451.56550.061054
43-0.026228-0.21630.414709
44-0.045246-0.37310.355116
450.0631410.52070.302143
460.0243710.2010.420661
47-0.071105-0.58630.279793
48-0.18-1.48430.071173
490.0372070.30680.379962
500.0419260.34570.365307
51-0.059112-0.48740.313755
52-0.018868-0.15560.438408
53-0.068393-0.5640.287311
54-0.07875-0.64940.259136
55-0.001522-0.01260.495011
560.0847840.69910.243422
57-0.074192-0.61180.271355
58-0.059413-0.48990.31288
590.0404220.33330.369955
600.0002130.00180.499301

\begin{tabular}{lllllllll}
\hline
Partial Autocorrelation Function \tabularnewline
Time lag k & PACF(k) & T-STAT & P-value \tabularnewline
1 & 0.26661 & 2.1985 & 0.015659 \tabularnewline
2 & -0.040292 & -0.3323 & 0.370359 \tabularnewline
3 & 0.214645 & 1.77 & 0.040604 \tabularnewline
4 & 0.01212 & 0.0999 & 0.460341 \tabularnewline
5 & 0.378202 & 3.1187 & 0.001332 \tabularnewline
6 & 0.256046 & 2.1114 & 0.019208 \tabularnewline
7 & 0.223292 & 1.8413 & 0.034969 \tabularnewline
8 & -0.075838 & -0.6254 & 0.26691 \tabularnewline
9 & -0.056518 & -0.4661 & 0.321332 \tabularnewline
10 & -0.495224 & -4.0837 & 6e-05 \tabularnewline
11 & -0.133528 & -1.1011 & 0.137368 \tabularnewline
12 & 0.35031 & 2.8887 & 0.002592 \tabularnewline
13 & -0.141596 & -1.1676 & 0.123518 \tabularnewline
14 & -0.198656 & -1.6382 & 0.053004 \tabularnewline
15 & -0.184667 & -1.5228 & 0.066222 \tabularnewline
16 & 0.134988 & 1.1131 & 0.134784 \tabularnewline
17 & 0.022364 & 0.1844 & 0.427118 \tabularnewline
18 & -0.086967 & -0.7171 & 0.23787 \tabularnewline
19 & 0.016816 & 0.1387 & 0.445063 \tabularnewline
20 & -0.030566 & -0.2521 & 0.400881 \tabularnewline
21 & 0.025753 & 0.2124 & 0.416228 \tabularnewline
22 & 0.002617 & 0.0216 & 0.491422 \tabularnewline
23 & -0.058297 & -0.4807 & 0.316127 \tabularnewline
24 & -0.110851 & -0.9141 & 0.181948 \tabularnewline
25 & -0.052287 & -0.4312 & 0.333855 \tabularnewline
26 & 0.025158 & 0.2075 & 0.418135 \tabularnewline
27 & -0.008512 & -0.0702 & 0.472122 \tabularnewline
28 & 0.04199 & 0.3463 & 0.365108 \tabularnewline
29 & -0.056525 & -0.4661 & 0.32131 \tabularnewline
30 & -0.014046 & -0.1158 & 0.454065 \tabularnewline
31 & 0.070894 & 0.5846 & 0.280374 \tabularnewline
32 & -0.043242 & -0.3566 & 0.361253 \tabularnewline
33 & -0.070218 & -0.579 & 0.282239 \tabularnewline
34 & 0.011598 & 0.0956 & 0.462043 \tabularnewline
35 & -0.181805 & -1.4992 & 0.069225 \tabularnewline
36 & 0.115142 & 0.9495 & 0.172869 \tabularnewline
37 & -0.144424 & -1.1909 & 0.118907 \tabularnewline
38 & 0.007697 & 0.0635 & 0.474789 \tabularnewline
39 & 0.073552 & 0.6065 & 0.273093 \tabularnewline
40 & -0.051741 & -0.4267 & 0.335485 \tabularnewline
41 & -0.013747 & -0.1134 & 0.45504 \tabularnewline
42 & 0.189845 & 1.5655 & 0.061054 \tabularnewline
43 & -0.026228 & -0.2163 & 0.414709 \tabularnewline
44 & -0.045246 & -0.3731 & 0.355116 \tabularnewline
45 & 0.063141 & 0.5207 & 0.302143 \tabularnewline
46 & 0.024371 & 0.201 & 0.420661 \tabularnewline
47 & -0.071105 & -0.5863 & 0.279793 \tabularnewline
48 & -0.18 & -1.4843 & 0.071173 \tabularnewline
49 & 0.037207 & 0.3068 & 0.379962 \tabularnewline
50 & 0.041926 & 0.3457 & 0.365307 \tabularnewline
51 & -0.059112 & -0.4874 & 0.313755 \tabularnewline
52 & -0.018868 & -0.1556 & 0.438408 \tabularnewline
53 & -0.068393 & -0.564 & 0.287311 \tabularnewline
54 & -0.07875 & -0.6494 & 0.259136 \tabularnewline
55 & -0.001522 & -0.0126 & 0.495011 \tabularnewline
56 & 0.084784 & 0.6991 & 0.243422 \tabularnewline
57 & -0.074192 & -0.6118 & 0.271355 \tabularnewline
58 & -0.059413 & -0.4899 & 0.31288 \tabularnewline
59 & 0.040422 & 0.3333 & 0.369955 \tabularnewline
60 & 0.000213 & 0.0018 & 0.499301 \tabularnewline
\hline
\end{tabular}
%Source: https://freestatistics.org/blog/index.php?pk=106062&T=2

[TABLE]
[ROW][C]Partial Autocorrelation Function[/C][/ROW]
[ROW][C]Time lag k[/C][C]PACF(k)[/C][C]T-STAT[/C][C]P-value[/C][/ROW]
[ROW][C]1[/C][C]0.26661[/C][C]2.1985[/C][C]0.015659[/C][/ROW]
[ROW][C]2[/C][C]-0.040292[/C][C]-0.3323[/C][C]0.370359[/C][/ROW]
[ROW][C]3[/C][C]0.214645[/C][C]1.77[/C][C]0.040604[/C][/ROW]
[ROW][C]4[/C][C]0.01212[/C][C]0.0999[/C][C]0.460341[/C][/ROW]
[ROW][C]5[/C][C]0.378202[/C][C]3.1187[/C][C]0.001332[/C][/ROW]
[ROW][C]6[/C][C]0.256046[/C][C]2.1114[/C][C]0.019208[/C][/ROW]
[ROW][C]7[/C][C]0.223292[/C][C]1.8413[/C][C]0.034969[/C][/ROW]
[ROW][C]8[/C][C]-0.075838[/C][C]-0.6254[/C][C]0.26691[/C][/ROW]
[ROW][C]9[/C][C]-0.056518[/C][C]-0.4661[/C][C]0.321332[/C][/ROW]
[ROW][C]10[/C][C]-0.495224[/C][C]-4.0837[/C][C]6e-05[/C][/ROW]
[ROW][C]11[/C][C]-0.133528[/C][C]-1.1011[/C][C]0.137368[/C][/ROW]
[ROW][C]12[/C][C]0.35031[/C][C]2.8887[/C][C]0.002592[/C][/ROW]
[ROW][C]13[/C][C]-0.141596[/C][C]-1.1676[/C][C]0.123518[/C][/ROW]
[ROW][C]14[/C][C]-0.198656[/C][C]-1.6382[/C][C]0.053004[/C][/ROW]
[ROW][C]15[/C][C]-0.184667[/C][C]-1.5228[/C][C]0.066222[/C][/ROW]
[ROW][C]16[/C][C]0.134988[/C][C]1.1131[/C][C]0.134784[/C][/ROW]
[ROW][C]17[/C][C]0.022364[/C][C]0.1844[/C][C]0.427118[/C][/ROW]
[ROW][C]18[/C][C]-0.086967[/C][C]-0.7171[/C][C]0.23787[/C][/ROW]
[ROW][C]19[/C][C]0.016816[/C][C]0.1387[/C][C]0.445063[/C][/ROW]
[ROW][C]20[/C][C]-0.030566[/C][C]-0.2521[/C][C]0.400881[/C][/ROW]
[ROW][C]21[/C][C]0.025753[/C][C]0.2124[/C][C]0.416228[/C][/ROW]
[ROW][C]22[/C][C]0.002617[/C][C]0.0216[/C][C]0.491422[/C][/ROW]
[ROW][C]23[/C][C]-0.058297[/C][C]-0.4807[/C][C]0.316127[/C][/ROW]
[ROW][C]24[/C][C]-0.110851[/C][C]-0.9141[/C][C]0.181948[/C][/ROW]
[ROW][C]25[/C][C]-0.052287[/C][C]-0.4312[/C][C]0.333855[/C][/ROW]
[ROW][C]26[/C][C]0.025158[/C][C]0.2075[/C][C]0.418135[/C][/ROW]
[ROW][C]27[/C][C]-0.008512[/C][C]-0.0702[/C][C]0.472122[/C][/ROW]
[ROW][C]28[/C][C]0.04199[/C][C]0.3463[/C][C]0.365108[/C][/ROW]
[ROW][C]29[/C][C]-0.056525[/C][C]-0.4661[/C][C]0.32131[/C][/ROW]
[ROW][C]30[/C][C]-0.014046[/C][C]-0.1158[/C][C]0.454065[/C][/ROW]
[ROW][C]31[/C][C]0.070894[/C][C]0.5846[/C][C]0.280374[/C][/ROW]
[ROW][C]32[/C][C]-0.043242[/C][C]-0.3566[/C][C]0.361253[/C][/ROW]
[ROW][C]33[/C][C]-0.070218[/C][C]-0.579[/C][C]0.282239[/C][/ROW]
[ROW][C]34[/C][C]0.011598[/C][C]0.0956[/C][C]0.462043[/C][/ROW]
[ROW][C]35[/C][C]-0.181805[/C][C]-1.4992[/C][C]0.069225[/C][/ROW]
[ROW][C]36[/C][C]0.115142[/C][C]0.9495[/C][C]0.172869[/C][/ROW]
[ROW][C]37[/C][C]-0.144424[/C][C]-1.1909[/C][C]0.118907[/C][/ROW]
[ROW][C]38[/C][C]0.007697[/C][C]0.0635[/C][C]0.474789[/C][/ROW]
[ROW][C]39[/C][C]0.073552[/C][C]0.6065[/C][C]0.273093[/C][/ROW]
[ROW][C]40[/C][C]-0.051741[/C][C]-0.4267[/C][C]0.335485[/C][/ROW]
[ROW][C]41[/C][C]-0.013747[/C][C]-0.1134[/C][C]0.45504[/C][/ROW]
[ROW][C]42[/C][C]0.189845[/C][C]1.5655[/C][C]0.061054[/C][/ROW]
[ROW][C]43[/C][C]-0.026228[/C][C]-0.2163[/C][C]0.414709[/C][/ROW]
[ROW][C]44[/C][C]-0.045246[/C][C]-0.3731[/C][C]0.355116[/C][/ROW]
[ROW][C]45[/C][C]0.063141[/C][C]0.5207[/C][C]0.302143[/C][/ROW]
[ROW][C]46[/C][C]0.024371[/C][C]0.201[/C][C]0.420661[/C][/ROW]
[ROW][C]47[/C][C]-0.071105[/C][C]-0.5863[/C][C]0.279793[/C][/ROW]
[ROW][C]48[/C][C]-0.18[/C][C]-1.4843[/C][C]0.071173[/C][/ROW]
[ROW][C]49[/C][C]0.037207[/C][C]0.3068[/C][C]0.379962[/C][/ROW]
[ROW][C]50[/C][C]0.041926[/C][C]0.3457[/C][C]0.365307[/C][/ROW]
[ROW][C]51[/C][C]-0.059112[/C][C]-0.4874[/C][C]0.313755[/C][/ROW]
[ROW][C]52[/C][C]-0.018868[/C][C]-0.1556[/C][C]0.438408[/C][/ROW]
[ROW][C]53[/C][C]-0.068393[/C][C]-0.564[/C][C]0.287311[/C][/ROW]
[ROW][C]54[/C][C]-0.07875[/C][C]-0.6494[/C][C]0.259136[/C][/ROW]
[ROW][C]55[/C][C]-0.001522[/C][C]-0.0126[/C][C]0.495011[/C][/ROW]
[ROW][C]56[/C][C]0.084784[/C][C]0.6991[/C][C]0.243422[/C][/ROW]
[ROW][C]57[/C][C]-0.074192[/C][C]-0.6118[/C][C]0.271355[/C][/ROW]
[ROW][C]58[/C][C]-0.059413[/C][C]-0.4899[/C][C]0.31288[/C][/ROW]
[ROW][C]59[/C][C]0.040422[/C][C]0.3333[/C][C]0.369955[/C][/ROW]
[ROW][C]60[/C][C]0.000213[/C][C]0.0018[/C][C]0.499301[/C][/ROW]
[/TABLE]
Source: https://freestatistics.org/blog/index.php?pk=106062&T=2

Globally Unique Identifier (entire table): ba.freestatistics.org/blog/index.php?pk=106062&T=2

As an alternative you can also use a QR Code:  

The GUIDs for individual cells are displayed in the table below:

Partial Autocorrelation Function
Time lag kPACF(k)T-STATP-value
10.266612.19850.015659
2-0.040292-0.33230.370359
30.2146451.770.040604
40.012120.09990.460341
50.3782023.11870.001332
60.2560462.11140.019208
70.2232921.84130.034969
8-0.075838-0.62540.26691
9-0.056518-0.46610.321332
10-0.495224-4.08376e-05
11-0.133528-1.10110.137368
120.350312.88870.002592
13-0.141596-1.16760.123518
14-0.198656-1.63820.053004
15-0.184667-1.52280.066222
160.1349881.11310.134784
170.0223640.18440.427118
18-0.086967-0.71710.23787
190.0168160.13870.445063
20-0.030566-0.25210.400881
210.0257530.21240.416228
220.0026170.02160.491422
23-0.058297-0.48070.316127
24-0.110851-0.91410.181948
25-0.052287-0.43120.333855
260.0251580.20750.418135
27-0.008512-0.07020.472122
280.041990.34630.365108
29-0.056525-0.46610.32131
30-0.014046-0.11580.454065
310.0708940.58460.280374
32-0.043242-0.35660.361253
33-0.070218-0.5790.282239
340.0115980.09560.462043
35-0.181805-1.49920.069225
360.1151420.94950.172869
37-0.144424-1.19090.118907
380.0076970.06350.474789
390.0735520.60650.273093
40-0.051741-0.42670.335485
41-0.013747-0.11340.45504
420.1898451.56550.061054
43-0.026228-0.21630.414709
44-0.045246-0.37310.355116
450.0631410.52070.302143
460.0243710.2010.420661
47-0.071105-0.58630.279793
48-0.18-1.48430.071173
490.0372070.30680.379962
500.0419260.34570.365307
51-0.059112-0.48740.313755
52-0.018868-0.15560.438408
53-0.068393-0.5640.287311
54-0.07875-0.64940.259136
55-0.001522-0.01260.495011
560.0847840.69910.243422
57-0.074192-0.61180.271355
58-0.059413-0.48990.31288
590.0404220.33330.369955
600.0002130.00180.499301


Parameters (Session):
par1 = 60 ; par2 = 1 ; par3 = 0 ; par4 = 0 ; par5 = 12 ; par6 = White Noise ; par7 = 0.95 ;
Parameters (R input):
par1 = 60 ; par2 = 1 ; par3 = 0 ; par4 = 0 ; par5 = 12 ; par6 = White Noise ; par7 = 0.95 ;
R code (references can be found in the software module):
if (par1 == 'Default') {
par1 = 10*log10(length(x))
} else {
par1 <- as.numeric(par1)
}
par2 <- as.numeric(par2)
par3 <- as.numeric(par3)
par4 <- as.numeric(par4)
par5 <- as.numeric(par5)
if (par6 == 'White Noise') par6 <- 'white' else par6 <- 'ma'
par7 <- as.numeric(par7)
if (par2 == 0) {
x <- log(x)
} else {
x <- (x ^ par2 - 1) / par2
}
if (par3 > 0) x <- diff(x,lag=1,difference=par3)
if (par4 > 0) x <- diff(x,lag=par5,difference=par4)
bitmap(file='pic1.png')
racf <- acf(x, par1, main='Autocorrelation', xlab='time lag', ylab='ACF', ci.type=par6, ci=par7, sub=paste('(lambda=',par2,', d=',par3,', D=',par4,', CI=', par7, ', CI type=',par6,')',sep=''))
dev.off()
bitmap(file='pic2.png')
rpacf <- pacf(x,par1,main='Partial Autocorrelation',xlab='lags',ylab='PACF')
dev.off()
(myacf <- c(racf$acf))
(mypacf <- c(rpacf$acf))
lengthx <- length(x)
sqrtn <- sqrt(lengthx)
load(file='createtable')
a<-table.start()
a<-table.row.start(a)
a<-table.element(a,'Autocorrelation Function',4,TRUE)
a<-table.row.end(a)
a<-table.row.start(a)
a<-table.element(a,'Time lag k',header=TRUE)
a<-table.element(a,hyperlink('basics.htm','ACF(k)','click here for more information about the Autocorrelation Function'),header=TRUE)
a<-table.element(a,'T-STAT',header=TRUE)
a<-table.element(a,'P-value',header=TRUE)
a<-table.row.end(a)
for (i in 2:(par1+1)) {
a<-table.row.start(a)
a<-table.element(a,i-1,header=TRUE)
a<-table.element(a,round(myacf[i],6))
mytstat <- myacf[i]*sqrtn
a<-table.element(a,round(mytstat,4))
a<-table.element(a,round(1-pt(abs(mytstat),lengthx),6))
a<-table.row.end(a)
}
a<-table.end(a)
table.save(a,file='mytable.tab')
a<-table.start()
a<-table.row.start(a)
a<-table.element(a,'Partial Autocorrelation Function',4,TRUE)
a<-table.row.end(a)
a<-table.row.start(a)
a<-table.element(a,'Time lag k',header=TRUE)
a<-table.element(a,hyperlink('basics.htm','PACF(k)','click here for more information about the Partial Autocorrelation Function'),header=TRUE)
a<-table.element(a,'T-STAT',header=TRUE)
a<-table.element(a,'P-value',header=TRUE)
a<-table.row.end(a)
for (i in 1:par1) {
a<-table.row.start(a)
a<-table.element(a,i,header=TRUE)
a<-table.element(a,round(mypacf[i],6))
mytstat <- mypacf[i]*sqrtn
a<-table.element(a,round(mytstat,4))
a<-table.element(a,round(1-pt(abs(mytstat),lengthx),6))
a<-table.row.end(a)
}
a<-table.end(a)
table.save(a,file='mytable1.tab')