Free Statistics

of Irreproducible Research!

Author's title

Author*The author of this computation has been verified*
R Software Modulerwasp_pairs.wasp
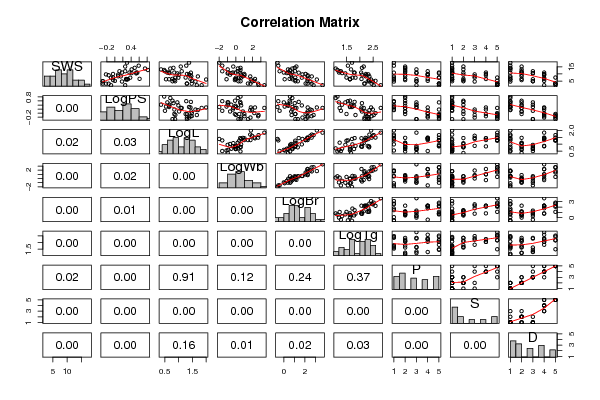
Title produced by softwareKendall tau Correlation Matrix
Date of computationMon, 06 Dec 2010 21:29:07 +0000
Cite this page as followsStatistical Computations at FreeStatistics.org, Office for Research Development and Education, URL https://freestatistics.org/blog/index.php?v=date/2010/Dec/06/t1291670954yg0jxg4gvqkpim6.htm/, Retrieved Sun, 28 Apr 2024 23:51:30 +0000
Statistical Computations at FreeStatistics.org, Office for Research Development and Education, URL https://freestatistics.org/blog/index.php?pk=105914, Retrieved Sun, 28 Apr 2024 23:51:30 +0000
QR Codes:

Original text written by user:
IsPrivate?No (this computation is public)
User-defined keywords
Estimated Impact131
Family? (F = Feedback message, R = changed R code, M = changed R Module, P = changed Parameters, D = changed Data)
-       [Kendall tau Correlation Matrix] [correlatie science] [2010-12-06 21:29:07] [9ea95e194e0eb2a674315798620d5bc6] [Current]
- R  D    [Kendall tau Correlation Matrix] [] [2010-12-14 23:58:41] [5b5e2f42cf221276958b46f2b8444c18]
- RMPD      [Multiple Regression] [] [2010-12-15 00:38:23] [5b5e2f42cf221276958b46f2b8444c18]
-    D        [Multiple Regression] [] [2010-12-15 00:54:32] [5b5e2f42cf221276958b46f2b8444c18]
Feedback Forum

Post a new message
Dataseries X:
6,3	0,301029996	0,653212514	0	0,819543936	1,62324929	3	1	3
2,1	0,255272505	1,838849091	3,406028945	3,663040975	2,79518459	3	5	4
9,1	-0,15490196	1,431363764	1,02325246	2,254064453	2,255272505	4	4	4
15,8	0,591064607	1,278753601	-1,638272164	-0,522878745	1,544068044	1	1	1
5,2	0	1,482873584	2,204119983	2,227886705	2,593286067	4	5	4
10,9	0,556302501	1,447158031	0,51851394	1,408239965	1,799340549	1	2	1
8,3	0,146128036	1,698970004	1,717337583	2,643452676	2,361727836	1	1	1
11	0,176091259	0,84509804	-0,37161107	0,806179974	2,049218023	5	4	4
3,2	-0,15490196	1,477121255	2,667452953	2,626340367	2,44870632	5	5	5
6,3	0,322219295	0,544068044	-1,124938737	0,079181246	1,62324929	1	1	1
6,6	0,612783857	0,77815125	-0,105130343	0,544068044	1,62324929	2	2	2
9,5	0,079181246	1,017033339	-0,698970004	0,698970004	2,079181246	2	2	2
3,3	-0,301029996	1,301029996	1,441852176	2,06069784	2,170261715	5	5	5
11	0,531478917	0,591064607	-0,920818754	0	1,204119983	3	1	2
4,7	0,176091259	1,612783857	1,929418926	2,511883361	2,491361694	1	3	1
10,4	0,531478917	0,954242509	-0,995678626	0,602059991	1,447158031	5	1	3
7,4	-0,096910013	0,880813592	0,017033339	0,740362689	1,832508913	5	3	4
2,1	-0,096910013	1,662757832	2,716837723	2,8162413	2,526339277	5	5	5
17,9	0,301029996	1,380211242	-2	-0,602059991	1,698970004	1	1	1
6,1	0,278753601	2	1,792391689	3,120573931	2,426511261	1	1	1
11,9	0,113943352	0,505149978	-1,638272164	-0,397940009	1,278753601	4	1	3
13,8	0,748188027	0,698970004	0,230448921	0,799340549	1,079181246	2	1	1
14,3	0,491361694	0,812913357	0,544068044	1,033423755	2,079181246	2	1	1
15,2	0,255272505	1,079181246	-0,318758763	1,190331698	2,146128036	2	2	2
10	-0,045757491	1,305351369	1	2,06069784	2,230448921	4	4	4
11,9	0,255272505	1,113943352	0,209515015	1,056904851	1,230448921	2	1	2
6,5	0,278753601	1,431363764	2,283301229	2,255272505	2,06069784	4	4	4
7,5	-0,045757491	1,255272505	0,397940009	1,08278537	1,491361694	5	5	5
10,6	0,414973348	0,672097858	-0,552841969	0,278753601	1,322219295	3	1	3
7,4	0,380211242	0,991226076	0,626853415	1,702430536	1,716003344	1	1	1
8,4	0,079181246	1,462397998	0,832508913	2,252853031	2,214843848	2	3	2
5,7	-0,045757491	0,84509804	-0,124938737	1,089905111	2,352182518	2	2	2
4,9	-0,301029996	0,77815125	0,556302501	1,322219295	2,352182518	3	2	3
3,2	-0,22184875	1,301029996	1,744292983	2,243038049	2,178976947	5	5	5
11	0,361727836	0,653212514	-0,045757491	0,414973348	1,77815125	2	1	2
4,9	-0,301029996	0,875061263	0,301029996	1,089905111	2,301029996	3	1	3
13,2	0,414973348	0,361727836	-0,982966661	0,397940009	1,662757832	3	2	2
9,7	-0,22184875	1,380211242	0,622214023	1,763427994	2,322219295	4	3	4
12,8	0,819543936	0,477121255	0,544068044	0,591064607	1,146128036	2	1	1


Summary of computational transaction
Raw Inputview raw input (R code)
Raw Outputview raw output of R engine
Computing time2 seconds
R Server'RServer@AstonUniversity' @ vre.aston.ac.uk

\begin{tabular}{lllllllll}
\hline
Summary of computational transaction \tabularnewline
Raw Input & view raw input (R code)  \tabularnewline
Raw Output & view raw output of R engine  \tabularnewline
Computing time & 2 seconds \tabularnewline
R Server & 'RServer@AstonUniversity' @ vre.aston.ac.uk \tabularnewline
\hline
\end{tabular}
%Source: https://freestatistics.org/blog/index.php?pk=105914&T=0

[TABLE]
[ROW][C]Summary of computational transaction[/C][/ROW]
[ROW][C]Raw Input[/C][C]view raw input (R code) [/C][/ROW]
[ROW][C]Raw Output[/C][C]view raw output of R engine [/C][/ROW]
[ROW][C]Computing time[/C][C]2 seconds[/C][/ROW]
[ROW][C]R Server[/C][C]'RServer@AstonUniversity' @ vre.aston.ac.uk[/C][/ROW]
[/TABLE]
Source: https://freestatistics.org/blog/index.php?pk=105914&T=0

Globally Unique Identifier (entire table): ba.freestatistics.org/blog/index.php?pk=105914&T=0

As an alternative you can also use a QR Code:  

The GUIDs for individual cells are displayed in the table below:

Summary of computational transaction
Raw Inputview raw input (R code)
Raw Outputview raw output of R engine
Computing time2 seconds
R Server'RServer@AstonUniversity' @ vre.aston.ac.uk


Correlations for all pairs of data series (method=pearson)
SWSLogPSLogLLogWbLogBrLogTgPSD
SWS10.582-0.378-0.712-0.679-0.601-0.369-0.58-0.542
LogPS0.5821-0.346-0.372-0.438-0.646-0.534-0.591-0.684
LogL-0.378-0.34610.6850.7770.6790.0190.5190.227
LogWb-0.712-0.3720.68510.9450.6950.2530.6620.432
LogBr-0.679-0.4380.7770.94510.7770.1920.6240.377
LogTg-0.601-0.6460.6790.6950.77710.1480.580.353
P-0.369-0.5340.0190.2530.1920.14810.680.93
S-0.58-0.5910.5190.6620.6240.580.6810.819
D-0.542-0.6840.2270.4320.3770.3530.930.8191

\begin{tabular}{lllllllll}
\hline
Correlations for all pairs of data series (method=pearson) \tabularnewline
  & SWS & LogPS & LogL & LogWb & LogBr & LogTg & P & S & D \tabularnewline
SWS & 1 & 0.582 & -0.378 & -0.712 & -0.679 & -0.601 & -0.369 & -0.58 & -0.542 \tabularnewline
LogPS & 0.582 & 1 & -0.346 & -0.372 & -0.438 & -0.646 & -0.534 & -0.591 & -0.684 \tabularnewline
LogL & -0.378 & -0.346 & 1 & 0.685 & 0.777 & 0.679 & 0.019 & 0.519 & 0.227 \tabularnewline
LogWb & -0.712 & -0.372 & 0.685 & 1 & 0.945 & 0.695 & 0.253 & 0.662 & 0.432 \tabularnewline
LogBr & -0.679 & -0.438 & 0.777 & 0.945 & 1 & 0.777 & 0.192 & 0.624 & 0.377 \tabularnewline
LogTg & -0.601 & -0.646 & 0.679 & 0.695 & 0.777 & 1 & 0.148 & 0.58 & 0.353 \tabularnewline
P & -0.369 & -0.534 & 0.019 & 0.253 & 0.192 & 0.148 & 1 & 0.68 & 0.93 \tabularnewline
S & -0.58 & -0.591 & 0.519 & 0.662 & 0.624 & 0.58 & 0.68 & 1 & 0.819 \tabularnewline
D & -0.542 & -0.684 & 0.227 & 0.432 & 0.377 & 0.353 & 0.93 & 0.819 & 1 \tabularnewline
\hline
\end{tabular}
%Source: https://freestatistics.org/blog/index.php?pk=105914&T=1

[TABLE]
[ROW][C]Correlations for all pairs of data series (method=pearson)[/C][/ROW]
[ROW][C] [/C][C]SWS[/C][C]LogPS[/C][C]LogL[/C][C]LogWb[/C][C]LogBr[/C][C]LogTg[/C][C]P[/C][C]S[/C][C]D[/C][/ROW]
[ROW][C]SWS[/C][C]1[/C][C]0.582[/C][C]-0.378[/C][C]-0.712[/C][C]-0.679[/C][C]-0.601[/C][C]-0.369[/C][C]-0.58[/C][C]-0.542[/C][/ROW]
[ROW][C]LogPS[/C][C]0.582[/C][C]1[/C][C]-0.346[/C][C]-0.372[/C][C]-0.438[/C][C]-0.646[/C][C]-0.534[/C][C]-0.591[/C][C]-0.684[/C][/ROW]
[ROW][C]LogL[/C][C]-0.378[/C][C]-0.346[/C][C]1[/C][C]0.685[/C][C]0.777[/C][C]0.679[/C][C]0.019[/C][C]0.519[/C][C]0.227[/C][/ROW]
[ROW][C]LogWb[/C][C]-0.712[/C][C]-0.372[/C][C]0.685[/C][C]1[/C][C]0.945[/C][C]0.695[/C][C]0.253[/C][C]0.662[/C][C]0.432[/C][/ROW]
[ROW][C]LogBr[/C][C]-0.679[/C][C]-0.438[/C][C]0.777[/C][C]0.945[/C][C]1[/C][C]0.777[/C][C]0.192[/C][C]0.624[/C][C]0.377[/C][/ROW]
[ROW][C]LogTg[/C][C]-0.601[/C][C]-0.646[/C][C]0.679[/C][C]0.695[/C][C]0.777[/C][C]1[/C][C]0.148[/C][C]0.58[/C][C]0.353[/C][/ROW]
[ROW][C]P[/C][C]-0.369[/C][C]-0.534[/C][C]0.019[/C][C]0.253[/C][C]0.192[/C][C]0.148[/C][C]1[/C][C]0.68[/C][C]0.93[/C][/ROW]
[ROW][C]S[/C][C]-0.58[/C][C]-0.591[/C][C]0.519[/C][C]0.662[/C][C]0.624[/C][C]0.58[/C][C]0.68[/C][C]1[/C][C]0.819[/C][/ROW]
[ROW][C]D[/C][C]-0.542[/C][C]-0.684[/C][C]0.227[/C][C]0.432[/C][C]0.377[/C][C]0.353[/C][C]0.93[/C][C]0.819[/C][C]1[/C][/ROW]
[/TABLE]
Source: https://freestatistics.org/blog/index.php?pk=105914&T=1

Globally Unique Identifier (entire table): ba.freestatistics.org/blog/index.php?pk=105914&T=1

As an alternative you can also use a QR Code:  

The GUIDs for individual cells are displayed in the table below:

Correlations for all pairs of data series (method=pearson)
SWSLogPSLogLLogWbLogBrLogTgPSD
SWS10.582-0.378-0.712-0.679-0.601-0.369-0.58-0.542
LogPS0.5821-0.346-0.372-0.438-0.646-0.534-0.591-0.684
LogL-0.378-0.34610.6850.7770.6790.0190.5190.227
LogWb-0.712-0.3720.68510.9450.6950.2530.6620.432
LogBr-0.679-0.4380.7770.94510.7770.1920.6240.377
LogTg-0.601-0.6460.6790.6950.77710.1480.580.353
P-0.369-0.5340.0190.2530.1920.14810.680.93
S-0.58-0.5910.5190.6620.6240.580.6810.819
D-0.542-0.6840.2270.4320.3770.3530.930.8191


Correlations for all pairs of data series with p-values
pairPearson rSpearman rhoKendall tau
SWS;LogPS0.58160.59180.4165
p-value(1e-04)(1e-04)(2e-04)
SWS;LogL-0.3777-0.4282-0.2999
p-value(0.0178)(0.0065)(0.0077)
SWS;LogWb-0.7116-0.6585-0.4813
p-value(0)(0)(0)
SWS;LogBr-0.679-0.6599-0.4922
p-value(0)(0)(0)
SWS;LogTg-0.6014-0.6623-0.485
p-value(1e-04)(0)(0)
SWS;P-0.3689-0.3119-0.2421
p-value(0.0208)(0.0533)(0.0458)
SWS;S-0.5795-0.5491-0.4299
p-value(1e-04)(3e-04)(5e-04)
SWS;D-0.5422-0.4905-0.3888
p-value(4e-04)(0.0015)(0.0014)
LogPS;LogL-0.3459-0.3893-0.2373
p-value(0.031)(0.0143)(0.036)
LogPS;LogWb-0.3719-0.4395-0.2777
p-value(0.0197)(0.0051)(0.0139)
LogPS;LogBr-0.4378-0.5242-0.3242
p-value(0.0053)(6e-04)(0.0041)
LogPS;LogTg-0.6455-0.6521-0.4606
p-value(0)(0)(0)
LogPS;P-0.5341-0.5339-0.3919
p-value(5e-04)(5e-04)(0.0013)
LogPS;S-0.5914-0.6156-0.4706
p-value(1e-04)(0)(1e-04)
LogPS;D-0.6844-0.6808-0.5266
p-value(0)(0)(0)
LogL;LogWb0.68480.70630.5251
p-value(0)(0)(0)
LogL;LogBr0.77660.80330.6499
p-value(0)(0)(0)
LogL;LogTg0.67920.71150.533
p-value(0)(0)(0)
LogL;P0.01950.0122-0.006
p-value(0.9064)(0.9412)(0.9604)
LogL;S0.51870.52420.4101
p-value(7e-04)(6e-04)(9e-04)
LogL;D0.22740.20720.1615
p-value(0.1638)(0.2057)(0.1831)
LogWb;LogBr0.94460.92840.7916
p-value(0)(0)(0)
LogWb;LogTg0.69490.70950.5207
p-value(0)(0)(0)
LogWb;P0.25290.21470.1602
p-value(0.1204)(0.1893)(0.1846)
LogWb;S0.66240.59540.4811
p-value(0)(1e-04)(1e-04)
LogWb;D0.43210.36150.274
p-value(0.006)(0.0238)(0.0236)
LogBr;LogTg0.77750.80820.5993
p-value(0)(0)(0)
LogBr;P0.19170.16750.1257
p-value(0.2424)(0.3082)(0.2976)
LogBr;S0.62360.59760.4905
p-value(0)(1e-04)(1e-04)
LogBr;D0.37680.34140.2695
p-value(0.0181)(0.0334)(0.026)
LogTg;P0.14810.11620.075
p-value(0.3682)(0.4813)(0.5352)
LogTg;S0.58020.57710.4617
p-value(1e-04)(1e-04)(2e-04)
LogTg;D0.35340.31150.2293
p-value(0.0273)(0.0535)(0.0586)
P;S0.680.61860.5218
p-value(0)(0)(1e-04)
P;D0.93030.93280.876
p-value(0)(0)(0)
S;D0.81920.75330.6591
p-value(0)(0)(0)

\begin{tabular}{lllllllll}
\hline
Correlations for all pairs of data series with p-values \tabularnewline
pair & Pearson r & Spearman rho & Kendall tau \tabularnewline
SWS;LogPS & 0.5816 & 0.5918 & 0.4165 \tabularnewline
p-value & (1e-04) & (1e-04) & (2e-04) \tabularnewline
SWS;LogL & -0.3777 & -0.4282 & -0.2999 \tabularnewline
p-value & (0.0178) & (0.0065) & (0.0077) \tabularnewline
SWS;LogWb & -0.7116 & -0.6585 & -0.4813 \tabularnewline
p-value & (0) & (0) & (0) \tabularnewline
SWS;LogBr & -0.679 & -0.6599 & -0.4922 \tabularnewline
p-value & (0) & (0) & (0) \tabularnewline
SWS;LogTg & -0.6014 & -0.6623 & -0.485 \tabularnewline
p-value & (1e-04) & (0) & (0) \tabularnewline
SWS;P & -0.3689 & -0.3119 & -0.2421 \tabularnewline
p-value & (0.0208) & (0.0533) & (0.0458) \tabularnewline
SWS;S & -0.5795 & -0.5491 & -0.4299 \tabularnewline
p-value & (1e-04) & (3e-04) & (5e-04) \tabularnewline
SWS;D & -0.5422 & -0.4905 & -0.3888 \tabularnewline
p-value & (4e-04) & (0.0015) & (0.0014) \tabularnewline
LogPS;LogL & -0.3459 & -0.3893 & -0.2373 \tabularnewline
p-value & (0.031) & (0.0143) & (0.036) \tabularnewline
LogPS;LogWb & -0.3719 & -0.4395 & -0.2777 \tabularnewline
p-value & (0.0197) & (0.0051) & (0.0139) \tabularnewline
LogPS;LogBr & -0.4378 & -0.5242 & -0.3242 \tabularnewline
p-value & (0.0053) & (6e-04) & (0.0041) \tabularnewline
LogPS;LogTg & -0.6455 & -0.6521 & -0.4606 \tabularnewline
p-value & (0) & (0) & (0) \tabularnewline
LogPS;P & -0.5341 & -0.5339 & -0.3919 \tabularnewline
p-value & (5e-04) & (5e-04) & (0.0013) \tabularnewline
LogPS;S & -0.5914 & -0.6156 & -0.4706 \tabularnewline
p-value & (1e-04) & (0) & (1e-04) \tabularnewline
LogPS;D & -0.6844 & -0.6808 & -0.5266 \tabularnewline
p-value & (0) & (0) & (0) \tabularnewline
LogL;LogWb & 0.6848 & 0.7063 & 0.5251 \tabularnewline
p-value & (0) & (0) & (0) \tabularnewline
LogL;LogBr & 0.7766 & 0.8033 & 0.6499 \tabularnewline
p-value & (0) & (0) & (0) \tabularnewline
LogL;LogTg & 0.6792 & 0.7115 & 0.533 \tabularnewline
p-value & (0) & (0) & (0) \tabularnewline
LogL;P & 0.0195 & 0.0122 & -0.006 \tabularnewline
p-value & (0.9064) & (0.9412) & (0.9604) \tabularnewline
LogL;S & 0.5187 & 0.5242 & 0.4101 \tabularnewline
p-value & (7e-04) & (6e-04) & (9e-04) \tabularnewline
LogL;D & 0.2274 & 0.2072 & 0.1615 \tabularnewline
p-value & (0.1638) & (0.2057) & (0.1831) \tabularnewline
LogWb;LogBr & 0.9446 & 0.9284 & 0.7916 \tabularnewline
p-value & (0) & (0) & (0) \tabularnewline
LogWb;LogTg & 0.6949 & 0.7095 & 0.5207 \tabularnewline
p-value & (0) & (0) & (0) \tabularnewline
LogWb;P & 0.2529 & 0.2147 & 0.1602 \tabularnewline
p-value & (0.1204) & (0.1893) & (0.1846) \tabularnewline
LogWb;S & 0.6624 & 0.5954 & 0.4811 \tabularnewline
p-value & (0) & (1e-04) & (1e-04) \tabularnewline
LogWb;D & 0.4321 & 0.3615 & 0.274 \tabularnewline
p-value & (0.006) & (0.0238) & (0.0236) \tabularnewline
LogBr;LogTg & 0.7775 & 0.8082 & 0.5993 \tabularnewline
p-value & (0) & (0) & (0) \tabularnewline
LogBr;P & 0.1917 & 0.1675 & 0.1257 \tabularnewline
p-value & (0.2424) & (0.3082) & (0.2976) \tabularnewline
LogBr;S & 0.6236 & 0.5976 & 0.4905 \tabularnewline
p-value & (0) & (1e-04) & (1e-04) \tabularnewline
LogBr;D & 0.3768 & 0.3414 & 0.2695 \tabularnewline
p-value & (0.0181) & (0.0334) & (0.026) \tabularnewline
LogTg;P & 0.1481 & 0.1162 & 0.075 \tabularnewline
p-value & (0.3682) & (0.4813) & (0.5352) \tabularnewline
LogTg;S & 0.5802 & 0.5771 & 0.4617 \tabularnewline
p-value & (1e-04) & (1e-04) & (2e-04) \tabularnewline
LogTg;D & 0.3534 & 0.3115 & 0.2293 \tabularnewline
p-value & (0.0273) & (0.0535) & (0.0586) \tabularnewline
P;S & 0.68 & 0.6186 & 0.5218 \tabularnewline
p-value & (0) & (0) & (1e-04) \tabularnewline
P;D & 0.9303 & 0.9328 & 0.876 \tabularnewline
p-value & (0) & (0) & (0) \tabularnewline
S;D & 0.8192 & 0.7533 & 0.6591 \tabularnewline
p-value & (0) & (0) & (0) \tabularnewline
\hline
\end{tabular}
%Source: https://freestatistics.org/blog/index.php?pk=105914&T=2

[TABLE]
[ROW][C]Correlations for all pairs of data series with p-values[/C][/ROW]
[ROW][C]pair[/C][C]Pearson r[/C][C]Spearman rho[/C][C]Kendall tau[/C][/ROW]
[ROW][C]SWS;LogPS[/C][C]0.5816[/C][C]0.5918[/C][C]0.4165[/C][/ROW]
[ROW][C]p-value[/C][C](1e-04)[/C][C](1e-04)[/C][C](2e-04)[/C][/ROW]
[ROW][C]SWS;LogL[/C][C]-0.3777[/C][C]-0.4282[/C][C]-0.2999[/C][/ROW]
[ROW][C]p-value[/C][C](0.0178)[/C][C](0.0065)[/C][C](0.0077)[/C][/ROW]
[ROW][C]SWS;LogWb[/C][C]-0.7116[/C][C]-0.6585[/C][C]-0.4813[/C][/ROW]
[ROW][C]p-value[/C][C](0)[/C][C](0)[/C][C](0)[/C][/ROW]
[ROW][C]SWS;LogBr[/C][C]-0.679[/C][C]-0.6599[/C][C]-0.4922[/C][/ROW]
[ROW][C]p-value[/C][C](0)[/C][C](0)[/C][C](0)[/C][/ROW]
[ROW][C]SWS;LogTg[/C][C]-0.6014[/C][C]-0.6623[/C][C]-0.485[/C][/ROW]
[ROW][C]p-value[/C][C](1e-04)[/C][C](0)[/C][C](0)[/C][/ROW]
[ROW][C]SWS;P[/C][C]-0.3689[/C][C]-0.3119[/C][C]-0.2421[/C][/ROW]
[ROW][C]p-value[/C][C](0.0208)[/C][C](0.0533)[/C][C](0.0458)[/C][/ROW]
[ROW][C]SWS;S[/C][C]-0.5795[/C][C]-0.5491[/C][C]-0.4299[/C][/ROW]
[ROW][C]p-value[/C][C](1e-04)[/C][C](3e-04)[/C][C](5e-04)[/C][/ROW]
[ROW][C]SWS;D[/C][C]-0.5422[/C][C]-0.4905[/C][C]-0.3888[/C][/ROW]
[ROW][C]p-value[/C][C](4e-04)[/C][C](0.0015)[/C][C](0.0014)[/C][/ROW]
[ROW][C]LogPS;LogL[/C][C]-0.3459[/C][C]-0.3893[/C][C]-0.2373[/C][/ROW]
[ROW][C]p-value[/C][C](0.031)[/C][C](0.0143)[/C][C](0.036)[/C][/ROW]
[ROW][C]LogPS;LogWb[/C][C]-0.3719[/C][C]-0.4395[/C][C]-0.2777[/C][/ROW]
[ROW][C]p-value[/C][C](0.0197)[/C][C](0.0051)[/C][C](0.0139)[/C][/ROW]
[ROW][C]LogPS;LogBr[/C][C]-0.4378[/C][C]-0.5242[/C][C]-0.3242[/C][/ROW]
[ROW][C]p-value[/C][C](0.0053)[/C][C](6e-04)[/C][C](0.0041)[/C][/ROW]
[ROW][C]LogPS;LogTg[/C][C]-0.6455[/C][C]-0.6521[/C][C]-0.4606[/C][/ROW]
[ROW][C]p-value[/C][C](0)[/C][C](0)[/C][C](0)[/C][/ROW]
[ROW][C]LogPS;P[/C][C]-0.5341[/C][C]-0.5339[/C][C]-0.3919[/C][/ROW]
[ROW][C]p-value[/C][C](5e-04)[/C][C](5e-04)[/C][C](0.0013)[/C][/ROW]
[ROW][C]LogPS;S[/C][C]-0.5914[/C][C]-0.6156[/C][C]-0.4706[/C][/ROW]
[ROW][C]p-value[/C][C](1e-04)[/C][C](0)[/C][C](1e-04)[/C][/ROW]
[ROW][C]LogPS;D[/C][C]-0.6844[/C][C]-0.6808[/C][C]-0.5266[/C][/ROW]
[ROW][C]p-value[/C][C](0)[/C][C](0)[/C][C](0)[/C][/ROW]
[ROW][C]LogL;LogWb[/C][C]0.6848[/C][C]0.7063[/C][C]0.5251[/C][/ROW]
[ROW][C]p-value[/C][C](0)[/C][C](0)[/C][C](0)[/C][/ROW]
[ROW][C]LogL;LogBr[/C][C]0.7766[/C][C]0.8033[/C][C]0.6499[/C][/ROW]
[ROW][C]p-value[/C][C](0)[/C][C](0)[/C][C](0)[/C][/ROW]
[ROW][C]LogL;LogTg[/C][C]0.6792[/C][C]0.7115[/C][C]0.533[/C][/ROW]
[ROW][C]p-value[/C][C](0)[/C][C](0)[/C][C](0)[/C][/ROW]
[ROW][C]LogL;P[/C][C]0.0195[/C][C]0.0122[/C][C]-0.006[/C][/ROW]
[ROW][C]p-value[/C][C](0.9064)[/C][C](0.9412)[/C][C](0.9604)[/C][/ROW]
[ROW][C]LogL;S[/C][C]0.5187[/C][C]0.5242[/C][C]0.4101[/C][/ROW]
[ROW][C]p-value[/C][C](7e-04)[/C][C](6e-04)[/C][C](9e-04)[/C][/ROW]
[ROW][C]LogL;D[/C][C]0.2274[/C][C]0.2072[/C][C]0.1615[/C][/ROW]
[ROW][C]p-value[/C][C](0.1638)[/C][C](0.2057)[/C][C](0.1831)[/C][/ROW]
[ROW][C]LogWb;LogBr[/C][C]0.9446[/C][C]0.9284[/C][C]0.7916[/C][/ROW]
[ROW][C]p-value[/C][C](0)[/C][C](0)[/C][C](0)[/C][/ROW]
[ROW][C]LogWb;LogTg[/C][C]0.6949[/C][C]0.7095[/C][C]0.5207[/C][/ROW]
[ROW][C]p-value[/C][C](0)[/C][C](0)[/C][C](0)[/C][/ROW]
[ROW][C]LogWb;P[/C][C]0.2529[/C][C]0.2147[/C][C]0.1602[/C][/ROW]
[ROW][C]p-value[/C][C](0.1204)[/C][C](0.1893)[/C][C](0.1846)[/C][/ROW]
[ROW][C]LogWb;S[/C][C]0.6624[/C][C]0.5954[/C][C]0.4811[/C][/ROW]
[ROW][C]p-value[/C][C](0)[/C][C](1e-04)[/C][C](1e-04)[/C][/ROW]
[ROW][C]LogWb;D[/C][C]0.4321[/C][C]0.3615[/C][C]0.274[/C][/ROW]
[ROW][C]p-value[/C][C](0.006)[/C][C](0.0238)[/C][C](0.0236)[/C][/ROW]
[ROW][C]LogBr;LogTg[/C][C]0.7775[/C][C]0.8082[/C][C]0.5993[/C][/ROW]
[ROW][C]p-value[/C][C](0)[/C][C](0)[/C][C](0)[/C][/ROW]
[ROW][C]LogBr;P[/C][C]0.1917[/C][C]0.1675[/C][C]0.1257[/C][/ROW]
[ROW][C]p-value[/C][C](0.2424)[/C][C](0.3082)[/C][C](0.2976)[/C][/ROW]
[ROW][C]LogBr;S[/C][C]0.6236[/C][C]0.5976[/C][C]0.4905[/C][/ROW]
[ROW][C]p-value[/C][C](0)[/C][C](1e-04)[/C][C](1e-04)[/C][/ROW]
[ROW][C]LogBr;D[/C][C]0.3768[/C][C]0.3414[/C][C]0.2695[/C][/ROW]
[ROW][C]p-value[/C][C](0.0181)[/C][C](0.0334)[/C][C](0.026)[/C][/ROW]
[ROW][C]LogTg;P[/C][C]0.1481[/C][C]0.1162[/C][C]0.075[/C][/ROW]
[ROW][C]p-value[/C][C](0.3682)[/C][C](0.4813)[/C][C](0.5352)[/C][/ROW]
[ROW][C]LogTg;S[/C][C]0.5802[/C][C]0.5771[/C][C]0.4617[/C][/ROW]
[ROW][C]p-value[/C][C](1e-04)[/C][C](1e-04)[/C][C](2e-04)[/C][/ROW]
[ROW][C]LogTg;D[/C][C]0.3534[/C][C]0.3115[/C][C]0.2293[/C][/ROW]
[ROW][C]p-value[/C][C](0.0273)[/C][C](0.0535)[/C][C](0.0586)[/C][/ROW]
[ROW][C]P;S[/C][C]0.68[/C][C]0.6186[/C][C]0.5218[/C][/ROW]
[ROW][C]p-value[/C][C](0)[/C][C](0)[/C][C](1e-04)[/C][/ROW]
[ROW][C]P;D[/C][C]0.9303[/C][C]0.9328[/C][C]0.876[/C][/ROW]
[ROW][C]p-value[/C][C](0)[/C][C](0)[/C][C](0)[/C][/ROW]
[ROW][C]S;D[/C][C]0.8192[/C][C]0.7533[/C][C]0.6591[/C][/ROW]
[ROW][C]p-value[/C][C](0)[/C][C](0)[/C][C](0)[/C][/ROW]
[/TABLE]
Source: https://freestatistics.org/blog/index.php?pk=105914&T=2

Globally Unique Identifier (entire table): ba.freestatistics.org/blog/index.php?pk=105914&T=2

As an alternative you can also use a QR Code:  

The GUIDs for individual cells are displayed in the table below:

Correlations for all pairs of data series with p-values
pairPearson rSpearman rhoKendall tau
SWS;LogPS0.58160.59180.4165
p-value(1e-04)(1e-04)(2e-04)
SWS;LogL-0.3777-0.4282-0.2999
p-value(0.0178)(0.0065)(0.0077)
SWS;LogWb-0.7116-0.6585-0.4813
p-value(0)(0)(0)
SWS;LogBr-0.679-0.6599-0.4922
p-value(0)(0)(0)
SWS;LogTg-0.6014-0.6623-0.485
p-value(1e-04)(0)(0)
SWS;P-0.3689-0.3119-0.2421
p-value(0.0208)(0.0533)(0.0458)
SWS;S-0.5795-0.5491-0.4299
p-value(1e-04)(3e-04)(5e-04)
SWS;D-0.5422-0.4905-0.3888
p-value(4e-04)(0.0015)(0.0014)
LogPS;LogL-0.3459-0.3893-0.2373
p-value(0.031)(0.0143)(0.036)
LogPS;LogWb-0.3719-0.4395-0.2777
p-value(0.0197)(0.0051)(0.0139)
LogPS;LogBr-0.4378-0.5242-0.3242
p-value(0.0053)(6e-04)(0.0041)
LogPS;LogTg-0.6455-0.6521-0.4606
p-value(0)(0)(0)
LogPS;P-0.5341-0.5339-0.3919
p-value(5e-04)(5e-04)(0.0013)
LogPS;S-0.5914-0.6156-0.4706
p-value(1e-04)(0)(1e-04)
LogPS;D-0.6844-0.6808-0.5266
p-value(0)(0)(0)
LogL;LogWb0.68480.70630.5251
p-value(0)(0)(0)
LogL;LogBr0.77660.80330.6499
p-value(0)(0)(0)
LogL;LogTg0.67920.71150.533
p-value(0)(0)(0)
LogL;P0.01950.0122-0.006
p-value(0.9064)(0.9412)(0.9604)
LogL;S0.51870.52420.4101
p-value(7e-04)(6e-04)(9e-04)
LogL;D0.22740.20720.1615
p-value(0.1638)(0.2057)(0.1831)
LogWb;LogBr0.94460.92840.7916
p-value(0)(0)(0)
LogWb;LogTg0.69490.70950.5207
p-value(0)(0)(0)
LogWb;P0.25290.21470.1602
p-value(0.1204)(0.1893)(0.1846)
LogWb;S0.66240.59540.4811
p-value(0)(1e-04)(1e-04)
LogWb;D0.43210.36150.274
p-value(0.006)(0.0238)(0.0236)
LogBr;LogTg0.77750.80820.5993
p-value(0)(0)(0)
LogBr;P0.19170.16750.1257
p-value(0.2424)(0.3082)(0.2976)
LogBr;S0.62360.59760.4905
p-value(0)(1e-04)(1e-04)
LogBr;D0.37680.34140.2695
p-value(0.0181)(0.0334)(0.026)
LogTg;P0.14810.11620.075
p-value(0.3682)(0.4813)(0.5352)
LogTg;S0.58020.57710.4617
p-value(1e-04)(1e-04)(2e-04)
LogTg;D0.35340.31150.2293
p-value(0.0273)(0.0535)(0.0586)
P;S0.680.61860.5218
p-value(0)(0)(1e-04)
P;D0.93030.93280.876
p-value(0)(0)(0)
S;D0.81920.75330.6591
p-value(0)(0)(0)


Parameters (Session):
par1 = pearson ;
Parameters (R input):
par1 = pearson ;
R code (references can be found in the software module):
panel.tau <- function(x, y, digits=2, prefix='', cex.cor)
{
usr <- par('usr'); on.exit(par(usr))
par(usr = c(0, 1, 0, 1))
rr <- cor.test(x, y, method=par1)
r <- round(rr$p.value,2)
txt <- format(c(r, 0.123456789), digits=digits)[1]
txt <- paste(prefix, txt, sep='')
if(missing(cex.cor)) cex <- 0.5/strwidth(txt)
text(0.5, 0.5, txt, cex = cex)
}
panel.hist <- function(x, ...)
{
usr <- par('usr'); on.exit(par(usr))
par(usr = c(usr[1:2], 0, 1.5) )
h <- hist(x, plot = FALSE)
breaks <- h$breaks; nB <- length(breaks)
y <- h$counts; y <- y/max(y)
rect(breaks[-nB], 0, breaks[-1], y, col='grey', ...)
}
bitmap(file='test1.png')
pairs(t(y),diag.panel=panel.hist, upper.panel=panel.smooth, lower.panel=panel.tau, main=main)
dev.off()
load(file='createtable')
n <- length(y[,1])
n
a<-table.start()
a<-table.row.start(a)
a<-table.element(a,paste('Correlations for all pairs of data series (method=',par1,')',sep=''),n+1,TRUE)
a<-table.row.end(a)
a<-table.row.start(a)
a<-table.element(a,' ',header=TRUE)
for (i in 1:n) {
a<-table.element(a,dimnames(t(x))[[2]][i],header=TRUE)
}
a<-table.row.end(a)
for (i in 1:n) {
a<-table.row.start(a)
a<-table.element(a,dimnames(t(x))[[2]][i],header=TRUE)
for (j in 1:n) {
r <- cor.test(y[i,],y[j,],method=par1)
a<-table.element(a,round(r$estimate,3))
}
a<-table.row.end(a)
}
a<-table.end(a)
table.save(a,file='mytable.tab')
a<-table.start()
a<-table.row.start(a)
a<-table.element(a,'Correlations for all pairs of data series with p-values',4,TRUE)
a<-table.row.end(a)
a<-table.row.start(a)
a<-table.element(a,'pair',1,TRUE)
a<-table.element(a,'Pearson r',1,TRUE)
a<-table.element(a,'Spearman rho',1,TRUE)
a<-table.element(a,'Kendall tau',1,TRUE)
a<-table.row.end(a)
cor.test(y[1,],y[2,],method=par1)
for (i in 1:(n-1))
{
for (j in (i+1):n)
{
a<-table.row.start(a)
dum <- paste(dimnames(t(x))[[2]][i],';',dimnames(t(x))[[2]][j],sep='')
a<-table.element(a,dum,header=TRUE)
rp <- cor.test(y[i,],y[j,],method='pearson')
a<-table.element(a,round(rp$estimate,4))
rs <- cor.test(y[i,],y[j,],method='spearman')
a<-table.element(a,round(rs$estimate,4))
rk <- cor.test(y[i,],y[j,],method='kendall')
a<-table.element(a,round(rk$estimate,4))
a<-table.row.end(a)
a<-table.row.start(a)
a<-table.element(a,'p-value',header=T)
a<-table.element(a,paste('(',round(rp$p.value,4),')',sep=''))
a<-table.element(a,paste('(',round(rs$p.value,4),')',sep=''))
a<-table.element(a,paste('(',round(rk$p.value,4),')',sep=''))
a<-table.row.end(a)
}
}
a<-table.end(a)
table.save(a,file='mytable1.tab')