Free Statistics

of Irreproducible Research!

Author's title

Author*The author of this computation has been verified*
R Software Modulerwasp_bootstrapplot.wasp
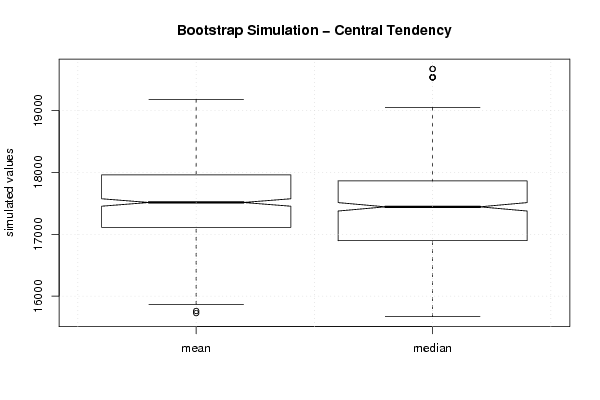
Title produced by softwareBlocked Bootstrap Plot - Central Tendency
Date of computationMon, 06 Dec 2010 20:21:13 +0000
Cite this page as followsStatistical Computations at FreeStatistics.org, Office for Research Development and Education, URL https://freestatistics.org/blog/index.php?v=date/2010/Dec/06/t1291667613izfntcr9le3dfzj.htm/, Retrieved Mon, 29 Apr 2024 05:50:24 +0000
Statistical Computations at FreeStatistics.org, Office for Research Development and Education, URL https://freestatistics.org/blog/index.php?pk=105872, Retrieved Mon, 29 Apr 2024 05:50:24 +0000
QR Codes:

Original text written by user:
IsPrivate?No (this computation is public)
User-defined keywords
Estimated Impact106
Family? (F = Feedback message, R = changed R code, M = changed R Module, P = changed Parameters, D = changed Data)
-     [Bivariate Data Series] [Bivariate dataset] [2008-01-05 23:51:08] [74be16979710d4c4e7c6647856088456]
- RMPD  [Blocked Bootstrap Plot - Central Tendency] [Colombia Coffee] [2008-01-07 10:26:26] [74be16979710d4c4e7c6647856088456]
-  M D    [Blocked Bootstrap Plot - Central Tendency] [Bootstrap simulat...] [2010-11-25 11:46:05] [62f7c80c4d96454bbd2b2b026ea9aad9]
-    D        [Blocked Bootstrap Plot - Central Tendency] [Bootstrap simulat...] [2010-12-06 20:21:13] [8eb352cba3cf694c3df89d0a436a2f1b] [Current]
Feedback Forum

Post a new message
Dataseries X:
16896.2
16698.00
19691.6
15930.7
17444.6
17699.4
15189.8
15672.7
17180.8
17664.9
17862.9
16162.3
17463.6
16772.1
19106.9
16721.3
18161.3
18509.9
17802.7
16409.9
17967.7
20286.6
19537.3
18021.9
20194.3
19049.6
20244.7
21473.3
19673.6
21053.2
20159.5
18203.6
21289.5
20432.3
17180.4
15816.8
15071.8
14521.1
15668.8
14346.9
13881.00
15465.9
14238.2
13557.7
16127.6
16793.9
16014.00
16867.9
16014.6
15878.6
18664.9
17962.5
17332.7
19542.1
17203.6


Summary of computational transaction
Raw Inputview raw input (R code)
Raw Outputview raw output of R engine
Computing time2 seconds
R Server'Sir Ronald Aylmer Fisher' @ 193.190.124.24

\begin{tabular}{lllllllll}
\hline
Summary of computational transaction \tabularnewline
Raw Input & view raw input (R code)  \tabularnewline
Raw Output & view raw output of R engine  \tabularnewline
Computing time & 2 seconds \tabularnewline
R Server & 'Sir Ronald Aylmer Fisher' @ 193.190.124.24 \tabularnewline
\hline
\end{tabular}
%Source: https://freestatistics.org/blog/index.php?pk=105872&T=0

[TABLE]
[ROW][C]Summary of computational transaction[/C][/ROW]
[ROW][C]Raw Input[/C][C]view raw input (R code) [/C][/ROW]
[ROW][C]Raw Output[/C][C]view raw output of R engine [/C][/ROW]
[ROW][C]Computing time[/C][C]2 seconds[/C][/ROW]
[ROW][C]R Server[/C][C]'Sir Ronald Aylmer Fisher' @ 193.190.124.24[/C][/ROW]
[/TABLE]
Source: https://freestatistics.org/blog/index.php?pk=105872&T=0

Globally Unique Identifier (entire table): ba.freestatistics.org/blog/index.php?pk=105872&T=0

As an alternative you can also use a QR Code:  

The GUIDs for individual cells are displayed in the table below:

Summary of computational transaction
Raw Inputview raw input (R code)
Raw Outputview raw output of R engine
Computing time2 seconds
R Server'Sir Ronald Aylmer Fisher' @ 193.190.124.24


Estimation Results of Blocked Bootstrap
statisticQ1EstimateQ3S.D.IQR
mean17111.692272727317468.721818181817961.5804545455608.587063931123849.888181818184
median16896.217332.717862.9689.446638510702966.7

\begin{tabular}{lllllllll}
\hline
Estimation Results of Blocked Bootstrap \tabularnewline
statistic & Q1 & Estimate & Q3 & S.D. & IQR \tabularnewline
mean & 17111.6922727273 & 17468.7218181818 & 17961.5804545455 & 608.587063931123 & 849.888181818184 \tabularnewline
median & 16896.2 & 17332.7 & 17862.9 & 689.446638510702 & 966.7 \tabularnewline
\hline
\end{tabular}
%Source: https://freestatistics.org/blog/index.php?pk=105872&T=1

[TABLE]
[ROW][C]Estimation Results of Blocked Bootstrap[/C][/ROW]
[ROW][C]statistic[/C][C]Q1[/C][C]Estimate[/C][C]Q3[/C][C]S.D.[/C][C]IQR[/C][/ROW]
[ROW][C]mean[/C][C]17111.6922727273[/C][C]17468.7218181818[/C][C]17961.5804545455[/C][C]608.587063931123[/C][C]849.888181818184[/C][/ROW]
[ROW][C]median[/C][C]16896.2[/C][C]17332.7[/C][C]17862.9[/C][C]689.446638510702[/C][C]966.7[/C][/ROW]
[/TABLE]
Source: https://freestatistics.org/blog/index.php?pk=105872&T=1

Globally Unique Identifier (entire table): ba.freestatistics.org/blog/index.php?pk=105872&T=1

As an alternative you can also use a QR Code:  

The GUIDs for individual cells are displayed in the table below:

Estimation Results of Blocked Bootstrap
statisticQ1EstimateQ3S.D.IQR
mean17111.692272727317468.721818181817961.5804545455608.587063931123849.888181818184
median16896.217332.717862.9689.446638510702966.7


95% Confidence Intervals
MeanMedian
Lower Bound17454.561216954717376.2932215224
Upper Bound17574.740601227117512.9067784776

\begin{tabular}{lllllllll}
\hline
95% Confidence Intervals \tabularnewline
 & Mean & Median \tabularnewline
Lower Bound & 17454.5612169547 & 17376.2932215224 \tabularnewline
Upper Bound & 17574.7406012271 & 17512.9067784776 \tabularnewline
\hline
\end{tabular}
%Source: https://freestatistics.org/blog/index.php?pk=105872&T=2

[TABLE]
[ROW][C]95% Confidence Intervals[/C][/ROW]
[ROW][C][/C][C]Mean[/C][C]Median[/C][/ROW]
[ROW][C]Lower Bound[/C][C]17454.5612169547[/C][C]17376.2932215224[/C][/ROW]
[ROW][C]Upper Bound[/C][C]17574.7406012271[/C][C]17512.9067784776[/C][/ROW]
[/TABLE]
Source: https://freestatistics.org/blog/index.php?pk=105872&T=2

Globally Unique Identifier (entire table): ba.freestatistics.org/blog/index.php?pk=105872&T=2

As an alternative you can also use a QR Code:  

The GUIDs for individual cells are displayed in the table below:

95% Confidence Intervals
MeanMedian
Lower Bound17454.561216954717376.2932215224
Upper Bound17574.740601227117512.9067784776


Parameters (Session):
par1 = 500 ; par2 = 12 ;
Parameters (R input):
par1 = 500 ; par2 = 12 ;
R code (references can be found in the software module):
par1 <- as.numeric(par1)
par2 <- as.numeric(par2)
if (par1 < 10) par1 = 10
if (par1 > 5000) par1 = 5000
if (par2 < 3) par2 = 3
if (par2 > length(x)) par2 = length(x)
library(lattice)
library(boot)
boot.stat <- function(s)
{
s.mean <- mean(s)
s.median <- median(s)
c(s.mean, s.median)
}
(r <- tsboot(x, boot.stat, R=par1, l=12, sim='fixed'))
z <- data.frame(cbind(r$t[,1],r$t[,2]))
colnames(z) <- list('mean','median')
bitmap(file='plot7.png')
b <- boxplot(z,notch=TRUE,ylab='simulated values',main='Bootstrap Simulation - Central Tendency')
grid()
dev.off()
b
load(file='createtable')
a<-table.start()
a<-table.row.start(a)
a<-table.element(a,'Estimation Results of Blocked Bootstrap',6,TRUE)
a<-table.row.end(a)
a<-table.row.start(a)
a<-table.element(a,'statistic',header=TRUE)
a<-table.element(a,'Q1',header=TRUE)
a<-table.element(a,'Estimate',header=TRUE)
a<-table.element(a,'Q3',header=TRUE)
a<-table.element(a,'S.D.',header=TRUE)
a<-table.element(a,'IQR',header=TRUE)
a<-table.row.end(a)
a<-table.row.start(a)
a<-table.element(a,'mean',header=TRUE)
q1 <- quantile(r$t[,1],0.25)[[1]]
q3 <- quantile(r$t[,1],0.75)[[1]]
a<-table.element(a,q1)
a<-table.element(a,r$t0[1])
a<-table.element(a,q3)
a<-table.element(a,sqrt(var(r$t[,1])))
a<-table.element(a,q3-q1)
a<-table.row.end(a)
a<-table.row.start(a)
a<-table.element(a,'median',header=TRUE)
q1 <- quantile(r$t[,2],0.25)[[1]]
q3 <- quantile(r$t[,2],0.75)[[1]]
a<-table.element(a,q1)
a<-table.element(a,r$t0[2])
a<-table.element(a,q3)
a<-table.element(a,sqrt(var(r$t[,2])))
a<-table.element(a,q3-q1)
a<-table.row.end(a)
a<-table.end(a)
table.save(a,file='mytable.tab')

a<-table.start()
a<-table.row.start(a)
a<-table.element(a,'95% Confidence Intervals',3,TRUE)
a<-table.row.end(a)
a<-table.row.start(a)
a<-table.element(a,'',1,TRUE)
a<-table.element(a,'Mean',1,TRUE)
a<-table.element(a,'Median',1,TRUE)
a<-table.row.end(a)
a<-table.row.start(a)
a<-table.element(a,'Lower Bound',1,TRUE)
a<-table.element(a,b$conf[1,1])
a<-table.element(a,b$conf[1,2])
a<-table.row.end(a)
a<-table.row.start(a)
a<-table.element(a,'Upper Bound',1,TRUE)
a<-table.element(a,b$conf[2,1])
a<-table.element(a,b$conf[2,2])
a<-table.row.end(a)
a<-table.end(a)
table.save(a,file='mytable1.tab')