| Multiple Linear Regression - Estimated Regression Equation |
| SWS[t] = + 11.8968496425214 -1.55793040984930Wb[t] -0.970091916215475D[t] + e[t] |
| Multiple Linear Regression - Ordinary Least Squares | |||||
| Variable | Parameter | S.D. | T-STAT H0: parameter = 0 | 2-tail p-value | 1-tail p-value |
| (Intercept) | 11.8968496425214 | 0.918675 | 12.95 | 0 | 0 |
| Wb | -1.55793040984930 | 0.33061 | -4.7123 | 3.1e-05 | 1.5e-05 |
| D | -0.970091916215475 | 0.317538 | -3.055 | 0.004046 | 0.002023 |
| Multiple Linear Regression - Regression Statistics | |
| Multiple R | 0.738193486309284 |
| R-squared | 0.544929623229456 |
| Adjusted R-squared | 0.521592680830966 |
| F-TEST (value) | 23.3505149871188 |
| F-TEST (DF numerator) | 2 |
| F-TEST (DF denominator) | 39 |
| p-value | 2.15046327189938e-07 |
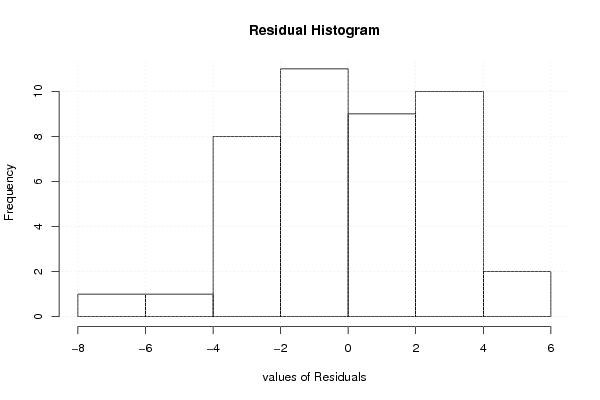
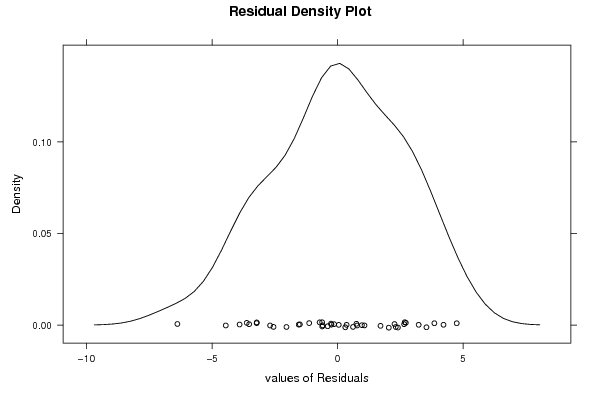
| Multiple Linear Regression - Residual Statistics | |
| Residual Standard Deviation | 2.65423991186651 |
| Sum Squared Residuals | 274.754590880060 |
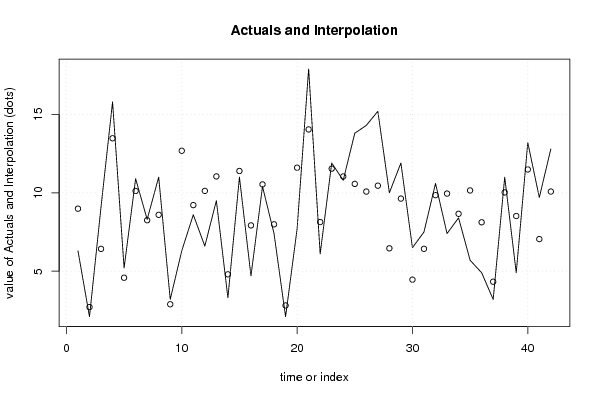
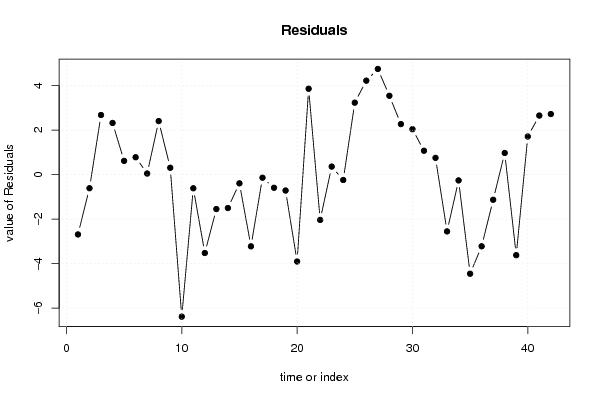
| Multiple Linear Regression - Actuals, Interpolation, and Residuals | |||
| Time or Index | Actuals | Interpolation Forecast | Residuals Prediction Error |
| 1 | 6.3 | 8.98657389387501 | -2.68657389387501 |
| 2 | 2.1 | 2.71012590741713 | -0.610125907417125 |
| 3 | 9.1 | 6.42232585327244 | 2.67767414672756 |
| 4 | 15.8 | 13.4790717502112 | 2.32092824978882 |
| 5 | 5.2 | 4.58261642918733 | 0.617383570812674 |
| 6 | 10.9 | 10.1189490912492 | 0.781050908750808 |
| 7 | 8.3 | 8.25126528177318 | 0.0487347182268253 |
| 8 | 11 | 8.59542616424918 | 2.40457383575082 |
| 9 | 3.2 | 2.89068398912306 | 0.309316010876941 |
| 10 | 6.3 | 12.6793339938957 | -6.37933399389573 |
| 11 | 8.6 | 9.21334409774053 | -0.61334409774053 |
| 12 | 6.6 | 10.1204515684481 | -3.52045156844808 |
| 13 | 9.5 | 11.0456124348946 | -1.54561243489458 |
| 14 | 3.3 | 4.80008470994628 | -1.50008470994629 |
| 15 | 11 | 11.3912373489066 | -0.391237348906629 |
| 16 | 4.7 | 7.9208573081518 | -3.22085730815180 |
| 17 | 10.4 | 10.5377719037574 | -0.13777190375738 |
| 18 | 7.4 | 7.98994522085017 | -0.589945220850169 |
| 19 | 2.1 | 2.81374595415665 | -0.713745954156647 |
| 20 | 7.7 | 11.6013265824033 | -3.90132658240335 |
| 21 | 17.9 | 14.0426185460046 | 3.85738145399544 |
| 22 | 6.1 | 8.13433620765172 | -2.03433620765172 |
| 23 | 11.9 | 11.5388879177802 | 0.361112082219771 |
| 24 | 10.8 | 11.0411082740080 | -0.241108274007956 |
| 25 | 13.8 | 10.5677343443631 | 3.23226565563689 |
| 26 | 14.3 | 10.0791375755311 | 4.22086242446886 |
| 27 | 15.2 | 10.4532697803741 | 4.74673021962586 |
| 28 | 10 | 6.45855156781024 | 3.54144843218976 |
| 29 | 11.9 | 9.63025599690196 | 2.26974400309804 |
| 30 | 6.5 | 4.45925755815417 | 2.04074244184583 |
| 31 | 7.5 | 6.42642722012726 | 1.07357277987274 |
| 32 | 10.6 | 9.84786320922108 | 0.752136790778921 |
| 33 | 7.4 | 9.95016372855958 | -2.55016372855958 |
| 34 | 8.4 | 8.6596748580572 | -0.259674858057208 |
| 35 | 5.7 | 10.1513116678310 | -4.45131166783095 |
| 36 | 4.9 | 8.1198933104919 | -3.2198933104919 |
| 37 | 3.2 | 4.32890297954162 | -1.12890297954162 |
| 38 | 11 | 10.0279527967978 | 0.972047203202204 |
| 39 | 4.9 | 8.5175901088298 | -3.6175901088298 |
| 40 | 13.2 | 11.4880594631304 | 1.71194053686958 |
| 41 | 9.7 | 7.04711582979317 | 2.65288417020683 |
| 42 | 12.8 | 10.0791375755311 | 2.72086242446886 |
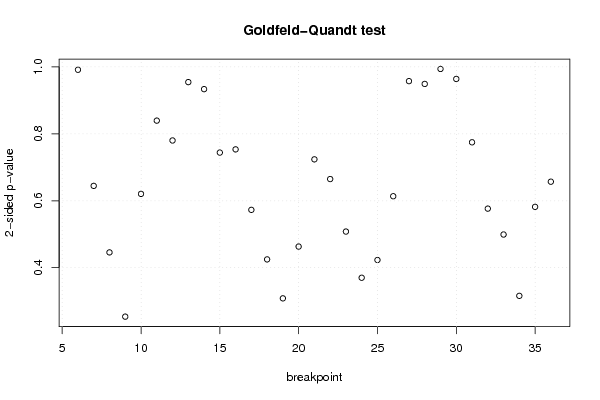
| Goldfeld-Quandt test for Heteroskedasticity | |||
| p-values | Alternative Hypothesis | ||
| breakpoint index | greater | 2-sided | less |
| 6 | 0.495816690875335 | 0.99163338175067 | 0.504183309124665 |
| 7 | 0.322260013095660 | 0.644520026191321 | 0.67773998690434 |
| 8 | 0.222849287908679 | 0.445698575817357 | 0.777150712091321 |
| 9 | 0.126790174897222 | 0.253580349794444 | 0.873209825102778 |
| 10 | 0.689734484701999 | 0.620531030596003 | 0.310265515298001 |
| 11 | 0.580231002445671 | 0.839537995108658 | 0.419768997554329 |
| 12 | 0.609867754476493 | 0.780264491047015 | 0.390132245523507 |
| 13 | 0.522637944034902 | 0.954724111930196 | 0.477362055965098 |
| 14 | 0.466857616741195 | 0.93371523348239 | 0.533142383258805 |
| 15 | 0.372034624905617 | 0.744069249811234 | 0.627965375094383 |
| 16 | 0.376821075678553 | 0.753642151357105 | 0.623178924321447 |
| 17 | 0.286418828335626 | 0.572837656671252 | 0.713581171664374 |
| 18 | 0.212383675069942 | 0.424767350139884 | 0.787616324930058 |
| 19 | 0.154151603461258 | 0.308303206922515 | 0.845848396538742 |
| 20 | 0.231545424054156 | 0.463090848108312 | 0.768454575945844 |
| 21 | 0.361917030660749 | 0.723834061321497 | 0.638082969339251 |
| 22 | 0.332473567329097 | 0.664947134658193 | 0.667526432670903 |
| 23 | 0.253977441401058 | 0.507954882802116 | 0.746022558598942 |
| 24 | 0.184929272739410 | 0.369858545478821 | 0.81507072726059 |
| 25 | 0.211462235925639 | 0.422924471851278 | 0.788537764074361 |
| 26 | 0.306788638341567 | 0.613577276683134 | 0.693211361658433 |
| 27 | 0.478842501657002 | 0.957685003314005 | 0.521157498342998 |
| 28 | 0.52536118645087 | 0.94927762709826 | 0.47463881354913 |
| 29 | 0.502968030453483 | 0.994063939093034 | 0.497031969546517 |
| 30 | 0.482116569606861 | 0.964233139213722 | 0.517883430393139 |
| 31 | 0.387407440035318 | 0.774814880070636 | 0.612592559964682 |
| 32 | 0.288247250789725 | 0.57649450157945 | 0.711752749210275 |
| 33 | 0.249553632768713 | 0.499107265537425 | 0.750446367231287 |
| 34 | 0.157886206314137 | 0.315772412628273 | 0.842113793685863 |
| 35 | 0.290893503950718 | 0.581787007901435 | 0.709106496049282 |
| 36 | 0.328505377339808 | 0.657010754679617 | 0.671494622660192 |
| Meta Analysis of Goldfeld-Quandt test for Heteroskedasticity | |||
| Description | # significant tests | % significant tests | OK/NOK |
| 1% type I error level | 0 | 0 | OK |
| 5% type I error level | 0 | 0 | OK |
| 10% type I error level | 0 | 0 | OK |