| Multiple Linear Regression - Estimated Regression Equation |
| BEL_20[t] = -2101.09115636334 + 0.192421203520586Nikkei[t] + 0.301255385502806DJ_Indust[t] + 0.011931737331997Goudprijs[t] -8.47433649695565Conjunct_Seizoenzuiver[t] -8.59705875060859Cons_vertrouw[t] + 27.7373411137287Alg_consumptie_index_BE[t] -259.760301077345Gem_rente_kasbon_5j[t] + 111.420983877046M1[t] + 147.196762063619M2[t] + 143.318245880678M3[t] + 78.5931152743392M4[t] + 68.8461761572716M5[t] + 46.0649034733879M6[t] + 77.6007840575792M7[t] + 97.8320949690298M8[t] + 117.535120245601M9[t] + 186.991868973947M10[t] + 126.132735266924M11[t] + e[t] |
| Multiple Linear Regression - Ordinary Least Squares | |||||
| Variable | Parameter | S.D. | T-STAT H0: parameter = 0 | 2-tail p-value | 1-tail p-value |
| (Intercept) | -2101.09115636334 | 310.359456 | -6.7699 | 0 | 0 |
| Nikkei | 0.192421203520586 | 0.01623 | 11.8557 | 0 | 0 |
| DJ_Indust | 0.301255385502806 | 0.036336 | 8.2908 | 0 | 0 |
| Goudprijs | 0.011931737331997 | 0.009028 | 1.3216 | 0.191979 | 0.09599 |
| Conjunct_Seizoenzuiver | -8.47433649695565 | 7.250353 | -1.1688 | 0.247708 | 0.123854 |
| Cons_vertrouw | -8.59705875060859 | 9.855071 | -0.8723 | 0.386953 | 0.193477 |
| Alg_consumptie_index_BE | 27.7373411137287 | 20.148195 | 1.3767 | 0.174403 | 0.087202 |
| Gem_rente_kasbon_5j | -259.760301077345 | 64.403705 | -4.0333 | 0.000177 | 8.9e-05 |
| M1 | 111.420983877046 | 103.78436 | 1.0736 | 0.287874 | 0.143937 |
| M2 | 147.196762063619 | 108.98029 | 1.3507 | 0.182539 | 0.09127 |
| M3 | 143.318245880678 | 105.437294 | 1.3593 | 0.179815 | 0.089908 |
| M4 | 78.5931152743392 | 103.698608 | 0.7579 | 0.451868 | 0.225934 |
| M5 | 68.8461761572716 | 98.014898 | 0.7024 | 0.4855 | 0.24275 |
| M6 | 46.0649034733879 | 100.363071 | 0.459 | 0.648124 | 0.324062 |
| M7 | 77.6007840575792 | 100.811933 | 0.7698 | 0.444861 | 0.22243 |
| M8 | 97.8320949690298 | 102.122201 | 0.958 | 0.342417 | 0.171209 |
| M9 | 117.535120245601 | 100.054758 | 1.1747 | 0.245363 | 0.122681 |
| M10 | 186.991868973947 | 101.093886 | 1.8497 | 0.069938 | 0.034969 |
| M11 | 126.132735266924 | 97.967903 | 1.2875 | 0.203517 | 0.101759 |
| Multiple Linear Regression - Regression Statistics | |
| Multiple R | 0.985174578486878 |
| R-squared | 0.970568950096798 |
| Adjusted R-squared | 0.960573499186276 |
| F-TEST (value) | 97.1010671539735 |
| F-TEST (DF numerator) | 18 |
| F-TEST (DF denominator) | 53 |
| p-value | 0 |
| Multiple Linear Regression - Residual Statistics | |
| Residual Standard Deviation | 167.91104430026 |
| Sum Squared Residuals | 1494288.29629421 |
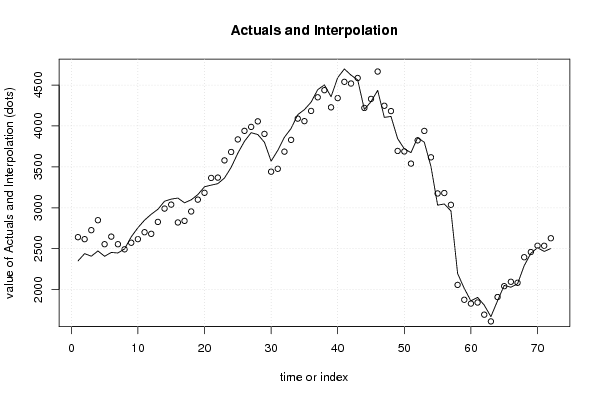
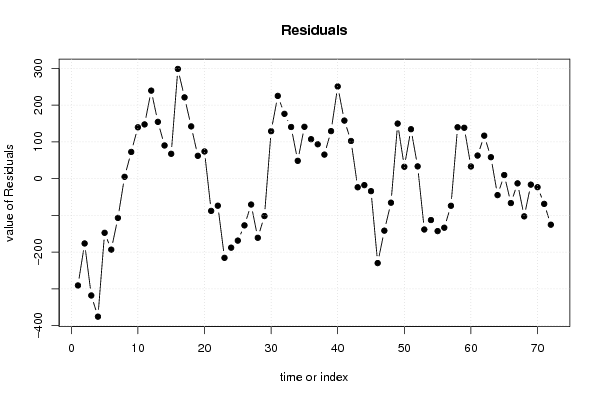
| Multiple Linear Regression - Actuals, Interpolation, and Residuals | |||
| Time or Index | Actuals | Interpolation Forecast | Residuals Prediction Error |
| 1 | 2350.44 | 2641.39845917012 | -290.958459170123 |
| 2 | 2440.25 | 2616.92159422002 | -176.671594220024 |
| 3 | 2408.64 | 2726.85128534376 | -318.211285343761 |
| 4 | 2472.81 | 2848.67839698914 | -375.868396989144 |
| 5 | 2407.6 | 2555.27875871935 | -147.678758719351 |
| 6 | 2454.62 | 2648.07394855203 | -193.453948552026 |
| 7 | 2448.05 | 2555.18101653486 | -107.131016534862 |
| 8 | 2497.84 | 2493.12734738574 | 4.71265261425865 |
| 9 | 2645.64 | 2573.12961019067 | 72.5103898093341 |
| 10 | 2756.76 | 2617.18842554128 | 139.571574458718 |
| 11 | 2849.27 | 2701.88921051192 | 147.380789488082 |
| 12 | 2921.44 | 2682.08741134108 | 239.352588658922 |
| 13 | 2981.85 | 2827.57150213298 | 154.278497867023 |
| 14 | 3080.58 | 2990.50145743186 | 90.078542568144 |
| 15 | 3106.22 | 3038.85373358509 | 67.3662664149108 |
| 16 | 3119.31 | 2820.97426345955 | 298.335736540447 |
| 17 | 3061.26 | 2840.30835845013 | 220.951641549868 |
| 18 | 3097.31 | 2955.34744355393 | 141.962556446073 |
| 19 | 3161.69 | 3099.79682263869 | 61.8931773613089 |
| 20 | 3257.16 | 3183.41935526259 | 73.7406447374149 |
| 21 | 3277.01 | 3365.00605759133 | -87.9960575913262 |
| 22 | 3295.32 | 3369.21931312572 | -73.8993131257238 |
| 23 | 3363.99 | 3579.75137323752 | -215.761373237518 |
| 24 | 3494.17 | 3682.24303552564 | -188.073035525642 |
| 25 | 3667.03 | 3835.91295714123 | -168.882957141233 |
| 26 | 3813.06 | 3940.46332432876 | -127.403324328763 |
| 27 | 3917.96 | 3988.71832487628 | -70.7583248762794 |
| 28 | 3895.51 | 4056.70603718522 | -161.196037185223 |
| 29 | 3801.06 | 3903.07056246709 | -102.010562467086 |
| 30 | 3570.12 | 3441.34162636562 | 128.778373634377 |
| 31 | 3701.61 | 3476.62356237362 | 224.986437626383 |
| 32 | 3862.27 | 3686.12983968646 | 176.140160313544 |
| 33 | 3970.1 | 3829.7789676863 | 140.321032313697 |
| 34 | 4138.52 | 4090.23427658974 | 48.2857234102575 |
| 35 | 4199.75 | 4058.9205168308 | 140.829483169199 |
| 36 | 4290.89 | 4183.75209115137 | 107.137908848633 |
| 37 | 4443.91 | 4350.57395304606 | 93.3360469539419 |
| 38 | 4502.64 | 4437.45360683426 | 65.1863931657418 |
| 39 | 4356.98 | 4227.81174766188 | 129.168252338122 |
| 40 | 4591.27 | 4340.59763863395 | 250.672361366051 |
| 41 | 4696.96 | 4539.19373638599 | 157.766263614012 |
| 42 | 4621.4 | 4519.12703337337 | 102.272966626631 |
| 43 | 4562.84 | 4586.51564534514 | -23.6756453451422 |
| 44 | 4202.52 | 4220.40753184759 | -17.8875318475878 |
| 45 | 4296.49 | 4330.73253508512 | -34.242535085116 |
| 46 | 4435.23 | 4665.27894660937 | -230.048946609371 |
| 47 | 4105.18 | 4246.95871906507 | -141.778719065071 |
| 48 | 4116.68 | 4182.39911961097 | -65.7191196109737 |
| 49 | 3844.49 | 3694.88104502548 | 149.60895497452 |
| 50 | 3720.98 | 3688.87508233041 | 32.1049176695879 |
| 51 | 3674.4 | 3540.07672057885 | 134.323279421154 |
| 52 | 3857.62 | 3824.4788069052 | 33.1411930947961 |
| 53 | 3801.06 | 3939.72518592325 | -138.665185923247 |
| 54 | 3504.37 | 3617.25030258715 | -112.880302587152 |
| 55 | 3032.6 | 3175.59865467915 | -142.998654679153 |
| 56 | 3047.03 | 3180.83366935079 | -133.80366935079 |
| 57 | 2962.34 | 3036.39078338201 | -74.0507833820095 |
| 58 | 2197.82 | 2058.23787204851 | 139.582127951488 |
| 59 | 2014.45 | 1876.18410773924 | 138.265892260758 |
| 60 | 1862.83 | 1829.96570874836 | 32.8642912516409 |
| 61 | 1905.41 | 1842.79208348413 | 62.6179165158713 |
| 62 | 1810.99 | 1694.28493485469 | 116.705065145313 |
| 63 | 1670.07 | 1611.95818795415 | 58.1118120458538 |
| 64 | 1864.44 | 1909.52485682693 | -45.0848568269274 |
| 65 | 2052.02 | 2042.3833980542 | 9.63660194580358 |
| 66 | 2029.6 | 2096.2796455679 | -66.679645567904 |
| 67 | 2070.83 | 2083.90429842853 | -13.0742984285344 |
| 68 | 2293.41 | 2396.31225646684 | -102.90225646684 |
| 69 | 2443.27 | 2459.81204606458 | -16.5420460645794 |
| 70 | 2513.17 | 2536.66116608537 | -23.491166085369 |
| 71 | 2466.92 | 2535.85607261545 | -68.93607261545 |
| 72 | 2502.66 | 2628.22263362258 | -125.56263362258 |
| Goldfeld-Quandt test for Heteroskedasticity | |||
| p-values | Alternative Hypothesis | ||
| breakpoint index | greater | 2-sided | less |
| 22 | 0.96903324338399 | 0.0619335132320174 | 0.0309667566160087 |
| 23 | 0.977472009625188 | 0.0450559807496248 | 0.0225279903748124 |
| 24 | 0.97212978765017 | 0.0557404246996613 | 0.0278702123498306 |
| 25 | 0.993755858668359 | 0.0124882826632827 | 0.00624414133164135 |
| 26 | 0.995601887574346 | 0.0087962248513077 | 0.00439811242565385 |
| 27 | 0.999543570232484 | 0.000912859535031758 | 0.000456429767515879 |
| 28 | 0.999835712681839 | 0.000328574636322558 | 0.000164287318161279 |
| 29 | 0.999975837638599 | 4.83247228021442e-05 | 2.41623614010721e-05 |
| 30 | 0.99999251223751 | 1.49755249784547e-05 | 7.48776248922733e-06 |
| 31 | 0.999981671375852 | 3.6657248295076e-05 | 1.8328624147538e-05 |
| 32 | 0.999991532452186 | 1.69350956282712e-05 | 8.4675478141356e-06 |
| 33 | 0.999989137272292 | 2.17254554164641e-05 | 1.0862727708232e-05 |
| 34 | 0.999978341505637 | 4.33169887260594e-05 | 2.16584943630297e-05 |
| 35 | 0.999949105766917 | 0.000101788466166304 | 5.08942330831522e-05 |
| 36 | 0.999883055373888 | 0.000233889252224994 | 0.000116944626112497 |
| 37 | 0.999684221328133 | 0.000631557343734217 | 0.000315778671867109 |
| 38 | 0.999656963770726 | 0.000686072458548511 | 0.000343036229274256 |
| 39 | 0.999817546903515 | 0.000364906192970489 | 0.000182453096485245 |
| 40 | 0.999492200189966 | 0.00101559962006827 | 0.000507799810034137 |
| 41 | 0.998753818991513 | 0.00249236201697309 | 0.00124618100848654 |
| 42 | 0.997517922594615 | 0.00496415481077025 | 0.00248207740538513 |
| 43 | 0.994985398202705 | 0.0100292035945891 | 0.00501460179729456 |
| 44 | 0.992926737308936 | 0.0141465253821284 | 0.0070732626910642 |
| 45 | 0.993619211445876 | 0.0127615771082479 | 0.00638078855412396 |
| 46 | 0.993976388268157 | 0.012047223463686 | 0.006023611731843 |
| 47 | 0.988080104211275 | 0.0238397915774499 | 0.011919895788725 |
| 48 | 0.970354503459332 | 0.0592909930813358 | 0.0296454965406679 |
| 49 | 0.979583972641073 | 0.0408320547178532 | 0.0204160273589266 |
| 50 | 0.96303688774757 | 0.0739262245048584 | 0.0369631122524292 |
| Meta Analysis of Goldfeld-Quandt test for Heteroskedasticity | |||
| Description | # significant tests | % significant tests | OK/NOK |
| 1% type I error level | 17 | 0.586206896551724 | NOK |
| 5% type I error level | 25 | 0.862068965517241 | NOK |
| 10% type I error level | 29 | 1 | NOK |