Free Statistics

of Irreproducible Research!

Author's title

Author*Unverified author*
R Software Modulerwasp_smp.wasp
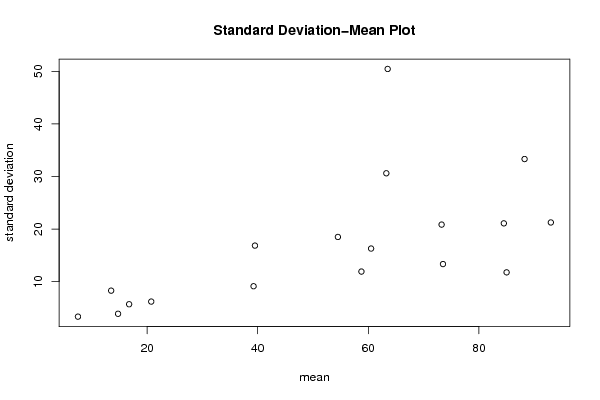
Title produced by softwareStandard Deviation-Mean Plot
Date of computationMon, 06 Dec 2010 18:14:19 +0000
Cite this page as followsStatistical Computations at FreeStatistics.org, Office for Research Development and Education, URL https://freestatistics.org/blog/index.php?v=date/2010/Dec/06/t12916591289734n996ast7hs4.htm/, Retrieved Mon, 29 Apr 2024 00:28:52 +0000
Statistical Computations at FreeStatistics.org, Office for Research Development and Education, URL https://freestatistics.org/blog/index.php?pk=105764, Retrieved Mon, 29 Apr 2024 00:28:52 +0000
QR Codes:

Original text written by user:
IsPrivate?No (this computation is public)
User-defined keywordsKDGP2W83
Estimated Impact116
Family? (F = Feedback message, R = changed R code, M = changed R Module, P = changed Parameters, D = changed Data)
-       [Standard Deviation-Mean Plot] [] [2010-12-06 18:14:19] [d05b5f5c1bde1241a89791f96cf6e071] [Current]
Feedback Forum

Post a new message
Dataseries X:
47
19
52
136
80
42
54
66
81
63
137
72
107
58
36
52
79
77
54
84
48
96
83
66
61
53
30
74
69
59
42
65
70
100
63
105
82
81
75
102
121
98
76
77
63
37
35
23
40
29
37
51
20
28
13
22
25
13
16
13
16
17
9
17
25
14
8
7
10
7
10
3


Summary of computational transaction
Raw Inputview raw input (R code)
Raw Outputview raw output of R engine
Computing time2 seconds
R Server'Sir Ronald Aylmer Fisher' @ 193.190.124.24

\begin{tabular}{lllllllll}
\hline
Summary of computational transaction \tabularnewline
Raw Input & view raw input (R code)  \tabularnewline
Raw Output & view raw output of R engine  \tabularnewline
Computing time & 2 seconds \tabularnewline
R Server & 'Sir Ronald Aylmer Fisher' @ 193.190.124.24 \tabularnewline
\hline
\end{tabular}
%Source: https://freestatistics.org/blog/index.php?pk=105764&T=0

[TABLE]
[ROW][C]Summary of computational transaction[/C][/ROW]
[ROW][C]Raw Input[/C][C]view raw input (R code) [/C][/ROW]
[ROW][C]Raw Output[/C][C]view raw output of R engine [/C][/ROW]
[ROW][C]Computing time[/C][C]2 seconds[/C][/ROW]
[ROW][C]R Server[/C][C]'Sir Ronald Aylmer Fisher' @ 193.190.124.24[/C][/ROW]
[/TABLE]
Source: https://freestatistics.org/blog/index.php?pk=105764&T=0

Globally Unique Identifier (entire table): ba.freestatistics.org/blog/index.php?pk=105764&T=0

As an alternative you can also use a QR Code:  

The GUIDs for individual cells are displayed in the table below:

Summary of computational transaction
Raw Inputview raw input (R code)
Raw Outputview raw output of R engine
Computing time2 seconds
R Server'Sir Ronald Aylmer Fisher' @ 193.190.124.24


Standard Deviation-Mean Plot
SectionMeanStandard DeviationRange
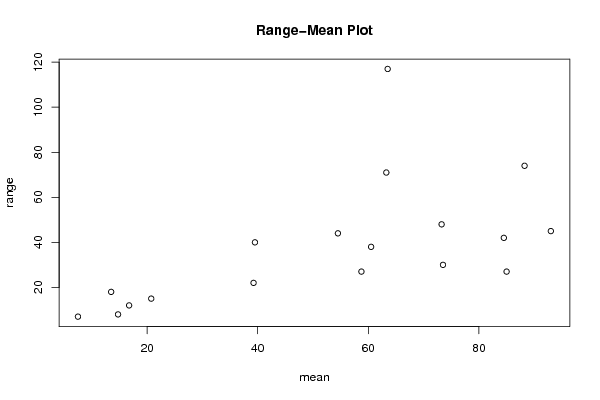
163.550.4678115237822117
260.516.278820596099738
388.2533.320414163092374
463.2530.609094509094371
573.513.329166015421530
673.2520.838665984174748
754.518.484227510682444
858.7511.898879499067727
984.521.079215671683242
108511.747340124470727
119321.244607158837645
1239.516.842406795546440
1339.259.1058589197651622
1420.756.1846584384264915
1516.755.6789083458002712
1614.753.862210075418828
1713.58.266397845091518
187.53.31662479035547

\begin{tabular}{lllllllll}
\hline
Standard Deviation-Mean Plot \tabularnewline
Section & Mean & Standard Deviation & Range \tabularnewline
1 & 63.5 & 50.4678115237822 & 117 \tabularnewline
2 & 60.5 & 16.2788205960997 & 38 \tabularnewline
3 & 88.25 & 33.3204141630923 & 74 \tabularnewline
4 & 63.25 & 30.6090945090943 & 71 \tabularnewline
5 & 73.5 & 13.3291660154215 & 30 \tabularnewline
6 & 73.25 & 20.8386659841747 & 48 \tabularnewline
7 & 54.5 & 18.4842275106824 & 44 \tabularnewline
8 & 58.75 & 11.8988794990677 & 27 \tabularnewline
9 & 84.5 & 21.0792156716832 & 42 \tabularnewline
10 & 85 & 11.7473401244707 & 27 \tabularnewline
11 & 93 & 21.2446071588376 & 45 \tabularnewline
12 & 39.5 & 16.8424067955464 & 40 \tabularnewline
13 & 39.25 & 9.10585891976516 & 22 \tabularnewline
14 & 20.75 & 6.18465843842649 & 15 \tabularnewline
15 & 16.75 & 5.67890834580027 & 12 \tabularnewline
16 & 14.75 & 3.86221007541882 & 8 \tabularnewline
17 & 13.5 & 8.2663978450915 & 18 \tabularnewline
18 & 7.5 & 3.3166247903554 & 7 \tabularnewline
\hline
\end{tabular}
%Source: https://freestatistics.org/blog/index.php?pk=105764&T=1

[TABLE]
[ROW][C]Standard Deviation-Mean Plot[/C][/ROW]
[ROW][C]Section[/C][C]Mean[/C][C]Standard Deviation[/C][C]Range[/C][/ROW]
[ROW][C]1[/C][C]63.5[/C][C]50.4678115237822[/C][C]117[/C][/ROW]
[ROW][C]2[/C][C]60.5[/C][C]16.2788205960997[/C][C]38[/C][/ROW]
[ROW][C]3[/C][C]88.25[/C][C]33.3204141630923[/C][C]74[/C][/ROW]
[ROW][C]4[/C][C]63.25[/C][C]30.6090945090943[/C][C]71[/C][/ROW]
[ROW][C]5[/C][C]73.5[/C][C]13.3291660154215[/C][C]30[/C][/ROW]
[ROW][C]6[/C][C]73.25[/C][C]20.8386659841747[/C][C]48[/C][/ROW]
[ROW][C]7[/C][C]54.5[/C][C]18.4842275106824[/C][C]44[/C][/ROW]
[ROW][C]8[/C][C]58.75[/C][C]11.8988794990677[/C][C]27[/C][/ROW]
[ROW][C]9[/C][C]84.5[/C][C]21.0792156716832[/C][C]42[/C][/ROW]
[ROW][C]10[/C][C]85[/C][C]11.7473401244707[/C][C]27[/C][/ROW]
[ROW][C]11[/C][C]93[/C][C]21.2446071588376[/C][C]45[/C][/ROW]
[ROW][C]12[/C][C]39.5[/C][C]16.8424067955464[/C][C]40[/C][/ROW]
[ROW][C]13[/C][C]39.25[/C][C]9.10585891976516[/C][C]22[/C][/ROW]
[ROW][C]14[/C][C]20.75[/C][C]6.18465843842649[/C][C]15[/C][/ROW]
[ROW][C]15[/C][C]16.75[/C][C]5.67890834580027[/C][C]12[/C][/ROW]
[ROW][C]16[/C][C]14.75[/C][C]3.86221007541882[/C][C]8[/C][/ROW]
[ROW][C]17[/C][C]13.5[/C][C]8.2663978450915[/C][C]18[/C][/ROW]
[ROW][C]18[/C][C]7.5[/C][C]3.3166247903554[/C][C]7[/C][/ROW]
[/TABLE]
Source: https://freestatistics.org/blog/index.php?pk=105764&T=1

Globally Unique Identifier (entire table): ba.freestatistics.org/blog/index.php?pk=105764&T=1

As an alternative you can also use a QR Code:  

The GUIDs for individual cells are displayed in the table below:

Standard Deviation-Mean Plot
SectionMeanStandard DeviationRange
163.550.4678115237822117
260.516.278820596099738
388.2533.320414163092374
463.2530.609094509094371
573.513.329166015421530
673.2520.838665984174748
754.518.484227510682444
858.7511.898879499067727
984.521.079215671683242
108511.747340124470727
119321.244607158837645
1239.516.842406795546440
1339.259.1058589197651622
1420.756.1846584384264915
1516.755.6789083458002712
1614.753.862210075418828
1713.58.266397845091518
187.53.31662479035547


Regression: S.E.(k) = alpha + beta * Mean(k)
alpha3.41545458306883
beta0.253765395233233
S.D.0.0835855957107396
T-STAT3.03599433700785
p-value0.00786565540752056

\begin{tabular}{lllllllll}
\hline
Regression: S.E.(k) = alpha + beta * Mean(k) \tabularnewline
alpha & 3.41545458306883 \tabularnewline
beta & 0.253765395233233 \tabularnewline
S.D. & 0.0835855957107396 \tabularnewline
T-STAT & 3.03599433700785 \tabularnewline
p-value & 0.00786565540752056 \tabularnewline
\hline
\end{tabular}
%Source: https://freestatistics.org/blog/index.php?pk=105764&T=2

[TABLE]
[ROW][C]Regression: S.E.(k) = alpha + beta * Mean(k)[/C][/ROW]
[ROW][C]alpha[/C][C]3.41545458306883[/C][/ROW]
[ROW][C]beta[/C][C]0.253765395233233[/C][/ROW]
[ROW][C]S.D.[/C][C]0.0835855957107396[/C][/ROW]
[ROW][C]T-STAT[/C][C]3.03599433700785[/C][/ROW]
[ROW][C]p-value[/C][C]0.00786565540752056[/C][/ROW]
[/TABLE]
Source: https://freestatistics.org/blog/index.php?pk=105764&T=2

Globally Unique Identifier (entire table): ba.freestatistics.org/blog/index.php?pk=105764&T=2

As an alternative you can also use a QR Code:  

The GUIDs for individual cells are displayed in the table below:

Regression: S.E.(k) = alpha + beta * Mean(k)
alpha3.41545458306883
beta0.253765395233233
S.D.0.0835855957107396
T-STAT3.03599433700785
p-value0.00786565540752056


Regression: ln S.E.(k) = alpha + beta * ln Mean(k)
alpha-0.416082336256733
beta0.80001505087942
S.D.0.131998578907583
T-STAT6.06078533193559
p-value1.6516055456285e-05
Lambda0.199984949120579

\begin{tabular}{lllllllll}
\hline
Regression: ln S.E.(k) = alpha + beta * ln Mean(k) \tabularnewline
alpha & -0.416082336256733 \tabularnewline
beta & 0.80001505087942 \tabularnewline
S.D. & 0.131998578907583 \tabularnewline
T-STAT & 6.06078533193559 \tabularnewline
p-value & 1.6516055456285e-05 \tabularnewline
Lambda & 0.199984949120579 \tabularnewline
\hline
\end{tabular}
%Source: https://freestatistics.org/blog/index.php?pk=105764&T=3

[TABLE]
[ROW][C]Regression: ln S.E.(k) = alpha + beta * ln Mean(k)[/C][/ROW]
[ROW][C]alpha[/C][C]-0.416082336256733[/C][/ROW]
[ROW][C]beta[/C][C]0.80001505087942[/C][/ROW]
[ROW][C]S.D.[/C][C]0.131998578907583[/C][/ROW]
[ROW][C]T-STAT[/C][C]6.06078533193559[/C][/ROW]
[ROW][C]p-value[/C][C]1.6516055456285e-05[/C][/ROW]
[ROW][C]Lambda[/C][C]0.199984949120579[/C][/ROW]
[/TABLE]
Source: https://freestatistics.org/blog/index.php?pk=105764&T=3

Globally Unique Identifier (entire table): ba.freestatistics.org/blog/index.php?pk=105764&T=3

As an alternative you can also use a QR Code:  

The GUIDs for individual cells are displayed in the table below:

Regression: ln S.E.(k) = alpha + beta * ln Mean(k)
alpha-0.416082336256733
beta0.80001505087942
S.D.0.131998578907583
T-STAT6.06078533193559
p-value1.6516055456285e-05
Lambda0.199984949120579


Parameters (Session):
par1 = 4 ;
Parameters (R input):
par1 = 4 ;
R code (references can be found in the software module):
par1 <- as.numeric(par1)
(n <- length(x))
(np <- floor(n / par1))
arr <- array(NA,dim=c(par1,np))
j <- 0
k <- 1
for (i in 1:(np*par1))
{
j = j + 1
arr[j,k] <- x[i]
if (j == par1) {
j = 0
k=k+1
}
}
arr
arr.mean <- array(NA,dim=np)
arr.sd <- array(NA,dim=np)
arr.range <- array(NA,dim=np)
for (j in 1:np)
{
arr.mean[j] <- mean(arr[,j],na.rm=TRUE)
arr.sd[j] <- sd(arr[,j],na.rm=TRUE)
arr.range[j] <- max(arr[,j],na.rm=TRUE) - min(arr[,j],na.rm=TRUE)
}
arr.mean
arr.sd
arr.range
(lm1 <- lm(arr.sd~arr.mean))
(lnlm1 <- lm(log(arr.sd)~log(arr.mean)))
(lm2 <- lm(arr.range~arr.mean))
bitmap(file='test1.png')
plot(arr.mean,arr.sd,main='Standard Deviation-Mean Plot',xlab='mean',ylab='standard deviation')
dev.off()
bitmap(file='test2.png')
plot(arr.mean,arr.range,main='Range-Mean Plot',xlab='mean',ylab='range')
dev.off()
load(file='createtable')
a<-table.start()
a<-table.row.start(a)
a<-table.element(a,'Standard Deviation-Mean Plot',4,TRUE)
a<-table.row.end(a)
a<-table.row.start(a)
a<-table.element(a,'Section',header=TRUE)
a<-table.element(a,'Mean',header=TRUE)
a<-table.element(a,'Standard Deviation',header=TRUE)
a<-table.element(a,'Range',header=TRUE)
a<-table.row.end(a)
for (j in 1:np) {
a<-table.row.start(a)
a<-table.element(a,j,header=TRUE)
a<-table.element(a,arr.mean[j])
a<-table.element(a,arr.sd[j] )
a<-table.element(a,arr.range[j] )
a<-table.row.end(a)
}
a<-table.end(a)
table.save(a,file='mytable.tab')
a<-table.start()
a<-table.row.start(a)
a<-table.element(a,'Regression: S.E.(k) = alpha + beta * Mean(k)',2,TRUE)
a<-table.row.end(a)
a<-table.row.start(a)
a<-table.element(a,'alpha',header=TRUE)
a<-table.element(a,lm1$coefficients[[1]])
a<-table.row.end(a)
a<-table.row.start(a)
a<-table.element(a,'beta',header=TRUE)
a<-table.element(a,lm1$coefficients[[2]])
a<-table.row.end(a)
a<-table.row.start(a)
a<-table.element(a,'S.D.',header=TRUE)
a<-table.element(a,summary(lm1)$coefficients[2,2])
a<-table.row.end(a)
a<-table.row.start(a)
a<-table.element(a,'T-STAT',header=TRUE)
a<-table.element(a,summary(lm1)$coefficients[2,3])
a<-table.row.end(a)
a<-table.row.start(a)
a<-table.element(a,'p-value',header=TRUE)
a<-table.element(a,summary(lm1)$coefficients[2,4])
a<-table.row.end(a)
a<-table.end(a)
table.save(a,file='mytable1.tab')
a<-table.start()
a<-table.row.start(a)
a<-table.element(a,'Regression: ln S.E.(k) = alpha + beta * ln Mean(k)',2,TRUE)
a<-table.row.end(a)
a<-table.row.start(a)
a<-table.element(a,'alpha',header=TRUE)
a<-table.element(a,lnlm1$coefficients[[1]])
a<-table.row.end(a)
a<-table.row.start(a)
a<-table.element(a,'beta',header=TRUE)
a<-table.element(a,lnlm1$coefficients[[2]])
a<-table.row.end(a)
a<-table.row.start(a)
a<-table.element(a,'S.D.',header=TRUE)
a<-table.element(a,summary(lnlm1)$coefficients[2,2])
a<-table.row.end(a)
a<-table.row.start(a)
a<-table.element(a,'T-STAT',header=TRUE)
a<-table.element(a,summary(lnlm1)$coefficients[2,3])
a<-table.row.end(a)
a<-table.row.start(a)
a<-table.element(a,'p-value',header=TRUE)
a<-table.element(a,summary(lnlm1)$coefficients[2,4])
a<-table.row.end(a)
a<-table.row.start(a)
a<-table.element(a,'Lambda',header=TRUE)
a<-table.element(a,1-lnlm1$coefficients[[2]])
a<-table.row.end(a)
a<-table.end(a)
table.save(a,file='mytable2.tab')